3385
Classifying healthy versus NAFLD mice from liver fatty acids’ 1H-MRS at 9.4 T using SVMs1Institute for Mathematical and Computational Engineering, Pontificia Universidad Católica de Chile, Santiago, Chile, 2Millennium Nucleus for Cardiovascular Magnetic Resonance, Santiago, Chile, 3Instituto de Ciencias de la Ingeniería, Universidad de O’Higgins, Rancagua, Chile, 4Biomedical Imaging Center, Pontificia Universidad Católica de Chile, Santiago, Chile, 5Radiology Department, School of Medicine, Pontificia Universidad Católica de Chile, Santiago, Chile, 6Institute for Biological and Medical Engineering, Pontificia Universidad Católica de Chile, Santiago, Chile, 7Millennium Nucleus Center for the Discovery of Structure in Complex Data, Santiago, Chile
Synopsis
Nonalcoholic fatty liver disease (NAFLD) is a common liver disorder that is the first step in a cascade of liver damage. Hence, there is a clinical need for non-invasive, early identification of patients. We hypothesize that the intra-hepatocyte fatty acid composition provides information about NAFLD. To test this, the 1H-MRS spectra of fatty acids in the livers of healthy and NAFLD mice were measured at 9.4 T. Exploratory data analysis shows the spectra can be correctly classified with SVMs. Our results open an opportunity to develop a non-invasive tool for staging NAFLD patients without the need of liver biopsy.
Introduction
Nonalcoholic fatty liver disease (NAFLD) is one of the most common liver disorders worldwide. NAFLD is a condition defined by the excessive fat accumulation, in the form of triglycerides, in the liver. Liver steatosis (NAFL) is the first step in a cascade of liver damage that could lead to liver inflammation, known as non-alcoholic steatohepatitis (NASH), liver fibrosis, cirrhosis and hepatocellular carcinoma. Liver biopsy is the current gold standard for the diagnosis of NAFLD and its staging in simple steatosis or NASH or cirrhosis1. Since there prevalence of NAFLD is high, there is a clinical need for non-invasive risk stratification and early identification of patients2. We hypothesize that the intra-hepatocyte fatty acid composition provides information about the NAFLD stage. Using 1H-MRS at 9.4 T we obtain the spectra of the fatty acids (FA) extracted from the liver in one mouse model of NAFLD/NASH at different stages, and compare it with those in the control group. Additionally, the disease stage was confirmed by histology.Methods
The mice model for NAFLD and control were: (i) C57BL/6 adult male mice were fed with Western diet for 10 and 24 weeks (6 mice per time point). (ii) C57BL/6 adult male mice fed with a chow diet were used as controls (12 mice in total). Intracellular liver FA were extracted followed by esterification to obtain more stable fatty acid methyl esters (FAME)3. 1H-MRS spectra of FAME samples were obtained using a Bruker Avance spectrometer operating at 9.4 T with the acquisition protocol Zg30 (30 degrees excitation pulse). The data analysis was performed over the entire spectrum. Liver sections from mice livers were fixed in 10% of formalin and embedded in paraffin. Then 5 mm tissue sections were stained with hematoxylin/eosin, oil red and Picrosirius Red. Histopathological analyses were performed by a blinded pathologist who obtained the NAFLD Activity Score (NAS) to confirm that the mice fed with Western diet had NAFLD and mice fed with a chow diet had a healthy liver. The spectra were truncated to the range of 0.61 to 5.36 ppm and sampled each 0.00028 ppm. The peak at 3.5 ppm, corresponding to the methyl ester (CH3), was manually eliminated from each spectrum by replacing with zeros the values between 3.22 ppm and 4.22 ppm. Finally, each spectra was normalized so that its integral equals one.Analysis of spectra
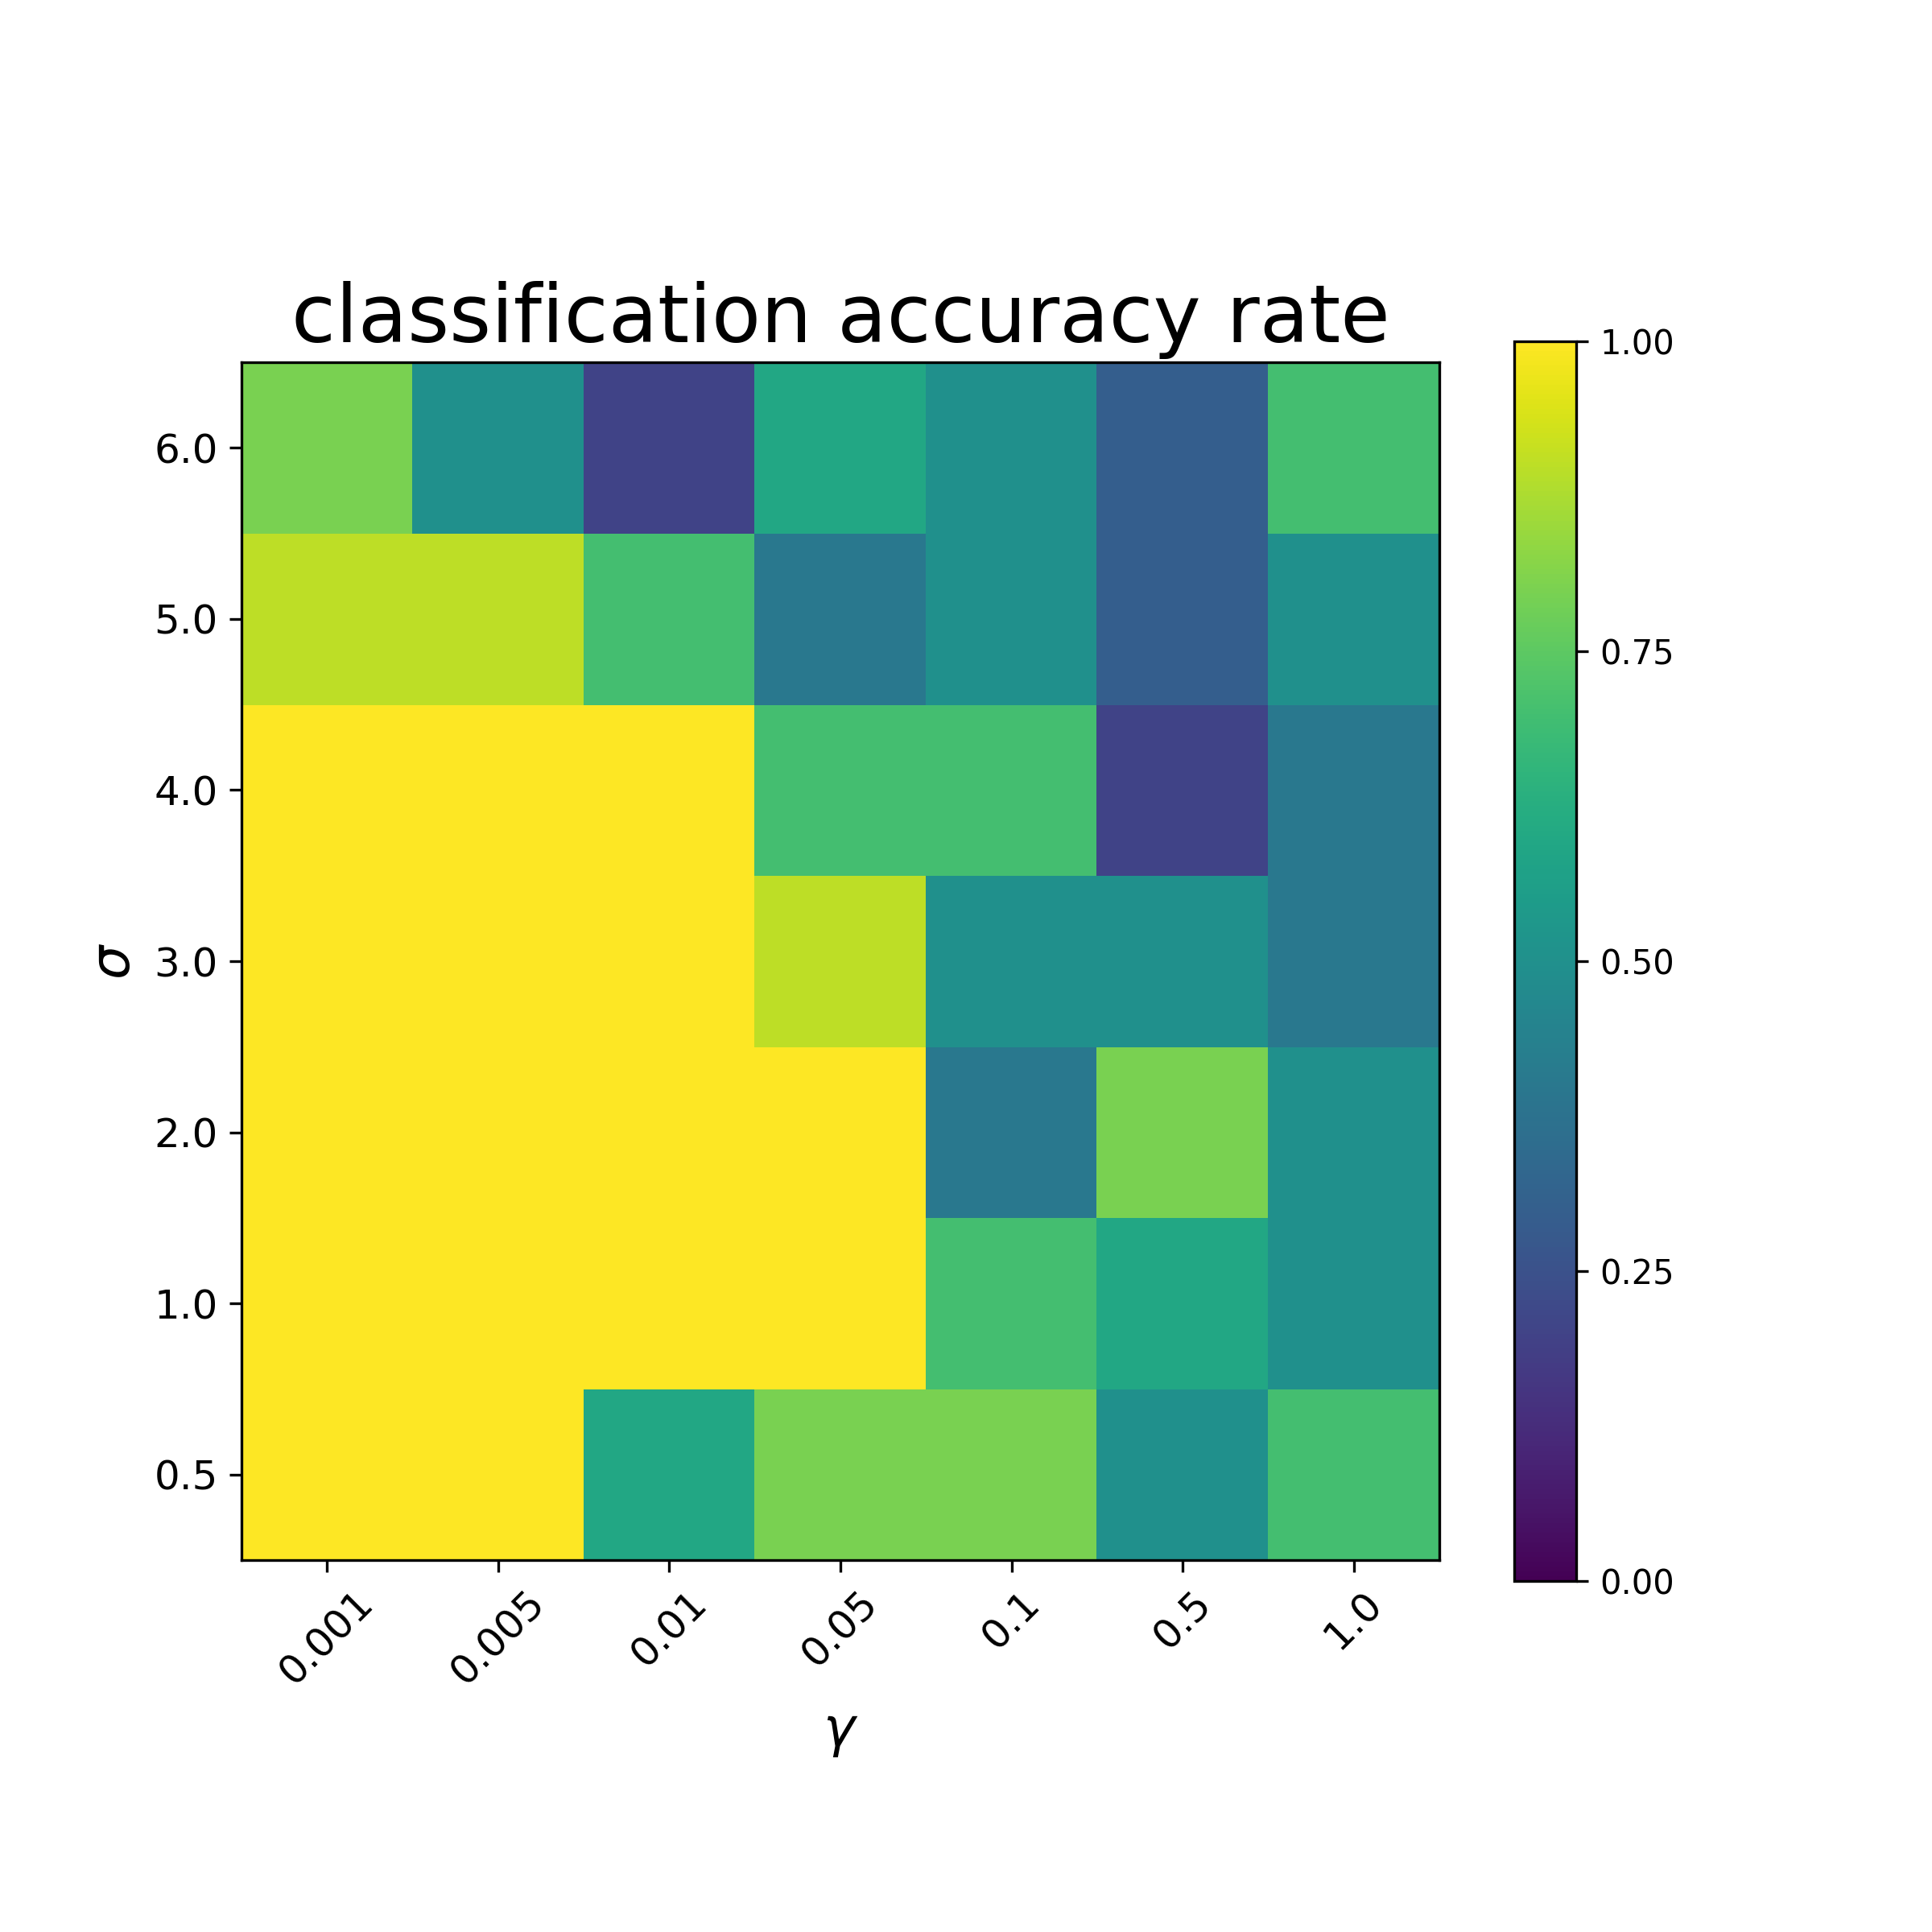
Exploratory analysis of the data using PCA4 shows it is concentrated on a 2-dimensional space (Fig. 1A) and are linearly separable (Fig. 1B). The leading principal components show the effect of different ppm values on the variability of the data (Fig. 1C-E). The first component shows the importance of the range near 2.8 ppm. Due to its linear separability, an SVM5 was trained with 1H-MRS spectra at 9.4 T. The classification and support vectors, and the margin are shown in Fig. 2. This suggests an SVM can correctly classify NAFLD and control groups from 1H-MRS spectra at 9.4 T. To assess the performance of the SVM on 1H-MRS spectra at low-intensity fields, we generate synthetic data by taking convolutions of the 1H-MRS spectra at 9.4 T with Lorentzian functions $$h_{\gamma}(p) = \frac{1}{\pi \gamma}\frac{1}{(p/\gamma)^2 + 1}$$ as the ideal MRS signal in the Fourier domain has a Lorentzian form6. In Fig. 3 we see the average spectrum after convolution with a Lorentzian with increasing values of $$$\gamma$$$. The same classification vector is able to separate the two groups in all cases. The classification margin degrades gracefully (Fig. 4). Hence, our results may be extrapolated to 1H-MRS spectra at low-intensity fields when the SNR is high. To analyze the effects of noise, we generate synthetic data as follows: (i) we sample a 1H-MRS spectra at 9.4 T at random, (ii) we convolve it with a Lorentzian function with scaling parameter gamma, (iii) we add complex Gaussian noise of increasingly large variance sigma, and (iv) we take absolute value to obtain a valid spectrum. Hence $$x(p) = f_k \ast h_{\gamma}(p) + \frac{\sigma}{\sqrt{2}}(Z_p + i Z_{p'})$$ where $$$k$$$ is chosen at random among the 24 data points and $$$Z_p,Z_p'$$$ are independent and identically distributed Gaussian variables. We take 10 independent samples of this process for each pair $$$(\gamma,\sigma)$$$, and classify it using the SVM. The accuracy is shown in Fig. 5. As expected, the performance degrades for large values of $$$\gamma$$$, i.e., low-intensity fields, and low SNR. However, this suggests the classifier can be extended with reasonably good performance to 1H-MRS spectra at specific combinations of low-intensity fields and SNR levels.Conclusion
Exploratory analysis of 1H-MRS spectra at 9.4 T from healthy and NAFLD mice shows the spectra are linearly separable. We trained an SVM which can exactly classify both groups. To assess whether this method can be used for data acquired with low-intensity fields on low SNR, we performed experiments with synthetic data. The SVM correctly classifies the spectra at low-intensity fields. However, as the intensity of the field decreases, the accuracy becomes more sensitive to the SNR. Future work will address the trade-off between these effects, opening an opportunity to develop a non-invasive tool for staging NAFLD patients without the need of liver biopsy.Acknowledgements
This publication has received funding from ANID – Millennium Science Initiative Program – grant Nucleus for Cardiovascular Magnetic Resonance NCN17_129, from ANID – Millennium Science Initiative Program – Nucleus Center for Discovery of Structure in Complex Data NCN17_059, FONDECYT 1211643, 3210458 and 1180525, and REDES 180090.References
1. Powell EE, Wong VW, Rinella M. Non-alcoholic fatty liver disease. Lancet 2021;397:2212-2224
2. Younossi ZM. Non-alcoholic fatty liver disease - A global public health perspective. J Hepatol 2019;70:531-544
3. Xavier A ZF, Gainza C, Cabrera D, Arrese M, Uribe S, Sing-Long C, Andia ME. Intrahepatic fatty acids composition as a biomarker of NAFLD progression from steatosis to NASH by using 1H-MRS. RSC Adv 2019;9:42132-42139
4. Jolliffe, IT. Principal Component Analysis, Second edition. New York: Springer-Verlag New York, Inc 2002
5. Vapnik, V. The Nature of Statistical Learning Theory. Springer Science & Business Media 1998
6. Levitt, MH. Spin Dynamics: Basics of Nuclear Magnetic Resonance. John Wiley & Sons 2013
Figures