3384
A clustering method to classify stages of NAFLD based on the metabolites results obtained in two mouse models with MRS1Instituto de Ciencias de la Ingeniería, Universidad de O’Higgins, Rancagua, Chile, 2Millennium Nucleus for Cardiovascular Magnetic Resonance, Santiago, Chile, 3Biomedical Imaging Center, Pontificia Universidad Católica de Chile, Santiago, Chile, 4Millennium Nucleus Center for the Discovery of Structures in Complex Data, Santiago, Chile, 5Institute for Mathematical and Computational Engineering, Pontificia Universidad Católica de Chile, Santiago, Chile, 6Faculty of Chemistry and Pharmacy, Pontificia Universidad Católica de Chile, Santiago, Chile, 7Research Center for Nanotechnology and Advanced Materials CIEN-UC, Pontificia Universidad Católica de Chile, Santiago, Chile, 8Institute for Biological and Medical Engineering, Pontificia Universidad Católica de Chile, Santiago, Chile, 9Gastroenterology Department, Pontificia Universidad Católica de Chile, Santiago, Chile, 10Faculty of Medical Sciences, Universidad Bernardo O’Higgins, Santiago, Chile, 11Center of Aging and Regeneration (CARE), Pontificia Universidad Católica de Chile, Santiago, Chile, 12Radiology Department, School of Medicine, Pontificia Universidad Católica de Chile, Santiago, Chile
Synopsis
In this study, we analyzed the liver fatty acids results obtained by magnetic resonance spectroscopy and gas chromatography in non-alcoholic fatty liver disease (NAFLD) mice with principal component analysis (PCA) and a clustering method. The study was made with two different mouse models (CDAA and Western diet), and a control group. Our results, as evidenced by PCA, showed that the liver fatty acid composition changed as NAFLD progressed and it was possible to identify the 3 most relevant NAFLD groups with MRS (healthy, steatosis, and steatohepatitis) with excellent agreement with the gold-standard histopathological scores.
Introduction
Nonalcoholic fatty liver (NAFLD) refers to the spectrum of liver disease that starts with steatosis, and it may progress to steatohepatitis, fibrosis, cirrhosis, and hepatocarcinoma; it could result in liver transplantation or death. Additionally, it represents one of the most common causes of chronic liver disease whose prevalence is increasing throughout the world due to overweight and obesity in the population1. Unfortunately, the only method that can confirm the stage of this disease is the biopsy which is invasive and offers risk to the patient2. The non-invasive method available nowadays can accurately quantify the total amount of fat in the liver but does not discriminate between steatosis and steatohepatitis. In this study, we aim to investigate the liver fatty acids composition of ex-vivo liver lipids using 1H-MRS and GC-MS in a NAFLD mice model and to use principal component analysis (PCA) with a clustering method to group the mice according to the stage of the disease.Methods
We fed a group of C57BL/6 male mice with (i) western diet, (ii) CDAA diet and (iii) chow diet for 4 weeks, 10 weeks, and 24 weeks (n=6, each group). A sample of the liver was used for histology analysis and most of the liver was used to extract their fatty acids methyl esters (FAMEs) using a protocol adapted by Folch et al (1957)3. The histological evaluation was made following the criteria of Kleiner et al (2005)4, which evaluates the grade of steatosis, inflammation, ballooning, and fibrosis. FAME was used due to its stability compared with fatty acids. Those FAMEs were analyzed by using gas chromatography with a mass spectrometer (GC-MS), which is the gold standard to quantify fatty acids, and MRS. The spectroscopy pulse programming was the Zg30. The acquisition parameters were: spectral width 8012.820 Hz, relaxation delay 1 s, number of scans 16, flip angle 30 to avoid T1 relaxation effects, and total acquisition time 48.72 s.Results/Discussion
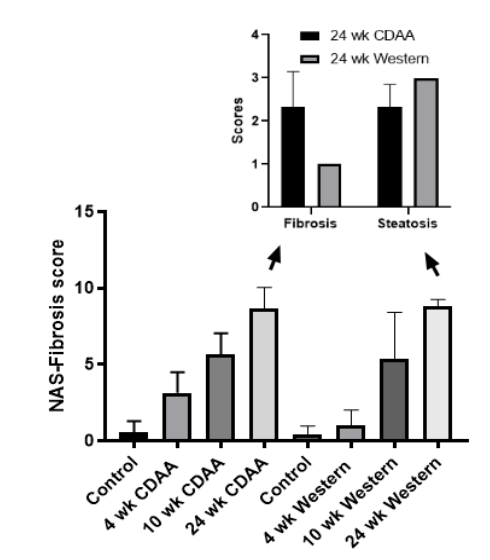
Mice fed with Western diet increased their weight from 28.3 ± 2.7 grams (4 weeks-diet) to 46.2±2.1 grams (24 weeks-diet), p<0.05. The amount of fat stored in the hepatocytes during the diet intervention increased from 5.8±2.1 % (4 weeks-diet) to 23.6±2.5% (24 weeks-diet), p<0.05. Histological analysis confirmed the progression of fat liver content (fig. 1).Mice fed with the CDAA diet increased their weights and the amount of fat stored in the hepatocytes during the diet intervention compared with the control group, however it remained the same during the CDAA diet intervention. The liver fat content decreased from 12.39±3.80 (4 weeks-diet) to 8.63±2.81 (24 weeks-diet), p<0.05, showing signs of fibrosis. Histological analysis confirmed the progression of the disease and found that the NASH-fibrosis score in 24 weeks diet was high, but mainly due to fibrosis (fig.1).
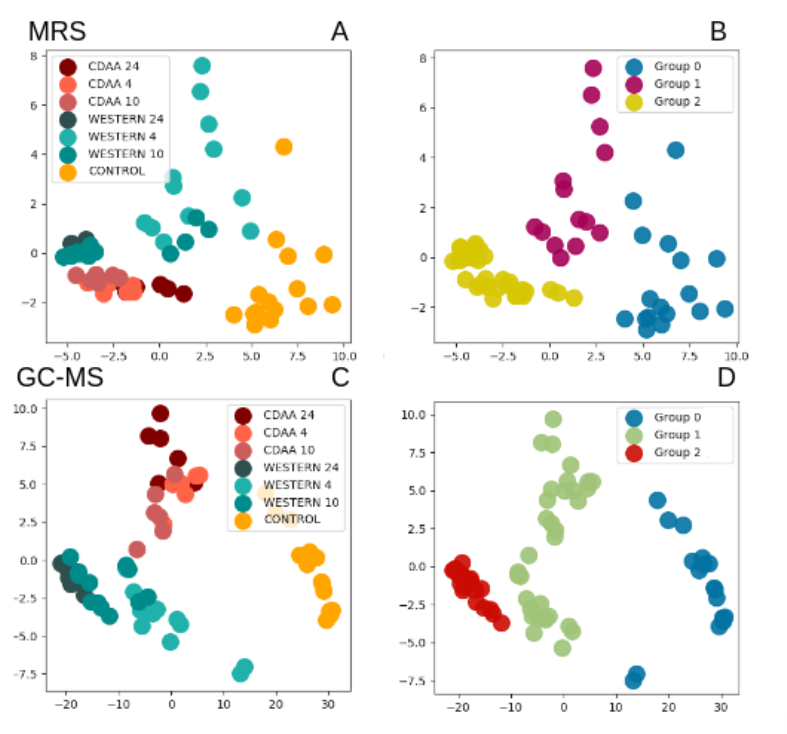
From the MRS results, we found 7 peaks corresponding to fatty acids, they were quantified and used as input to the principal component analysis. From the GC-MS results, we identified 12 main fatty acids, also quantified and used as the input. The graph can be seen in Figure 2 where the first principal component is the normalized linear combination of the data features that has the largest variance (x-axis). The second component explains the largest variance uncorrelated to the first component (y-axis).
With MRS it was possible to identify the three main groups of NAFLD: Healthy, steatosis, and NASH (Group 0, 1, and 2 shown in the figure, respectively). The mice with fibrosis, cirrhosis, and hepatocarcinoma were grouped together with NASH. With GC-MS it fails to classify the NASH liver with the CDAA diet, since the method groups it together with the mice with steatosis, showing some dependence on the diet intake.
Conclusion
Our results, as evidenced by PCA, showed that the liver fatty acid composition changes as NAFLD progresses and it was possible to identify the 3 most relevant NAFLD groups with MRS with excellent agreement with gold-standard histopathological scores. Further studies now are needed to apply the same methodology to in-vivo MRS in order to transfer it to clinical applications.Acknowledgements
This publication has received funding from Millennium Science Initiative of the Ministry of Economy, Development and Tourism, grant Nucleus for Cardiovascular Magnetic Resonance and grant Nucleus Center for Discovery of Structure in Complex Data, and FONDECYT 1180525, 1211643 and 3210458.References
1- Neuschwander-Tetri, 2017
2- Ahmed, M. World J Hepatol 2015 June 18; 7(11): 1450-1459.
3- Kleiner, D. E., et al. (2005). Hepatology, 41(6), 1313-1321.
4- Folch et al. The Jour Bio Chem. 226(1) ,1957.
Figures