3382
A cross-modality deep learning model for esophageal cancer segmentation and quantitation on 18F-FDG PET/CT and diffusion weighted MRI1The University of Texas MD Anderson Cancer Center, Houston, TX, United States
Synopsis
We applied a deep learning (DL) model developed for 18F-FDG PET/CT of mantle cell lymphoma to esophageal cancers on 18F-FDG PET/CT and diffusion-weighted MRI. We compared the performance of the DL-based segmentation with the manual segmentation on PET and evaluated the quantitation on both PET and apparent diffusion coefficient (ADC). The model achieved promising results of detecting and segmenting esophageal cancers, and the DL-based imaging metrics were consistent with the reference standards.
Introduction
Tumor segmentation is an essential step in quantitative imaging of cancer, which has been found valuable for therapeutic efficacy assessment and treatment response prediction. Presently, tumor segmentation mostly relies on manual or semi-automated contouring by experts. A severe drawback is the required labor and large inter-observer variability, which can be practically prohibitive in cross-modality and volumetric applications. In this work, we applied a deep learning (DL) model that was previously built on 18F-FDG PET/CT of mantle cell lymphoma (MCL) to 18F-FDG PET/CT and diffusion-weighted MRI of esophageal cancers (ECs). We compared the performance of the DL-based segmentation with the manual segmentation on PET and evaluated the quantitation on both PET and apparent diffusion coefficient (ADC).Methods
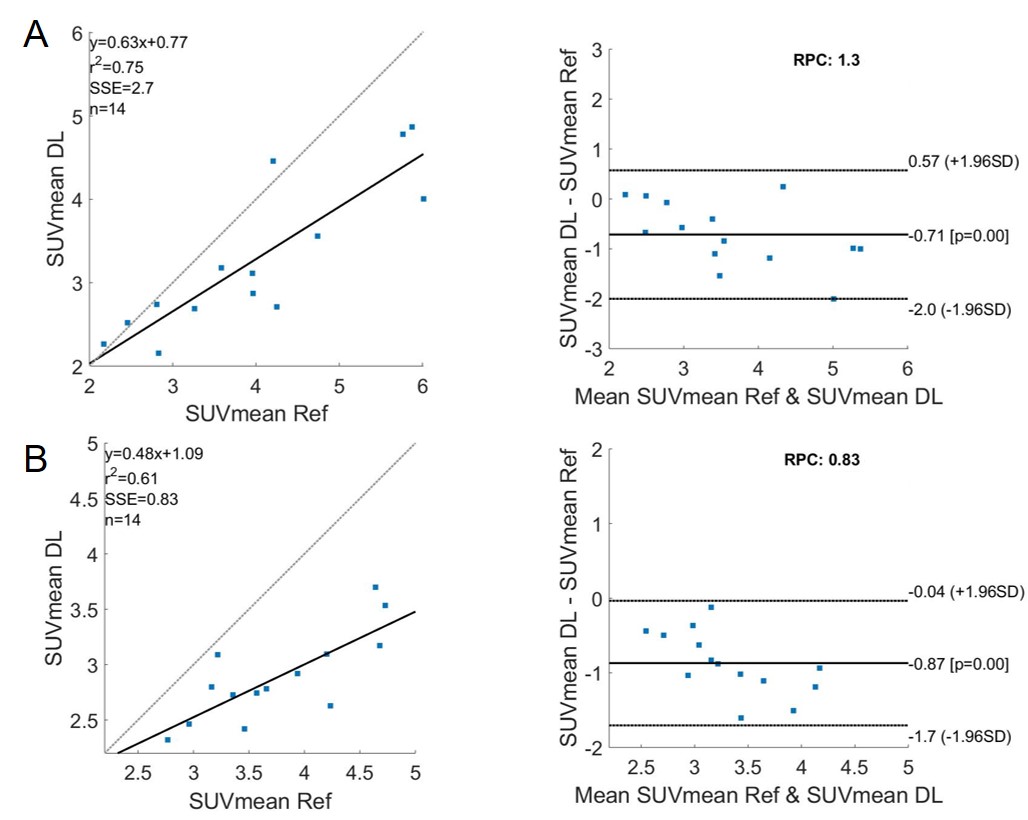
The DL model was built in a prior study on baseline 18F-FDG PET/CT scans of 112 patients with MCL and was validated on 32 outside institutional patients of the same disease [1]. For the 14 EC patients in this study, we used 18F-FDG PET/CT and DWI that were collected contemporaneously but on separate scanners. Both the baseline and chemoradiation mid-treatment scans were used. Using MIM software (v6.6, Beachwood, OH), we co-registered the DWI and ADC maps with the PET images acquired at the same timepoints. The co-registration was semi-automatic and manually adjusted as needed.Similar as the original MCL cohorts, the PET/CT images of the EC cohort were separated into two input channels, formatted as three-slice slabs, uniformly resized to 128 × 128, and normalized between [0, 1] for each channel. The PET-registered DWI and ADC maps were resized to the same matrix size of 128 × 128, with the field of view aligned to 50 × 50 cm2. Manual segmentation of ECs confirmed by radiologists were considered as the reference standard. The output segmentation masks by the DL model were used to extract the maximum and mean standard uptake values (SUVmax, SUVmean) on PET. The masks were then applied to the PET-registered DWI and ADC maps to extract the mean ADC (ADCmean). The DL generated segmentations were compared with the reference standard using Dice coefficient. The DL-based SUVmax, SUVmean, and ADCmean were also compared with the reference standard values. Bland-Altman plots were generated for these imaging metrics.
Results
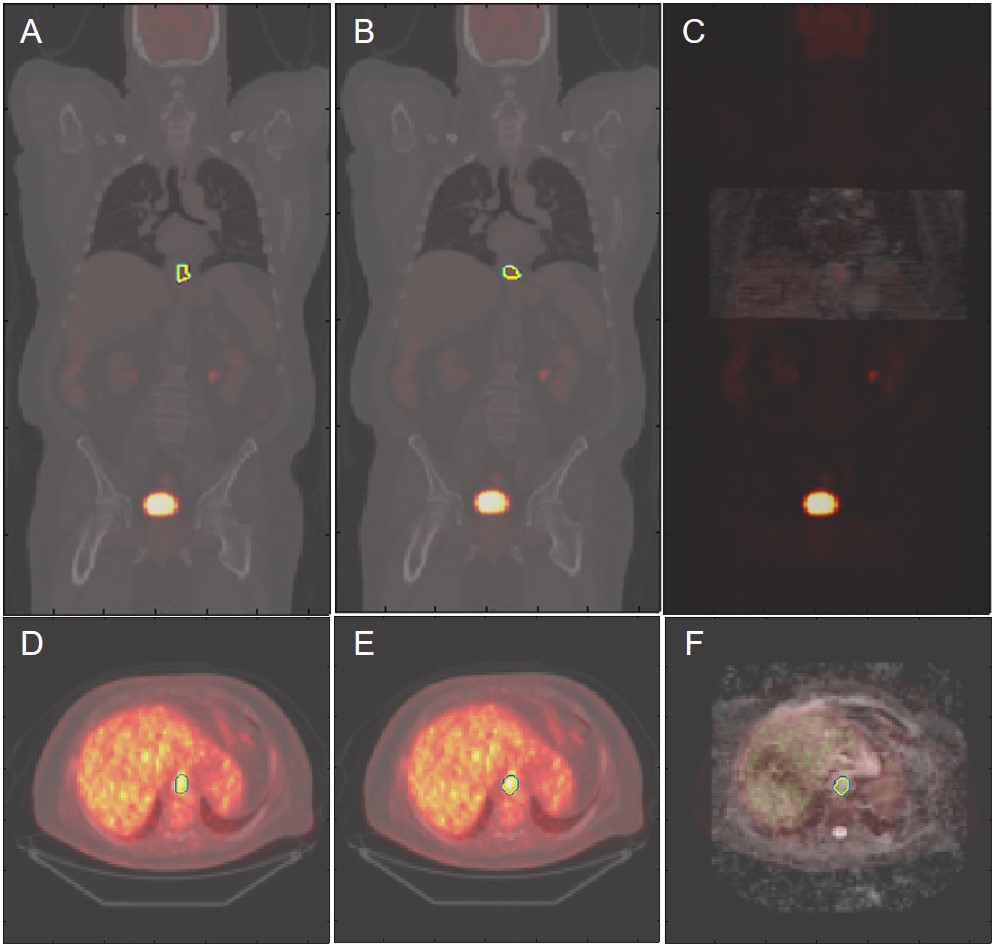
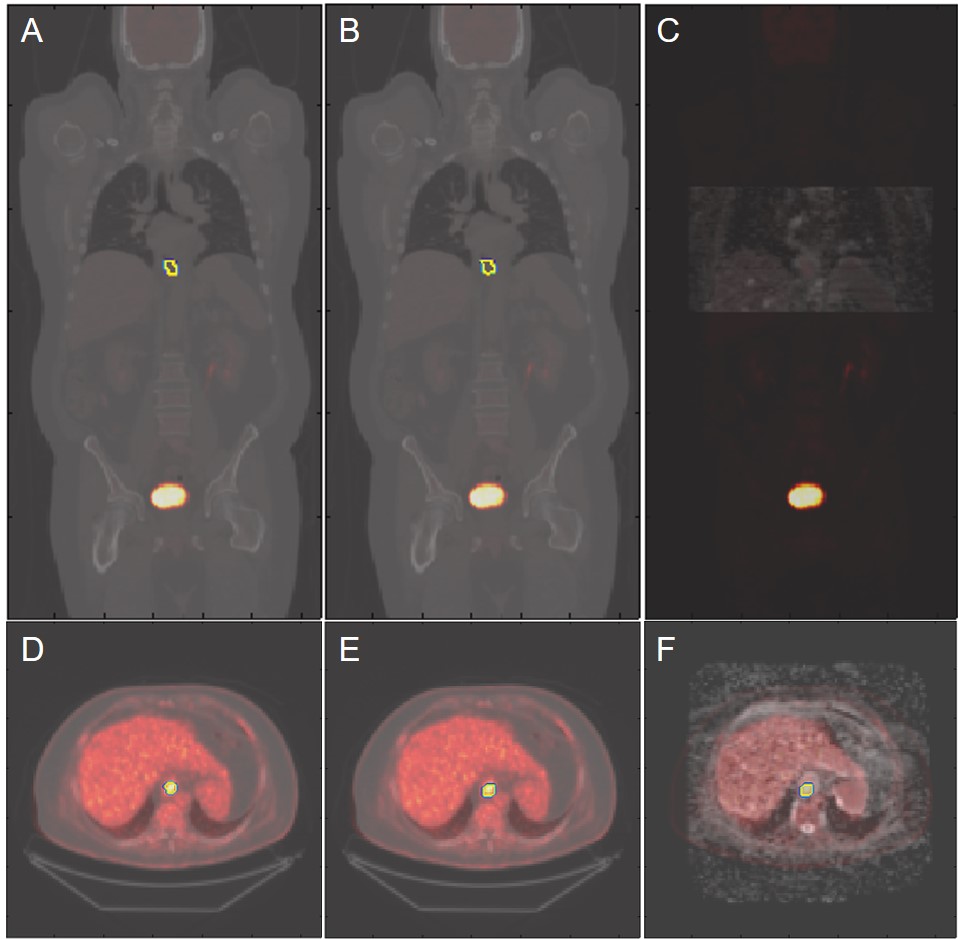
All ECs were detected by the model, achieving a sensitivity of 100%. On average, for baseline scans, the DL segmentation had a Dice score of 0.65. The reference standard and DL-based SUVmax are 9.02/8.88 g/ml, SUVmean are 3.99/3.28 g/ml, and ADCmean are 1.907/1.903 × 10-3 mm2/s. Compared to the reference standard, the (mean ± standard deviation) of the metrics’ differences are (-1.5 ± 5.6)%, (-15.8 ± 13.7)%, and (0.2 ± 9.2)%, respectively. For chemoradiation mid-treatment scans, the DL segmentation had an averaged Dice score of 0.56. The reference standard and DL-based SUVmax are 6.81/6.77 g/ml, SUVmean are 3.76/2.89 g/ml, and ADCmean are 2.123/2.118 × 10-3 mm2/s. Compared to the reference standard, the (mean ± standard deviation) of the metrics’ differences are (-0.5 ± 1.7)%, (-22.3 ± 8.7)%, and (-1.3 ± 6.5)%, respectively. Bland-Altman plots comparing the imaging metrics between the DL-based and reference standards are shown in Figures 1-3. Example baseline and mid-treatment segmentations are illustrated in Figures 4-5.Discussion and Conclusion
Using a previously trained DL model that was built on MCL 18F-FDG PET/CT, our study demonstrates that a DL model trained on a different tumor can be used to automatically segment EC on the same imaging modality. Further, the segmentation masks can be transposed to a different imaging modality for quantitative analyses. Compared with manual segmentations, the DL generated masks and imaging metrics are highly consistent with the reference standard, especially the SUVmax and ADCmean. Some mis-matched pixels in segmentation could have contributed to the less consistent SUVmean. In the future, training the model on both PET and MR images is expected to significantly improve the results [2].Acknowledgements
No acknowledgement found.References
[1] Zhou Z, Jain P, Lu Y, et al. Computer-aided detection of mantle cell lymphoma on 18F-FDG PET/CT using a deep learning convolutional neural network. Am J Nucl Med Mol Imaging 2021;11:260-270.
[2] Zaharchuk G. Next generation research applications for hybrid PET/MR and PET/CT imaging using deep learning. Eur J Nucl Med Mol Imaging 2019;46:2700-2707.
Figures