3378
Derivation of liver R2* and B0 maps from dual-echo MR images via deep learning1Stanford University, Stanford, CA, United States, 2Stanford University, Stanford University, CA, United States
Synopsis
Quantitative R2* map is an important liver disease indicator. However, the availability of R2* map is limited by the long scan time. In this study, we present a new paradigm to predict R2* and B0 maps from dual echo images. A self-attention deep convolutional neural network is trained and validated, where promising accuracy has been obtained. The proposed quantitative parametric mapping approach has a potential to eliminate the necessity for additional data acquisition other than clinical routine.
INTRODUCTION
Quantitative R2* mapping is important for the diagnosis and management of iron overload. However, obtaining R2* maps typically require the acquisition of six echoes with breath-holds, limiting its application in clinical practice. In this study, we present a new approach to predict R2* and B0 maps from only dual echo images.METHODS
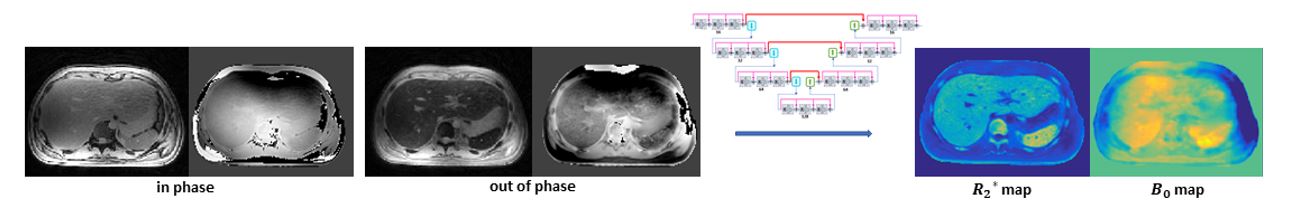
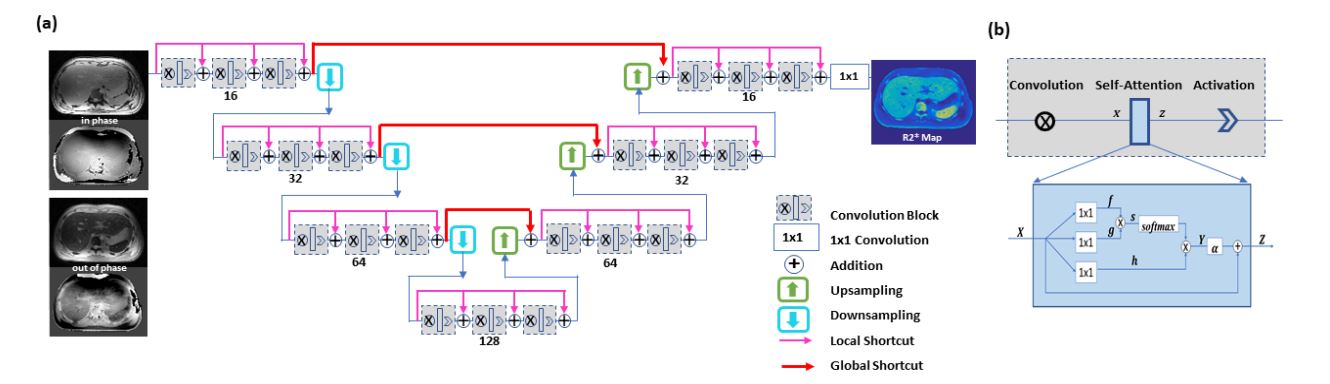
In this study, we develop a deep learning-based R2* mapping approach. Inspired by the feasibility to reduce the number of input images for quantitative parametric mapping [1], we aim to predict the R2* and B0 maps of liver from dual-echo images using deep convolutional neural networks. With IRB approval, free-breathing abdominal MR images were acquired from 26 patients that had iron overload on three 3T GE MR750 scanners. For every subject, six SPGR images were acquired using a multi-echo cones sequence [2] with TEs of 0.036, 1.048, 2.060, 3.072, 4.084, and 5.096 ms respectively, a TR of approximately 11ms, and a flip angle of 3°. To derive a quantitative parametric map from dual-echo input images, a deep neural network is employed, as illustrated in Figure 1. Here, the ground truth R2* and B0 maps were calculated from six multi-echo images based on the confounder model [3], which combines least squares fitting of complex-valued source images with multi-peak fat modeling. Only the images with TE of 1.048ms and TE of 4.084ms were then used as input images.A special self-attention convolutional neural network framework4 is constructed to provide direct mapping from input images to a corresponding parametric map or field map (Fig. 2). A hierarchical network architecture is adopted to enable feature extraction at various scales. Both global and densely connected local shortcuts facilitate residual learning. Furthermore, the attention mechanism is integrated to make efficient use of non-local information.
The quality of input images and ground truth maps are evaluated by two radiologists, particularly in terms of motion artifacts that sometimes occur with free breathing (despite the motion robustness provided by cones acquisition). Only high-quality data sets are selected for model training and testing, including 1224 slice images from 26 subjects. To increase the training sets as much as possible, the leave-one-out cross-validation is applied. A loss function defined as loss = l1 + c*(1-SSIM) is employed [42]. Here, l1 is responsible for minimizing uniform biases, and SSIM (structural similarity index) preserves local structure and high-frequency contrast. c was empirically chosen as 5. In training, network parameters are updated using the Adam algorithm with alpha of 0.001, beta1 of 0.89, beta2 of 0.89, and e of 10^-8. This iterative procedure continues until convergence is reached. Subsequently in testing, quantitative R2* and B0 maps are automatically generated from dual-echo input images using the established network models. Quantitative analysis is applied within the Region of Interest (ROI), where whole liver is automatically segmented using the region growing algorithm. The averaged R2* and B0 were calculated for every 3D image, and corresponding Bland-Altman plots are shown.
RESULTS
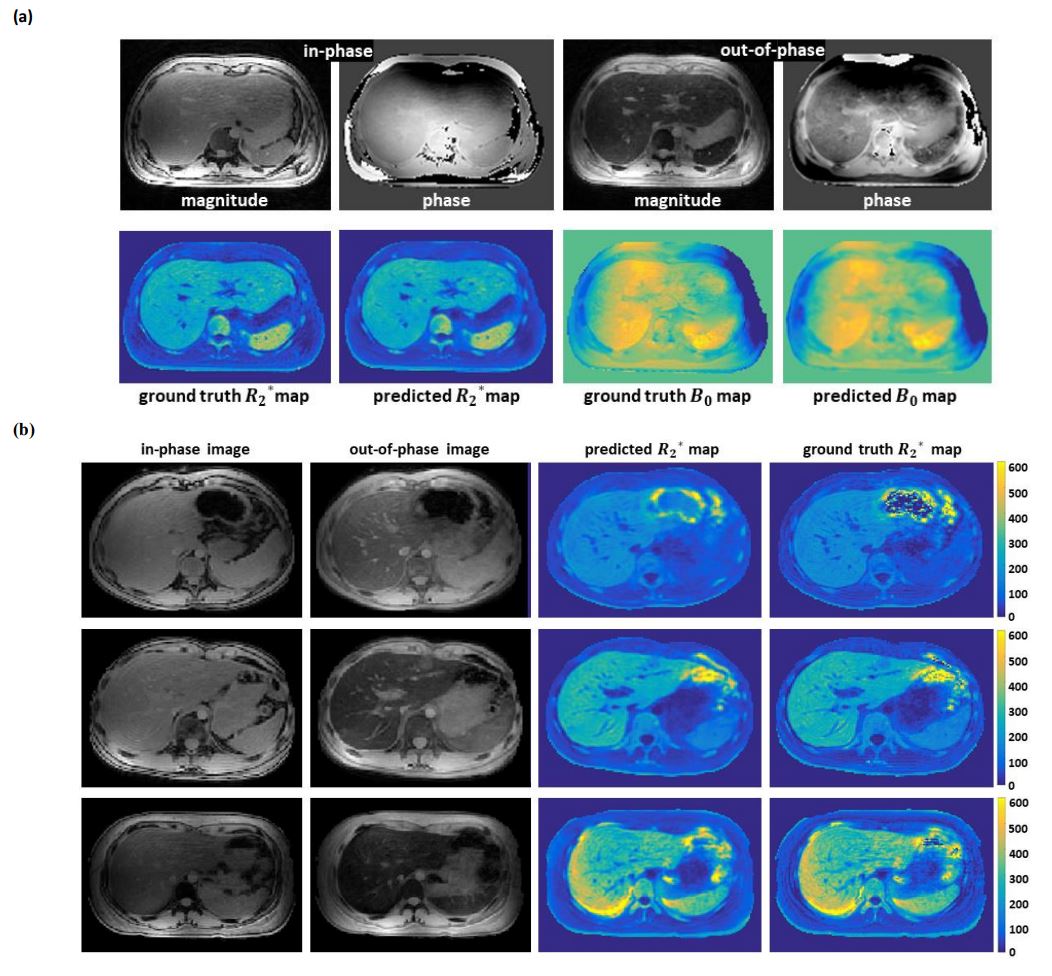
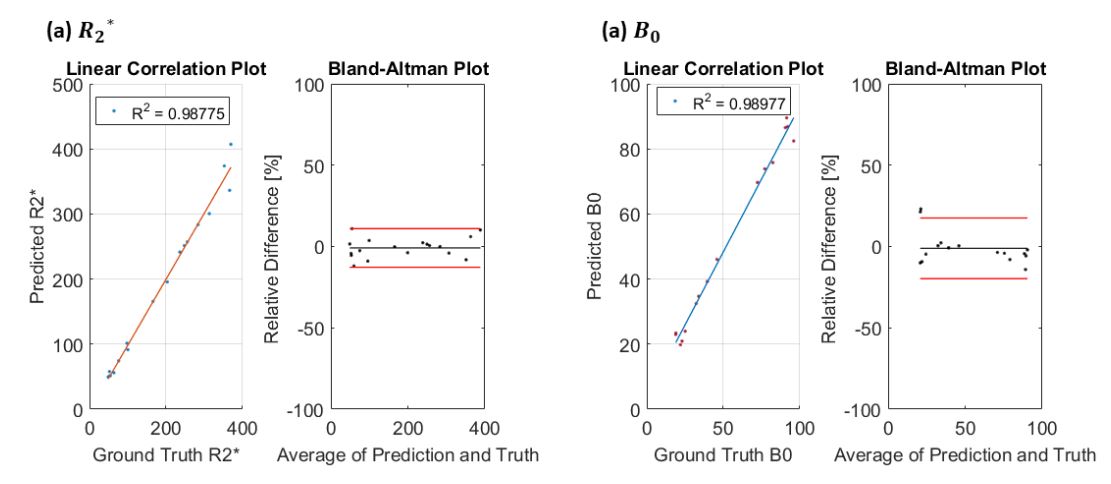
Using established deep learning models, R2* and B0 maps are predicted from corresponding dual-echo images. The resultant maps demonstrate strong correlations to the ground truth. A representative case is shown in Figure 8a. Additional examples of R2* maps with various iron overload levels are displayed in Figure 8b. Quantitative results of R2* and B0 mapping are presented in Figure 4. (a) linear correlation between the predicted and ground truth R2* as well as corresponding Bland-Altman plot. (b) linear correlation between the predicted and ground truth B0 as well as corresponding Bland-Altman plot.DISCUSSION
In abdominal MRI, dual-echo imaging is a routine part of the clinical imaging protocol, and thus the proposed method has a potential to support quantitative parametric mapping without requiring additional data acquisition. In fact, this is an example of a generic multi-parametric mapping strategy, referred to as (Qualitative and Quantitative MRI), which derives quantitative parametric maps and field maps from standard MR images without additional data acquisition.CONCLUSION
A new data-driven strategy is proposed for R2* and B0 mapping from dual-echo images, with promising accuracy achieved.Acknowledgements
This research is partially supported by NIH/NCI (1R01 CA256890, 1R01 CA227713), NIH/NIAMS (1R01 AR068987), NIH/NINDS (1R01 NS092650), NIH/NIBIB (1R01 EB026136), NIH R01EB009690, NIH R01 EB026136, NIH R01DK117354, and GE Healthcare.
References
1. Wu, Yan, et al. "Accelerating quantitative MR imaging with the incorporation of B1 compensation using deep learning." Magnetic Resonance Imaging 72 (2020): 78-86.
2. Ong, Frank, et al. "Extreme MRI: Large‐scale volumetric dynamic imaging from continuous non‐gated acquisitions." Magnetic Resonance in Medicine (2020).
3. Armstrong, Tess, et al. "3D mapping of the placenta during early gestation using free‐breathing multiecho stack‐of‐radial MRI at 3T." Journal of Magnetic Resonance Imaging 49.1 (2019): 291-303.
4. Wu, Yan, et al. "Self-attention convolutional neural network for improved MR image reconstruction." Information Sciences 490 (2019): 317-328.
Figures