3377
Feasibility of Biliary Imaging at 0.55T: A Comparison to 1.5T1Department of Radiology, University of Michigan, Ann Arbor, MI, United States
Synopsis
MRCP exams were performed in three volunteers on 0.55T and 1.5T MRI systems. Images were rated on overall image quality and visualization of ducts by two board certified abdominal radiologists. All images on both systems were rated as excellent diagnostic quality. A paired sample t-test did not show significant differences in acquisition time between the two field strengths. The advantages of performing an MRCP exam on a 0.55T MRI system may include reduced susceptibility artifacts, reduced artifacts from cholecystectomy clips, improved patient comfort due to larger bore sizes, and potentially lower overhead costs.
Introduction
The goal of this study is to evaluate initial feasibility of MR cholangiopancreatography (MRCP) exams on a new FDA-approved 0.55T platform by comparing the image quality and acquisition time of low-field images to a conventional 1.5T platform. Low field magnetic resonance imaging (MRI) systems (B0 < 1.0T) are increasing in availability1. Possible advantages of low field MRI systems include lower cost, reduced susceptibility and metal artifacts, and the potential for deployment in lower-resource settings. However, a major challenge of imaging on low field systems is reduced signal-to-noise ratio (SNR). Despite this obstacle, previous studies have shown the feasibility of implementing cardiothoracic2-7, muskulosceletal8, neurological9, and liver10 MRI studies on various low field systems. However, MRCP sequences, used to visualize the biliary and pancreatic ducts, require high spatial resolution and SNR to produce a diagnostic quality image. In this work, we show that high-quality MRCP images can be acquired on a 0.55T MRI scanner without significantly increasing the acquisition time as compared to a 1.5T system.Methods
Non-contrast, fasted MRCP images were acquired on both an FDA-approved 0.55T (Free.Max) and a 1.5T (Sola) MRI system (Siemens Healthineers, Erlangen, Germany) in three healthy volunteers in this IRB-approved study. The MRCP sequence was a triggered free-breathing 3D turbo spin echo (TSE) acquisition with the following parameters: FOV=300mmx300mm, acquisition matrix= 256x238x72, NEX=1, zero-padded to effective spatial resolution=0.6x0.6x1 mm3, GRAPPA=3, slice partial Fourier=6/8. Acquisition time varied based on the subject’s respiration rate and was measured for each scan. Images were reviewed by two abdominal fellowship trained board certified radiologists with 15 and 12 years experience. Overall image quality and visualization of the pancreatic and biliary ducts were rated according to the four point Likert scales shown in Figure 1. A paired two-sided t-test was performed to compare the acquisition times between 0.55T and 1.5T.Results
The image quality ratings for both reviewers are shown in Figure 2. All images received a score of 4 (excellent) from both reviewers for overall image quality and visualization of ducts. The total acquisition times for the MRCP sequences are also listed in Figure 2. For two of the three subjects, the low-field acquisition was longer. However, the paired two-sided t-test yielded a p-value = 0.36, indicating that the low-field sequences are not significantly longer in this initial study. Maximum intensity projection (MIP) MRCP images from one volunteer are shown in Figure 3.Discussion
Because of the high spatial resolution and SNR required for MRCP, these examinations can be challenging, especially at lower magnetic fields where images can suffer from reduced SNR. However, performing MRCP exams on low-field scanners would be advantageous due to reduced artifacts from cholecystectomy clips (common in the population receiving MRCPs), improved patient comfort due to larger bore sizes, and lower overhead cost. Although the MRCP images at 0.55T have a visibly lower SNR than those collected at 1.5T, the results of this study show that MRCP images acquired at 0.55T have the same diagnostic utility as those acquired at 1.5T without a significant increase in acquisition time. In particular, no signal averaging was found to be needed for the low field acquisitions. Limitations of the small sample size will be addressed in future work, which will include acquiring data in more healthy volunteers as well as patients with pathology to better identify the clinical utility of low field MRI.Conclusion
While further data are needed, initial results suggest that MRCP exams performed on a 0.55T MRI system in healthy volunteers are of equivalent diagnostic quality to those performed on a conventional 1.5T system, without a significant increase in acquisition time.Acknowledgements
Research support from Siemens HealthineersReferences
[1] Marques JP, Simonis FFJ, Webb AG. Low-field MRI: An MR physics perspective. J Magn Reson Imaging. 2019 Jun;49(6):1528-1542. doi: 10.1002/jmri.26637.
[2] Campbell-Washburn AE, Ramasawmy R, Restivo MC, Bhattacharya I, Basar B, Herzka DA, Hansen MS, Rogers T, Bandettini WP, McGuirt DR, Mancini C, Grodzki D, Schneider R, Majeed W, Bhat H, Xue H, Moss J, Malayeri AA, Jones EC, Koretsky AP, Kellman P, Chen MY, Lederman RJ, Balaban RS. Opportunities in Interventional and Diagnostic Imaging by Using High-Performance Low-Field-Strength MRI. Radiology. 2019 Nov;293(2):384-393. doi: 10.1148/radiol.2019190452.
[3] Bandettini WP, Shanbhag SM, Mancini C, McGuirt DR, Kellman P, Xue H, Henry JL, Lowery M, Thein SL, Chen MY, Campbell-Washburn AE. A comparison of cine CMR imaging at 0.55 T and 1.5 T. J Cardiovasc Magn Reson. 2020 May 18;22(1):37. doi: 10.1186/s12968-020-00618-y.
[4] Kolandaivelu A, Bruce CG, Ramasawmy R, Yildirim DK, O'Brien KJ, Schenke WH, Rogers T, Campbell-Washburn AE, Lederman RJ, Herzka DA. Native contrast visualization and tissue characterization of myocardial radiofrequency ablation and acetic acid chemoablation lesions at 0.55 T. J Cardiovasc Magn Reson. 2021 May 6;23(1):50. doi: 10.1186/s12968-020-00693-1.
[5] Campbell-Washburn AE, Suffredini AF, Chen MY. High-Performance 0.55-T Lung MRI in Patient with COVID-19 Infection. Radiology. 2021 May;299(2):E246-E247. doi: 10.1148/radiol.2021204155.
[6] Campbell-Washburn AE, Malayeri AA, Jones EC, Moss J, Fennelly KP, Olivier KN, Chen MY. T2-weighted Lung Imaging Using a 0.55-T MRI System. Radiol Cardiothorac Imaging. 2021 Jun 10;3(3):e200611. doi: 10.1148/ryct.2021200611.
[7] Bhattacharya I, Ramasawmy R, Javed A, Chen MY, Benkert T, Majeed W, Lederman RJ, Moss J, Balaban RS, Campbell-Washburn AE. Oxygen-enhanced functional lung imaging using a contemporary 0.55 T MRI system. NMR Biomed. 2021 Aug;34(8):e4562. doi: 10.1002/nbm.4562.
[8] O'Reilly T, Webb AG. In vivo T1 and T2 relaxation time maps of brain tissue, skeletal muscle, and lipid measured in healthy volunteers at 50 mT. Magn Reson Med. 2021 Sep 14. doi: 10.1002/mrm.29009.
[9] Mazurek MH, Cahn BA, Yuen MM, Prabhat AM, Chavva IR, Shah JT, Crawford AL, Welch EB, Rothberg J, Sacolick L, Poole M, Wira C, Matouk CC, Ward A, Timario N, Leasure A, Beekman R, Peng TJ, Witsch J, Antonios JP, Falcone GJ, Gobeske KT, Petersen N, Schindler J, Sansing L, Gilmore EJ, Hwang DY, Kim JA, Malhotra A, Sze G, Rosen MS, Kimberly WT, Sheth KN. Portable, bedside, low-field magnetic resonance imaging for evaluation of intracerebral hemorrhage. Nat Commun. 2021 Aug 25;12(1):5119. doi: 10.1038/s41467-021-25441-6.
[10] Chandarana H, Bagga B, Huang C, Dane B, Petrocelli R, Bruno M, Keerthivasan M, Grodzki D, Block KT, Stoffel D, Sodickson DK. Diagnostic abdominal MR imaging on a prototype low-field 0.55 T scanner operating at two different gradient strengths. Abdom Radiol (NY). 2021 Aug 20. doi: 10.1007/s00261-021-03234-1. Epub ahead of print. PMID: 34415411.
Figures
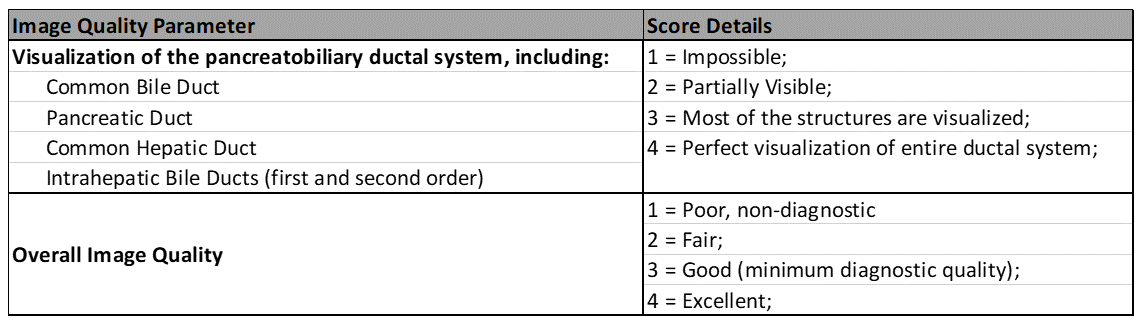
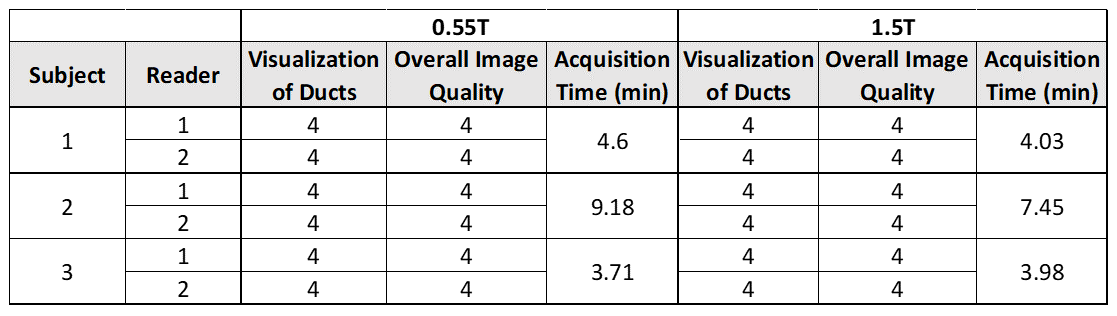
Figure 2: Image quality ratings from two independent readers and acquisition times for MRCP images acquired at 0.55T and 1.5T.
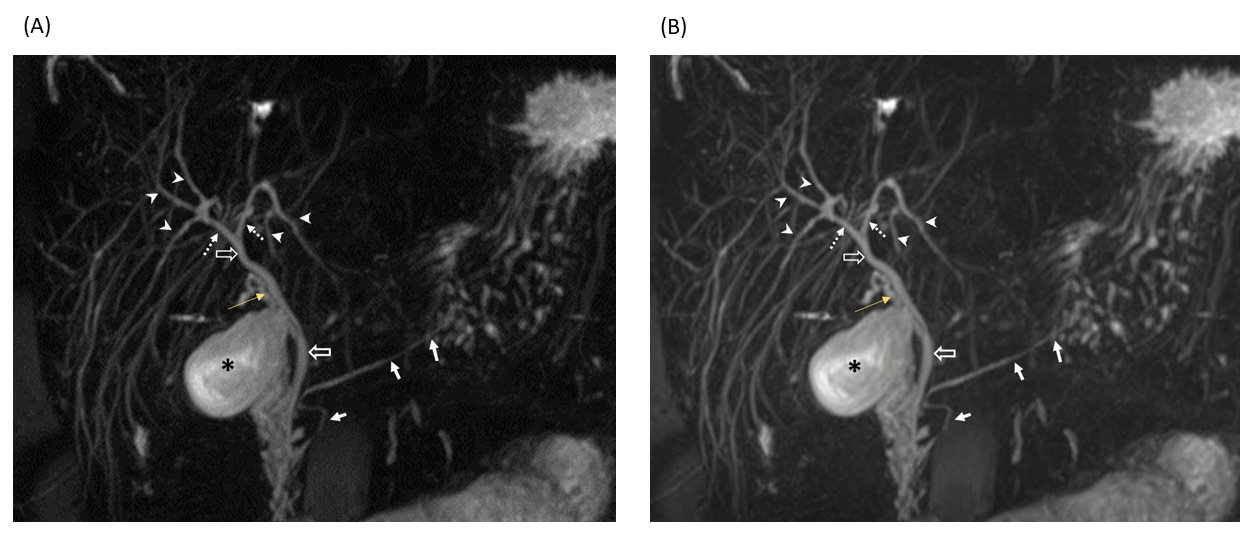
Figure 3: MRCP maximum intensity projection images showing the normal biliary tree and pancreatic duct in an example subject at (A) 0.55T and (B) 1.5T. Peripheral intrahepatic biliary radicals (IHBRs) (arrowheads), central IHBRs (dotted arrows) common hepatic and common bile ducts (block arrows), cystic duct (yellow arrow), gall bladder (asterisk) and pancreatic duct (arrows) are marked and clearly visible at both field strengths.