3372
Estimation of Lung Parenchyma Transverse Relaxation Rates at 0.55 Tesla
Bochao Li1, Nam Gyun Lee1, and Krishna Shrinivas Nayak1,2
1Department of Biomedical Engineering, University of Southern California, Los Angeles, CA, United States, 2Ming Hsieh Department of Electrical and Computer Engineering, University of Southern California, Los Angeles, CA, United States
1Department of Biomedical Engineering, University of Southern California, Los Angeles, CA, United States, 2Ming Hsieh Department of Electrical and Computer Engineering, University of Southern California, Los Angeles, CA, United States
Synopsis
Lung MRI with excellent image quality has been demonstrated at 0.55T, largely due to reduced susceptibility effects. Here, we present joint estimation of lung parenchyma transverse relaxation rates $$$R_{2}$$$, $$$R_{2}^{\prime}$$$, and off-resonance $$$\Delta f$$$. A custom echo-shifted turbo spin echo (TSE) pulse sequence with ECG triggering and breath hold was performed in 4 healthy volunteers, resulting in the mean $$$R_{2}$$$ of 23.4s-1, $$$R_{2}^{\prime}$$$ of 53.9s-1, and $$$\Delta f$$$ of 45.7Hz. This work demonstrates the feasibility of echo-shifted TSE for the estimation of three parameters of interest in lung MRI, and confirms prior measurements made with separate pulse sequences.
Introduction
High-performance 0.55T MRI provides the opportunity to evaluate lung anatomy and function with excellent image quality, largely due to reduced magnetic susceptibility1,2, longer T2 and T2*3. The longer T2* opens up exciting new opportunities including long-readout (5-10msec) stack-of-spiral imaging4,5. However, only a limited number of studies3 has explored lung parameter mapping at low field and information about lung MR parameters can potentially provide guidance for advancing and optimizing the pulse sequence design. $$$R_{2}$$$ is typically estimated from spin-echo pulse sequences or T2-prepared bSSFP pulse sequences while $$$R_{2}^{\ast}$$$ is typically estimated from multi-echo gradient-echo pulse sequences6,7. Due to the intrinsic difference between pulse sequences8,9 and different acquisition parameters in separate $$$R_{2}$$$ and $$$R_{2}^{\ast}$$$ mapping, various contributions can lead to bias in the $$$R_{2}^{\prime}$$$ estimate which is more informative in some applications10,11.At low field, the application of turbo spin echo (TSE) has provided excellent imaging quality and diagnostic value12. In this work, we utilize one pulse sequence, a custom echo-shifted TSE, to jointly estimate off-resonance $$$\Delta f$$$, $$$R_{2}$$$, and $$$R_{2}^{\prime}$$$, which are transverse relaxation rate due to thermodynamics (irreversible) and field inhomogeneity (reversible)13.
METHODS
Data acquisition: Experiments were performed using a whole body 0.55T system (prototype MAGNETOM Aera, Siemens Healthineers, Erlangen, Germany) equipped with high-performance shielded gradients (45 mT/m amplitude, 200 T/m/s slew rate). A custom ECG triggered, echo-shifted TSE pulse sequence was performed on 4 healthy volunteers (2M/2F, Age 24-28). Imaging parameters: spin-echo times (tSE): 26, 39, and 52 ms; echo shift times (tshift): -1.7, -1, 0, 1, and 1.4 ms for tSE = 26 ms and 39 ms; echo spacing = 13 ms; FOV = 360 x 270 mm2; matrix size = 128 x 96; slice thickness = 6 mm; bandwidth = 260 Hz/pixel; echo train length = 15; ECG trigger delay = 550 ms for imaging at diastole. Each breath hold was about 7 to 8 seconds depending on the heartrate. Total scan time was about 5 minutes per subject. Figure 1 shows the pulse sequence diagram animated to include tshift = -1.7, -1, 0, 1 and 1.4 ms.Joint estimation of $$$R_{2}$$$, $$$R_{2}^{\prime}$$$, $$$\Delta f$$$ : A 2D Gaussian filter (σ = 0.7 pixel size = 1.33 mm, kernel size = 5) was applied on complex-valued images for smoothing before parameter estimation. Spatial registration was not applied. We used a three-parameter complex signal model based on 180° spin echoes for $$$R_{2}$$$ and $$$R_{2}^{\prime}$$$ estimation. Two equations describing the signal evolution for rephasing ($$$t_{shift }\leq0$$$) and dephasing ($$$t_{shift }\geq0$$$) portions of spin echoes were used to jointly estimate $$$R_{2}$$$, $$$R_{2}^{\prime}$$$, and $$$\Delta f$$$ :
\begin{array}{} \mathrm{S}\left(\vec{r}, t_{shift}\right)=\mathrm{S}_{0} e^{-R_{2}(\vec{r})\left(t_{SE}+t_{shift}\right)+R_{2}^{\prime}(\vec{r}) t_{shift}} e^{-j 2 \pi \Delta f(\vec{r}) t_{shift }}&{for\ t_{shift} \leq0} \\ {\mathrm{~S}\left(\vec{r},t_{shift}\right)=\mathrm{S}_{0} e^{-R_{2}(\vec{r})\left(t_{SE}+t_{shift}\right)-R_{2}^{\prime}(\vec{r}) t_{shift}} e^{-j 2 \pi \Delta f(\vec{r}) t_{shift}}} &{for\ t_{shift} \geq0}\end{array}
where $$$\mathrm{S}\left(\vec{r}, t_{shift}\right) \in \mathbb{C}$$$ denotes a complex-valued signal at $$$\vec{r}$$$ position acquired at tshift, $$$S_{0} \in \mathbb{C}$$$ is complex-valued spin magnetization, and $$$R_{2} \in \mathbb{R}$$$ and $$$R_{2}^{\prime} \in \mathbb{R}$$$ are real-valued transverse relaxation rates and is static off-resonance. Three spin-echoes and four echo shift times were used. Parameter estimation was performed using a nonlinear least square approach with non-negative real constraints on $$$R_{2}$$$ and $$$R_{2}^{\prime}$$$, and real constraint on $$$\Delta f$$$ .
RESULTS
Table 1 summarizes the results from four healthy volunteers. The estimated R2 of lung parenchyma was approximately 23.4 s-1 ($$$T_{2}$$$ = 42.7 ms) and was slightly lower than that reported at 1.5T12. The estimated $$$R_{2}^{\prime}$$$ of lung parenchyma was approximately 53.9 s-1 ($$$T_{2}^{\prime}$$$= 18.6 ms) and the resulting estimated $$$R_{2}^{\ast}$$$ was approximately 77.6 Hz ($$$T_{2}^{\ast}$$$ =12.9ms), which is 10 times lower than that reported at 1.5T3,14.Figures 3 and 4 show $$$R_{2}$$$, $$$R_{2}^{\prime}$$$ and $$$\Delta f$$$ maps and histograms from four volunteers. The off resonance of lung parenchyma ranged from 30 Hz to 80 Hz (3.41ppm) and the mean $$$\Delta f$$$ is 46.5 Hz (1.95ppm).
DISCUSSION
A previous study3 utilized two different sequences with different contrasts (T2-prepared bSSFP and multi-echo GRE) to estimate $$$R_{2}$$$ and $$$R_{2}^{\ast}$$$, which we suspected could lead to errors when estimating $$$R_{2}^{\prime}$$$. Our single-sequence approach produced comparable $$$R_{2}$$$ and $$$R_{2}^{\ast}$$$ values, dispelling this concern. The reduced $$$R_{2}$$$ and $$$R_{2}^{\ast}$$$ estimates at low field allow substantial new flexibility in pulse sequence design, including the use of long-readout spiral imaging, multi-echo imaging, and balanced steady-state free precession.This study has several limitations. First, the total readout time (i.e., 200 ms) used in this study results in nonnegligible T2 blurring, for $$$R_{2}$$$ around 23.4 s-1. T2 blurring correction can potentially improve the accuracy of quantification15,16. Second, the assumption of perfect B1+ homogeneity in the signal model may lead to bias in quantification. Advanced signal modeling along with a separate B1+ map could result in improved quantification17.
CONCLUSION
With a custom ECG-triggered echo-shifted TSE pulse sequence, simultaneous estimation of $$$R_{2}$$$, $$$R_{2}^{\prime}$$$, and $$$\Delta f$$$ was feasible at 0.55T. The mean of $$$R_{2}$$$ is ~23.4 s-1 and $$$R_{2}^{\prime}$$$ is ~53.9 s-1(18.6 ms). $$$R_{2}$$$ is slightly lower as expected, while $$$R_{2}^{\prime}$$$ and $$$R_{2}^{\ast}$$$ are significantly lower at 0.55T compared with 1.5T. Off-resonance is up to 3.41ppm which is also consistent with previous results at 1.5T18. The quantitative parameters found in this work could benefit sequence design for lung MRI at low field.Acknowledgements
We acknowledge grant support from the National Science Foundation (#1828736) and research support from Siemens Healthineers.References
1. Bhattacharya I, Ramasawmy R, Javed A, et al. Oxygen-enhanced functional lung imaging using a contemporary 0.55 T MRI system. NMR Biomed. 2021;34(8):1-10. doi:10.1002/nbm.45622. Campbell-Washburn AE, Bhattacharya I, Moss J, et al. T2-Weighted Lung Parenchymal Imaging Using a High-Performance Low Field MRI System. 2020:A3250-A3250. doi:10.1164/ajrccm-conference.2020.201.1_meetingabstracts.a3250
3. Campbell-Washburn AE, Ramasawmy R, Restivo MC, et al. Opportunities in Interventional and Diagnostic Imaging by Using High-Performance Low-Field-Strength MRI. Radiology. 2019;293(2):384-393. doi:10.1148/radiol.2019190452
4. Javed A, Ramasawmy R, Moss J, et al. Optimized 3D spiral ultra-short echo time free-breathing pulmonary imaging on a high-performance low-field 0.55T scanner. Proc Intl Soc Mag Reson Med 29. 2021:0596.
5. Javed A, Ramasawmy R, Su P, Benkert T, Majeed W, Campbell-Washburn AE. Free-breathing oxygen- enhanced pulmonary imaging with self-gated stack- of-spirals ultra-short echo time sequence at 0.55T. Ismrm 2021. 2021:3238.
6. Hatabu H, Alsop DC, Listerud J, Bonnet M, Gefter WB. T2* and proton density measurement of normal human lung parenchyma using submillisecond echo time gradient echo magnetic resonance imaging. Eur J Radiol. 1999;29(3):245-252. doi:10.1016/S0720-048X(98)00169-7
7. Pracht ED, Arnold JFT, Wang T, Jakob PM. Oxygen-enhanced proton imaging of the human lung using T2*. Magn Reson Med. 2005;53(5):1193-1196. doi:10.1002/mrm.20448
8. Chavhan GB, Babyn PS, Jankharia BG, Cheng HLM, Shroff MM. Steady-state MR imaging sequences: Physics, classification, and clinical applications. Radiographics. 2008;28(4):1147-1160. doi:10.1148/rg.284075031
9. Kacere RD, Pereyra M, Nemeth MA, Muthupillai R, Flamm SD. Quantitative assessment of left ventricular function: Steady-state free precession MR imaging with or without sensitivity encoding. Radiology. 2005;235(3):1031-1035. doi:10.1148/radiol.2353030995
10. Wood JC, Enriquez C, Ghugre N, et al. MRI R2 and R2* mapping accurately estimates hepatic iron concentration in transfusion-dependent thalassemia and sickle cell disease patients. Blood. 2005;106(4):1460-1465. doi:10.1182/blood-2004-10-3982
11. Siemonsen S, Fitting T, Thomalla G, et al. T2′ imaging predicts infarct growth beyond the acute diffusion-weighted imaging lesion in acute stroke. Radiology. 2008;248(3):979-986. doi:10.1148/radiol.2483071602
12. Bhattacharya I, Ramasawmy R, Javed A, et al. Assessment of Lung Structure and Regional Function Using 0.55 T MRI in Patients With Lymphangioleiomyomatosis. Invest Radiol. 2021;Publish Ah(00):1-9. doi:10.1097/rli.0000000000000832
13. Ma J, Wehrli FW. Irreversible Contribution to the Transverse-Relaxation Rate. Integr Vlsi J. 1996;69:61-69.
14. Wild JM, Marshall H, Bock M, et al. MRI of the lung (1/3): Methods. Insights Imaging. 2012;3(4):345-353. doi:10.1007/s13244-012-0176-x
15. Zhou X, Liang Z ‐P, Cofer GP, Beaulieu CF, Suddarth SA, Johnson GA. Reduction of ringing and blurring artifacts in fast spin‐echo imaging. J Magn Reson Imaging. 1993;3(5):803-807. doi:10.1002/jmri.1880030518
16. Tamir JI, Uecker M, Chen W, et al. T2 shuffling: Sharp, multicontrast, volumetric fast spin-echo imaging. Magn Reson Med. 2017;77(1):180-195. doi:10.1002/mrm.26102
17. Chhetri G, McPhee KC, Wilman AH. Bloch modelling enables robust T2 mapping using retrospective proton density and T2-weighted images from different vendors and sites. Neuroimage. 2021;237(May):118116. doi:10.1016/j.neuroimage.2021.118116
18. Bergin CJ, Glover GH, Pauly JM. Lung parenchyma: Magnetic susceptibility in MR imaging. Radiology. 1991;180(3):845-848. doi:10.1148/radiology.180.3.1871305
Figures
Figure 1: Pulse sequence diagram of echo-shifted TSE (animated
GIF).
The blue shaded bars indicate the refocusing RF pulses. The red shaded bars
represent the readouts at different echo shift times: tshift of -1.7
-1, 0, 1 and 1.4 ms are shown. The choice of tshift is
limited by the deadtime between two refocusing RF pulses. In addition, overlapping
between ADC and phase encoding and rewinder gradients must be avoided. SS:
Slice selective; PE: Phase encoding; RO: Readout.
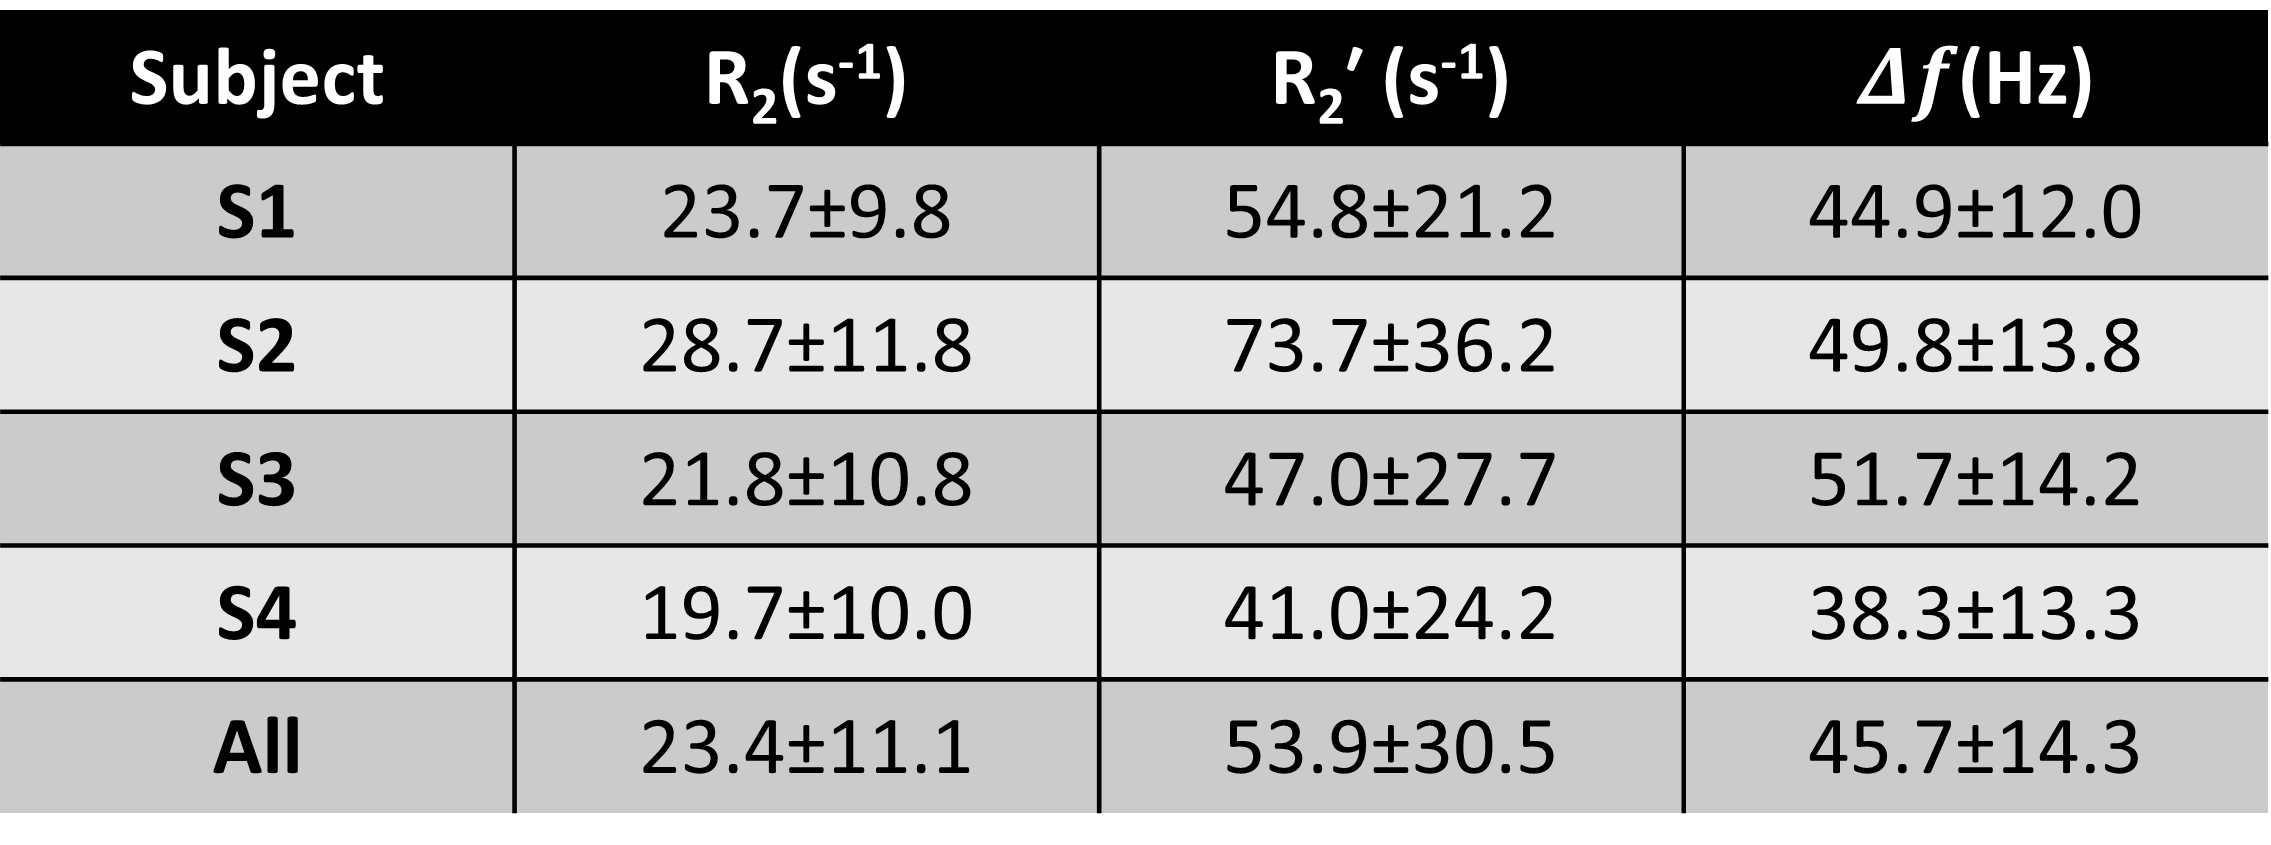
Table 1: Estimated $$$R_{2}$$$, $$$R_{2}^{\prime}$$$, and $$$\Delta f$$$ from four healthy volunteers.
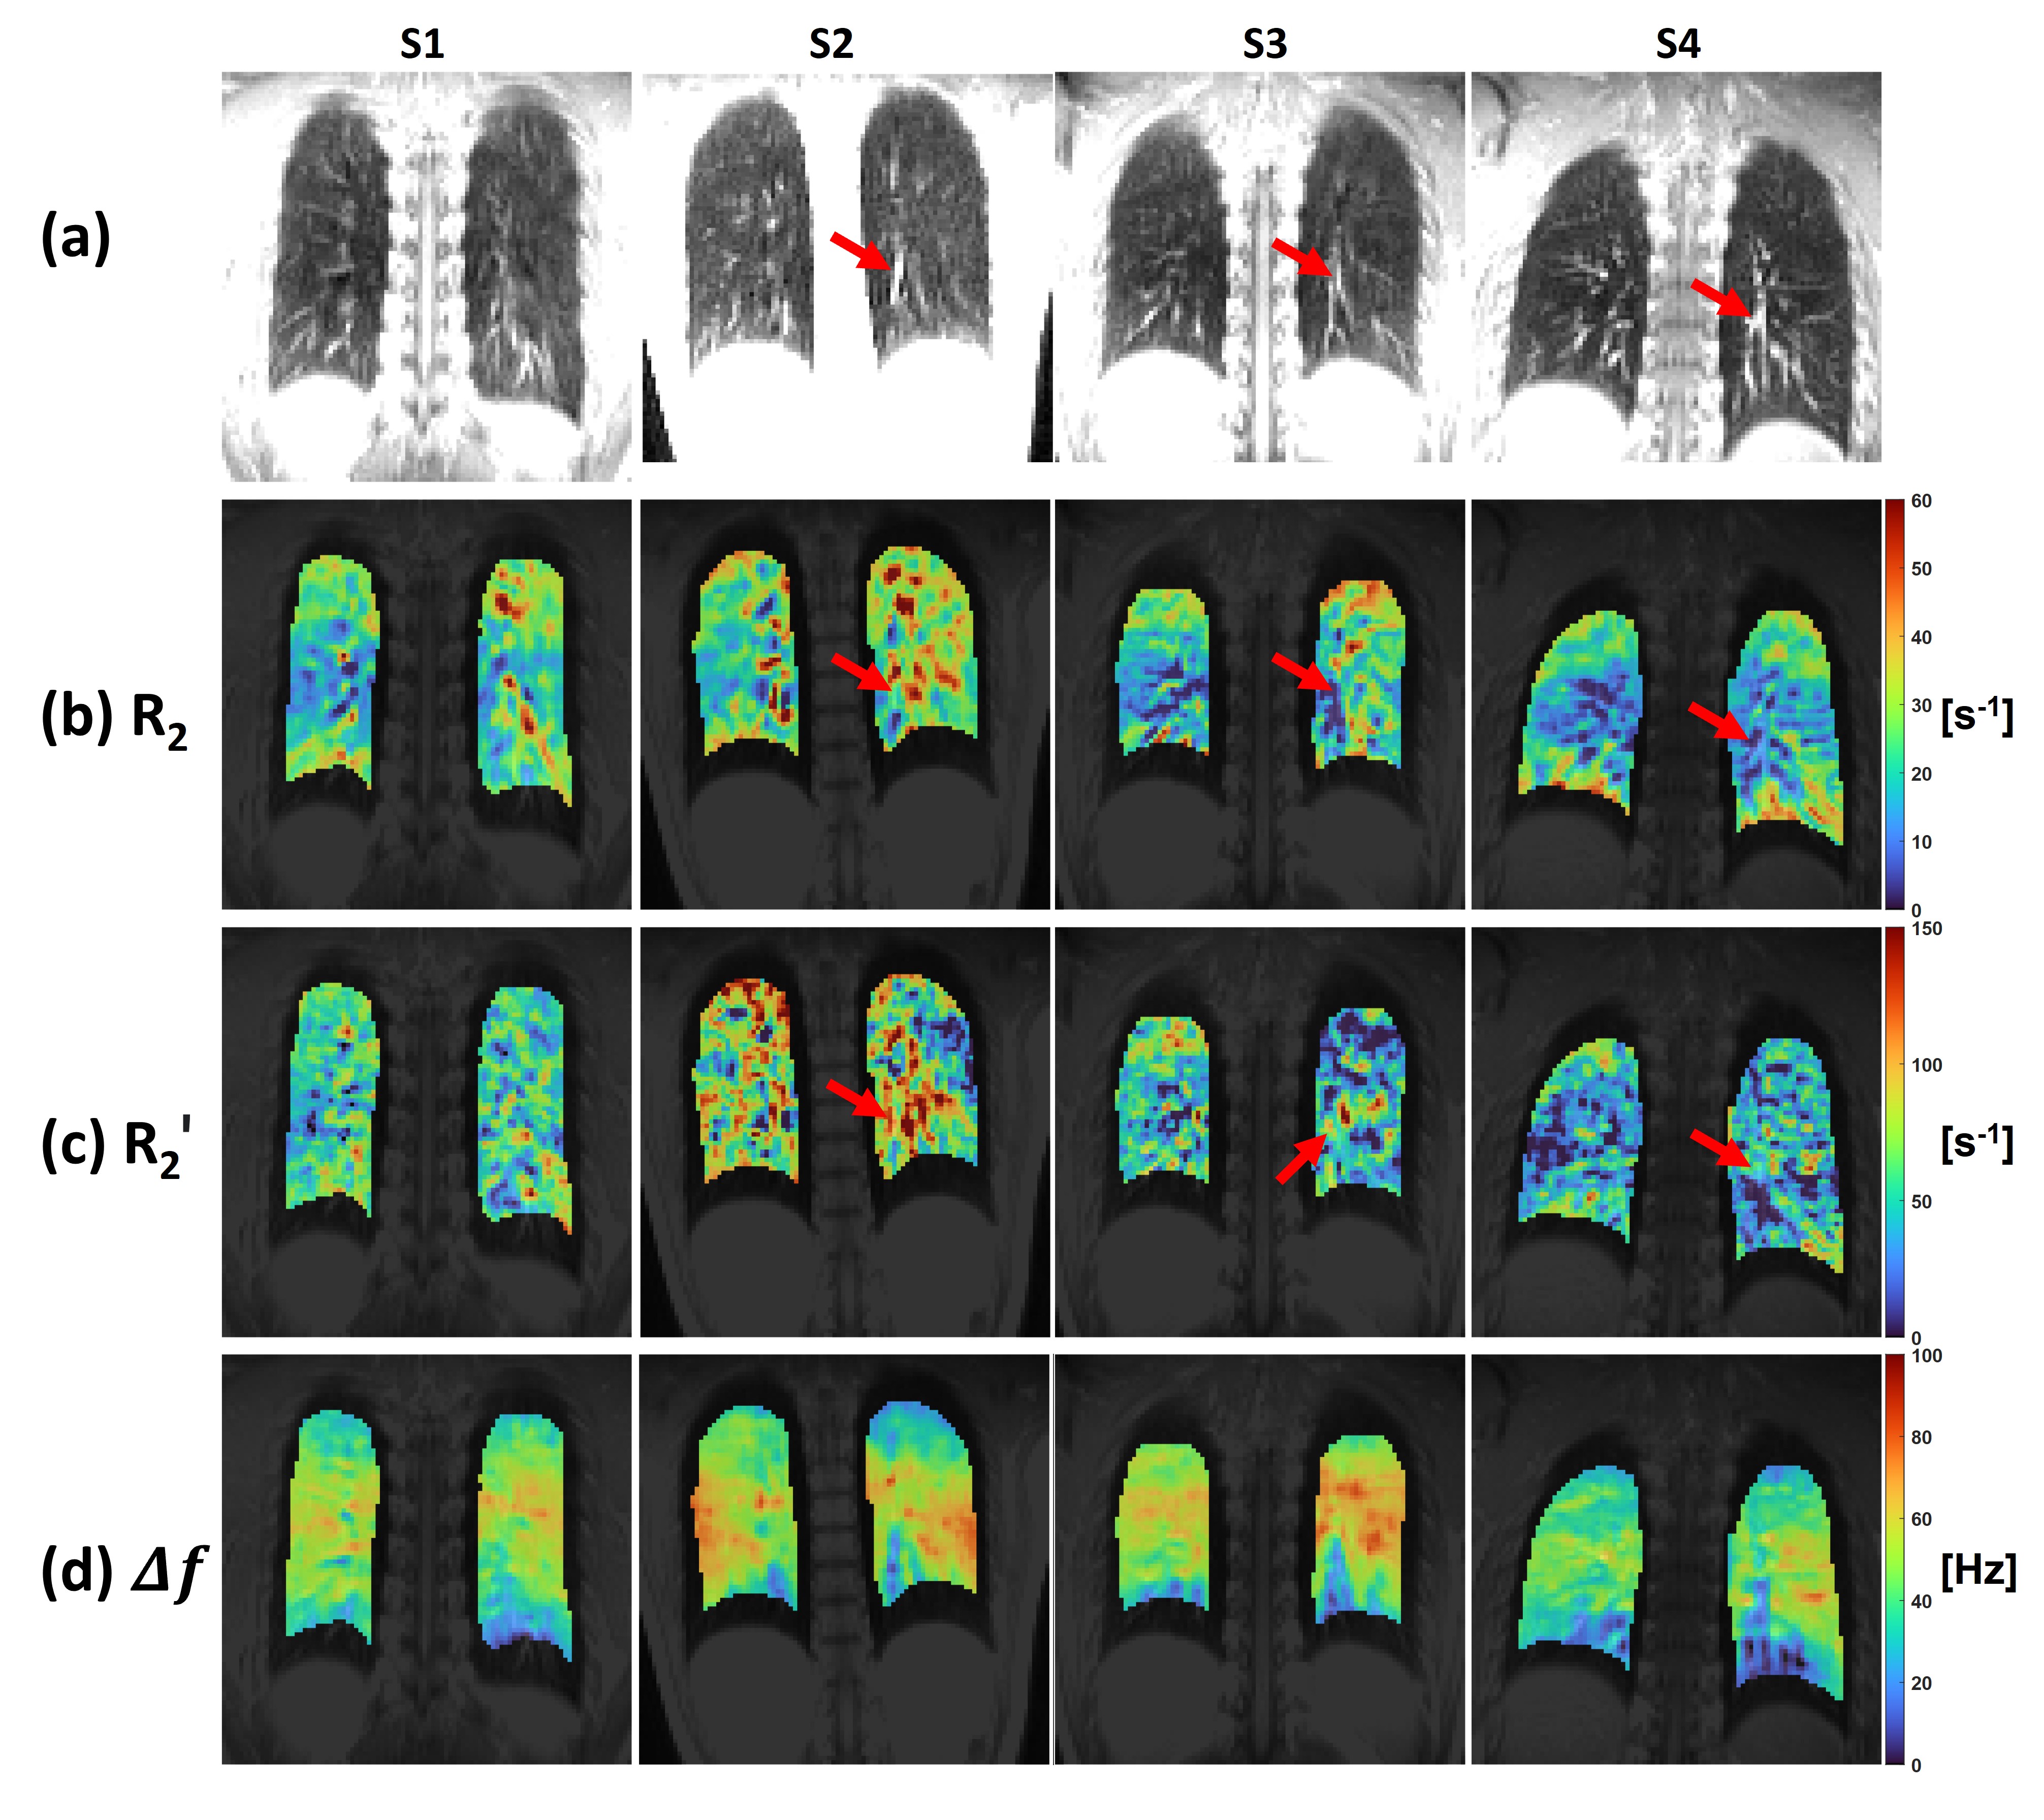
Figure 3: Representative (a) echo-shifted anatomical image,
(b) $$$R_{2}$$$, (c) $$$R_{2}^{\prime}$$$ and (d) $$$\Delta f$$$ maps. A conservative mask was
applied to the peripheral lung region to avoid signal contamination from surrounding
tissues. The subject variation of $$$R_{2}^{\prime}$$$ is probably attributed to the variation
in signal levels of large vessels (red arrows). Reduced $$$R_{2}$$$ and increased $$$R_{2}^{\prime}$$$ are observed in regions around the large vessels.
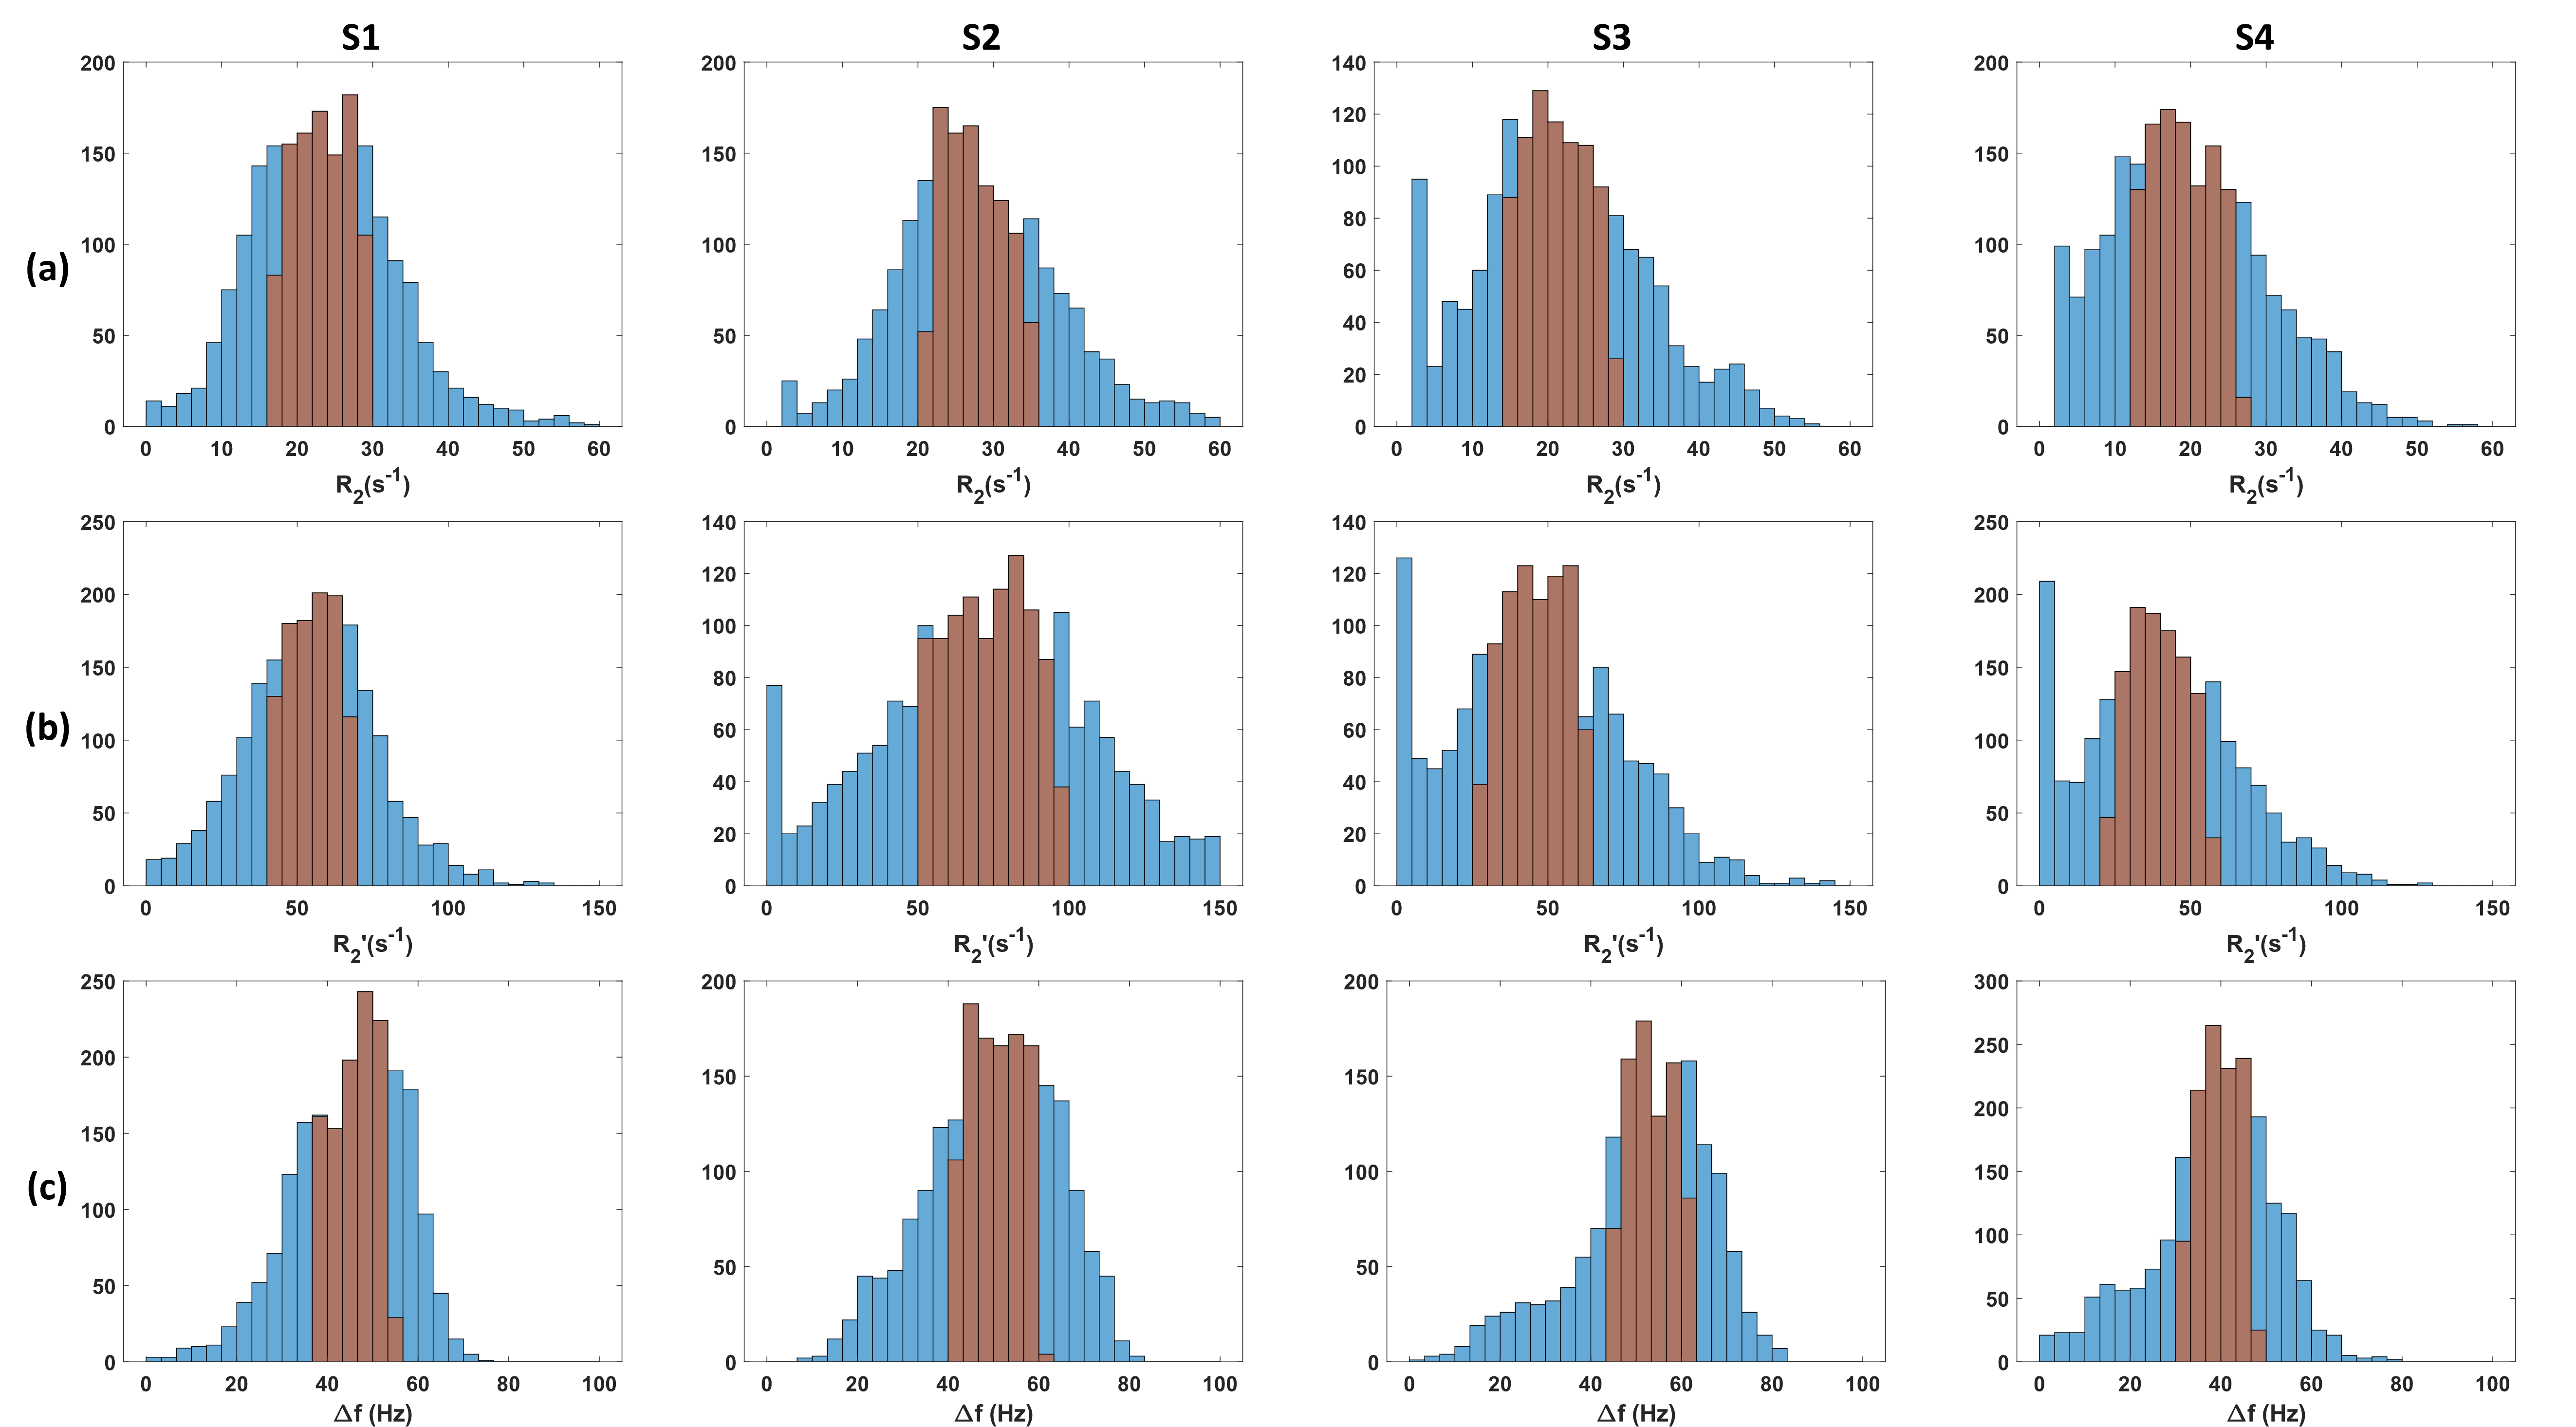
Figure 4: Histograms of (a) $$$R_{2}$$$, (b) $$$R_{2}^{\prime}$$$ and (c) $$$\Delta f$$$ estimates from four subjects. The interquartile range is highlighted in
red.
DOI: https://doi.org/10.58530/2022/3372