3368
Longitudinal assessment of nonalcoholic steatohepatitis with MRI and MRE – changes of imaging biomarkers and their relationships1Radiology, Mayo Clinic, Rochester, MN, United States, 2Gastroenterology and Hepatology, Mayo Clinic, Rochester, MN, United States, 3Biomedical Statistics and Informatics, Mayo Clinic, Rochester, MN, United States
Synopsis
We measured the longitudinal change of MRE-assessed liver stiffness (LS), loss modulus (LM) and MRI-assessed proton density fat fraction (PDFF) in a preclinical NASH model of 25 rats and 52 patients with NAFLD to assess disease severity, as well as the direction of progression/regression. Our pilot studies suggest that ΔLM and ΔPDFF are promising for monitoring treatment effects in a short-term period, while ΔLS is recommended for stratifying significant fibrosis that needs treatment in long-term follow-ups.
Introduction
Nonalcoholic steatohepatitis (NASH) is the most rapidly increasing indication for liver transplantation in western countries and therefore represents a global health issue.1 Patients with NASH are at an increased risk of developing cirrhosis and hepatocellular carcinoma. Up to 10% of patients with NASH will eventually develop cirrhosis, which is the third most common cause of death in NAFLD after cardiovascular disease and cancer.2 NASH is diagnosed when there is evidence of inflammatory activity and hepatocyte injury in a steatotic liver tissue. MRI-based proton density fat fraction (PDFF) and liver stiffness (LS) measured by magnetic resonance elastography (MRE) are two well-established quantitative imaging biomarkers for assessing hepatic steatosis and fibrosis, respectively.3 Evidence is accumulating that MRE-assessed loss modulus (LM) has potential for evaluating hepatic inflammation.4 There is a knowledge gap about the dynamic evolution of steatosis and fibrosis in the natural history of NAFLD. Therefore, the goal of this study was to measure the longitudinal change of MRE-LS and LM and MRI-PDFF biomarkers in a preclinical NASH model and patients with suspected NAFLD to explore the evolution of the longitudinal change of these biomarkers. We hypothesized that a combination of MRE-LS, LM, and MRI-PDFF may comprehensively assess disease severity, as well as the direction of progression/regression.Method
In this IACUC-approved preclinical study, 25 9-week-old male Wistar rats were studied, 20 of them were fed with 12 weeks choline-deficient high fat diet (CDHFD) to establish the NASH model, and 5 were fed normally as age-matched controls. Monthly MRI/MRE exams were performed from baseline to 12 weeks (endpoint). In the IRB-approved prospective study, we had 52 adult patients with suspected NAFLD who had baseline and one-year follow-ups of MRI/MRE examinations and paired liver biopsies within one month of imaging from 2018 to 2021. LS, LM and PDFF change per week/year were calculated for animal/human, respectively. Spearman’s correlations were used to analyze the relationship between the LM and PDFF absolute change in each group.Results
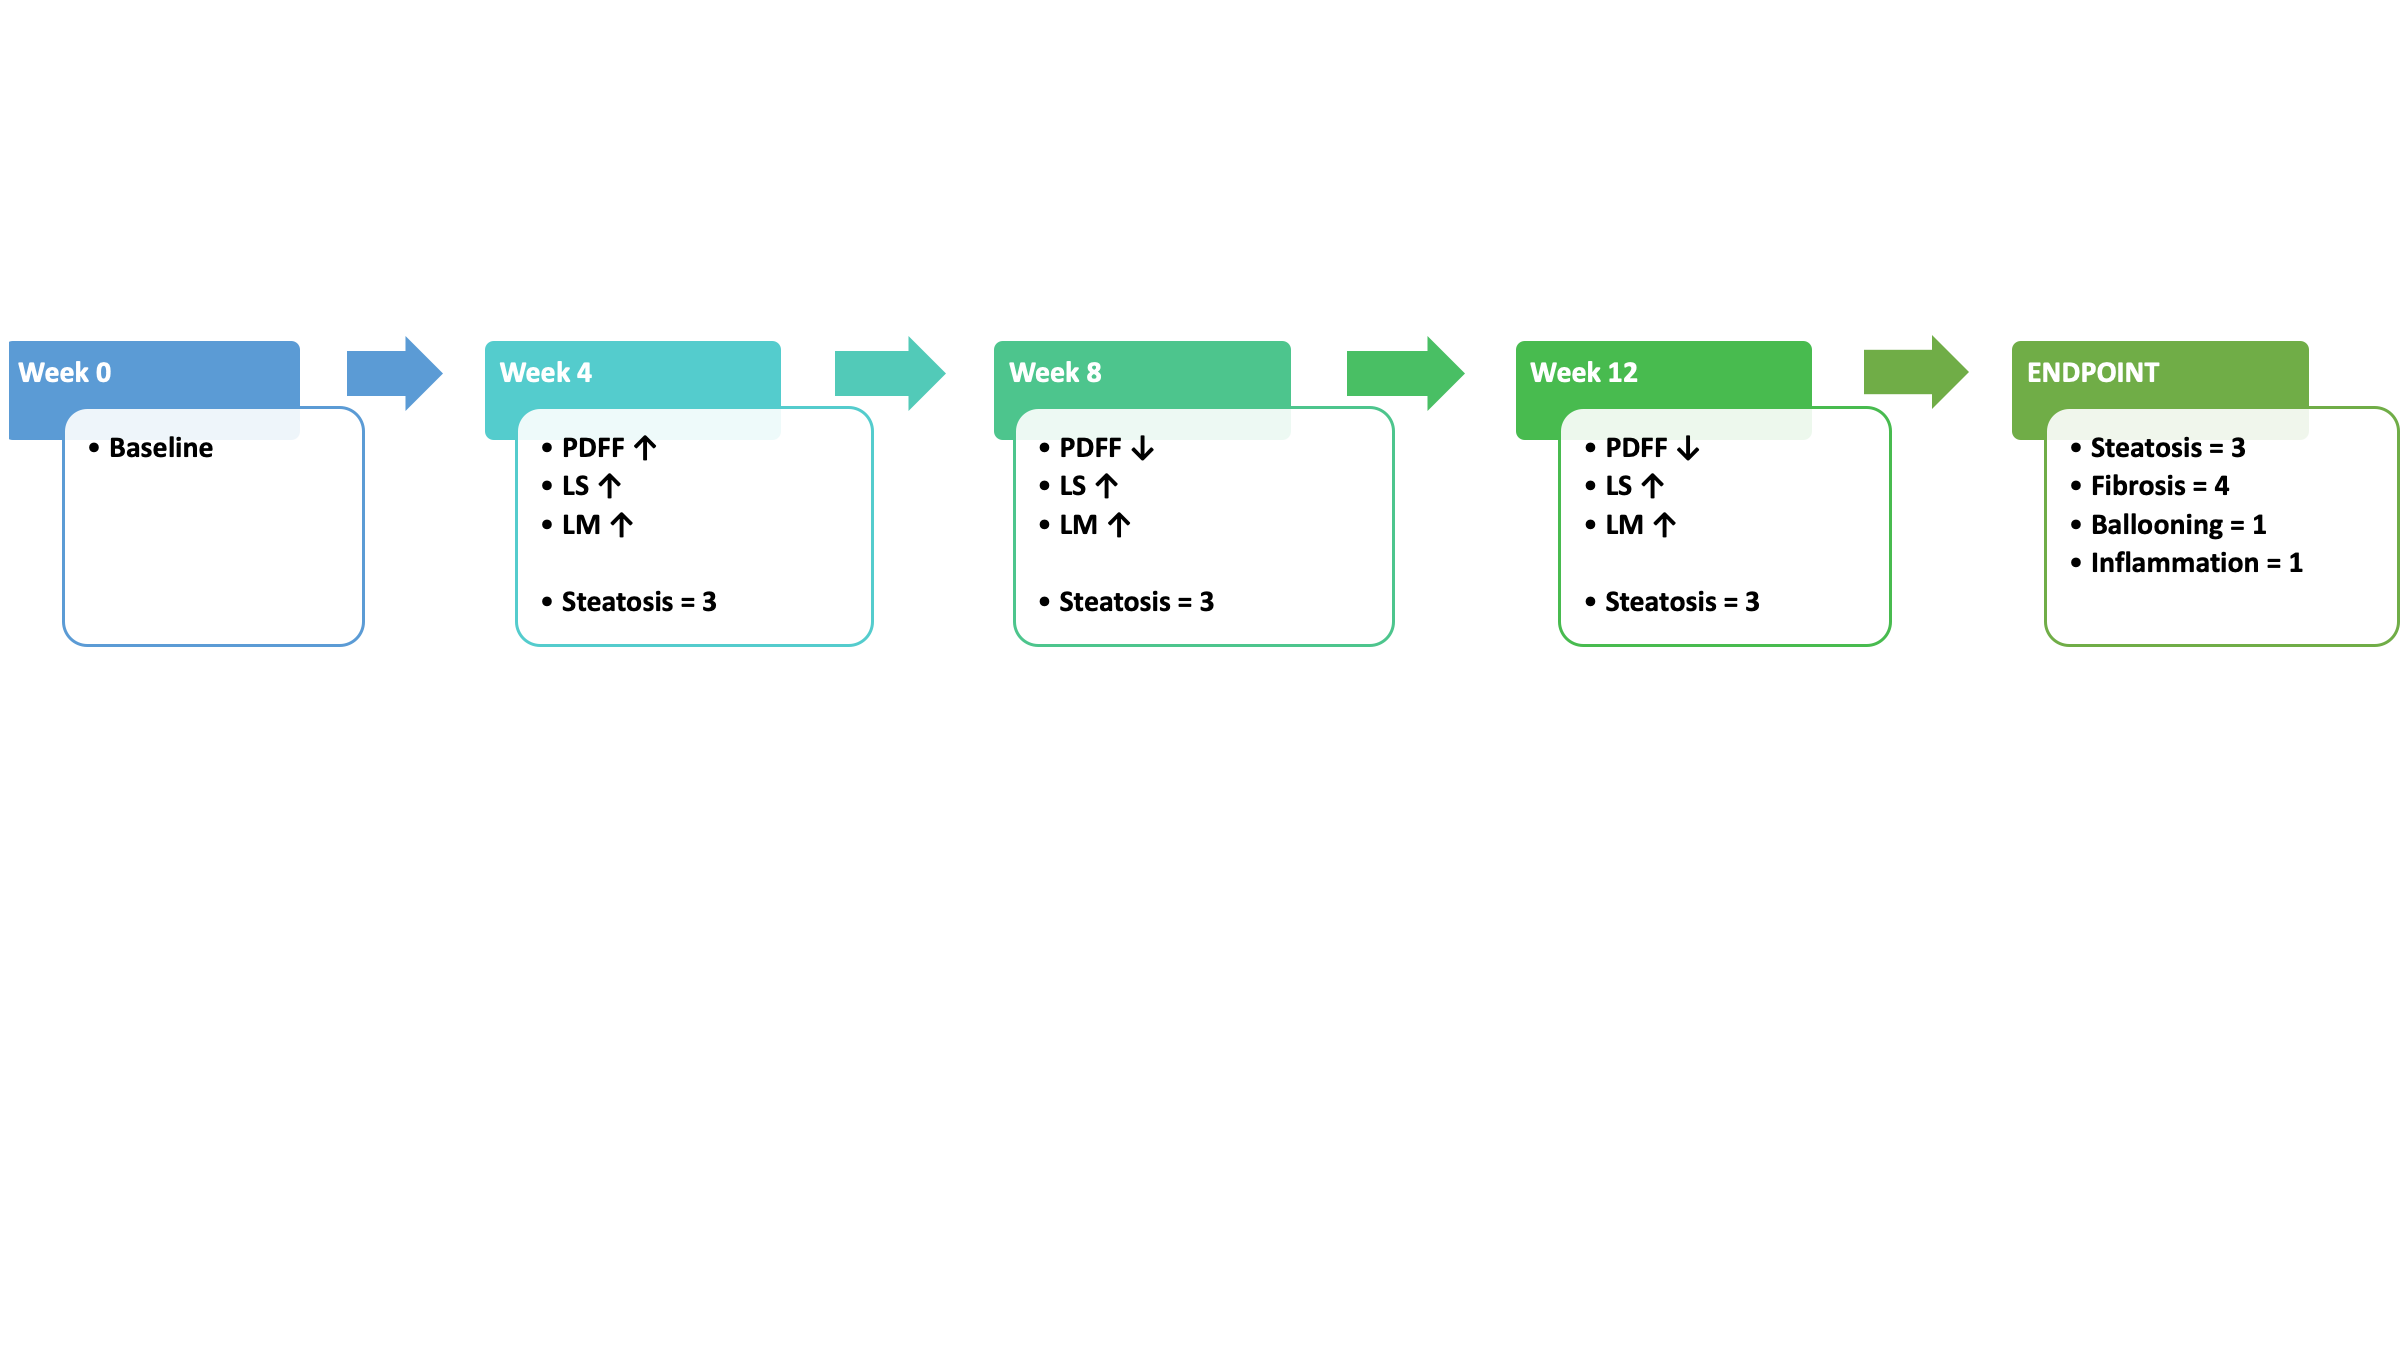
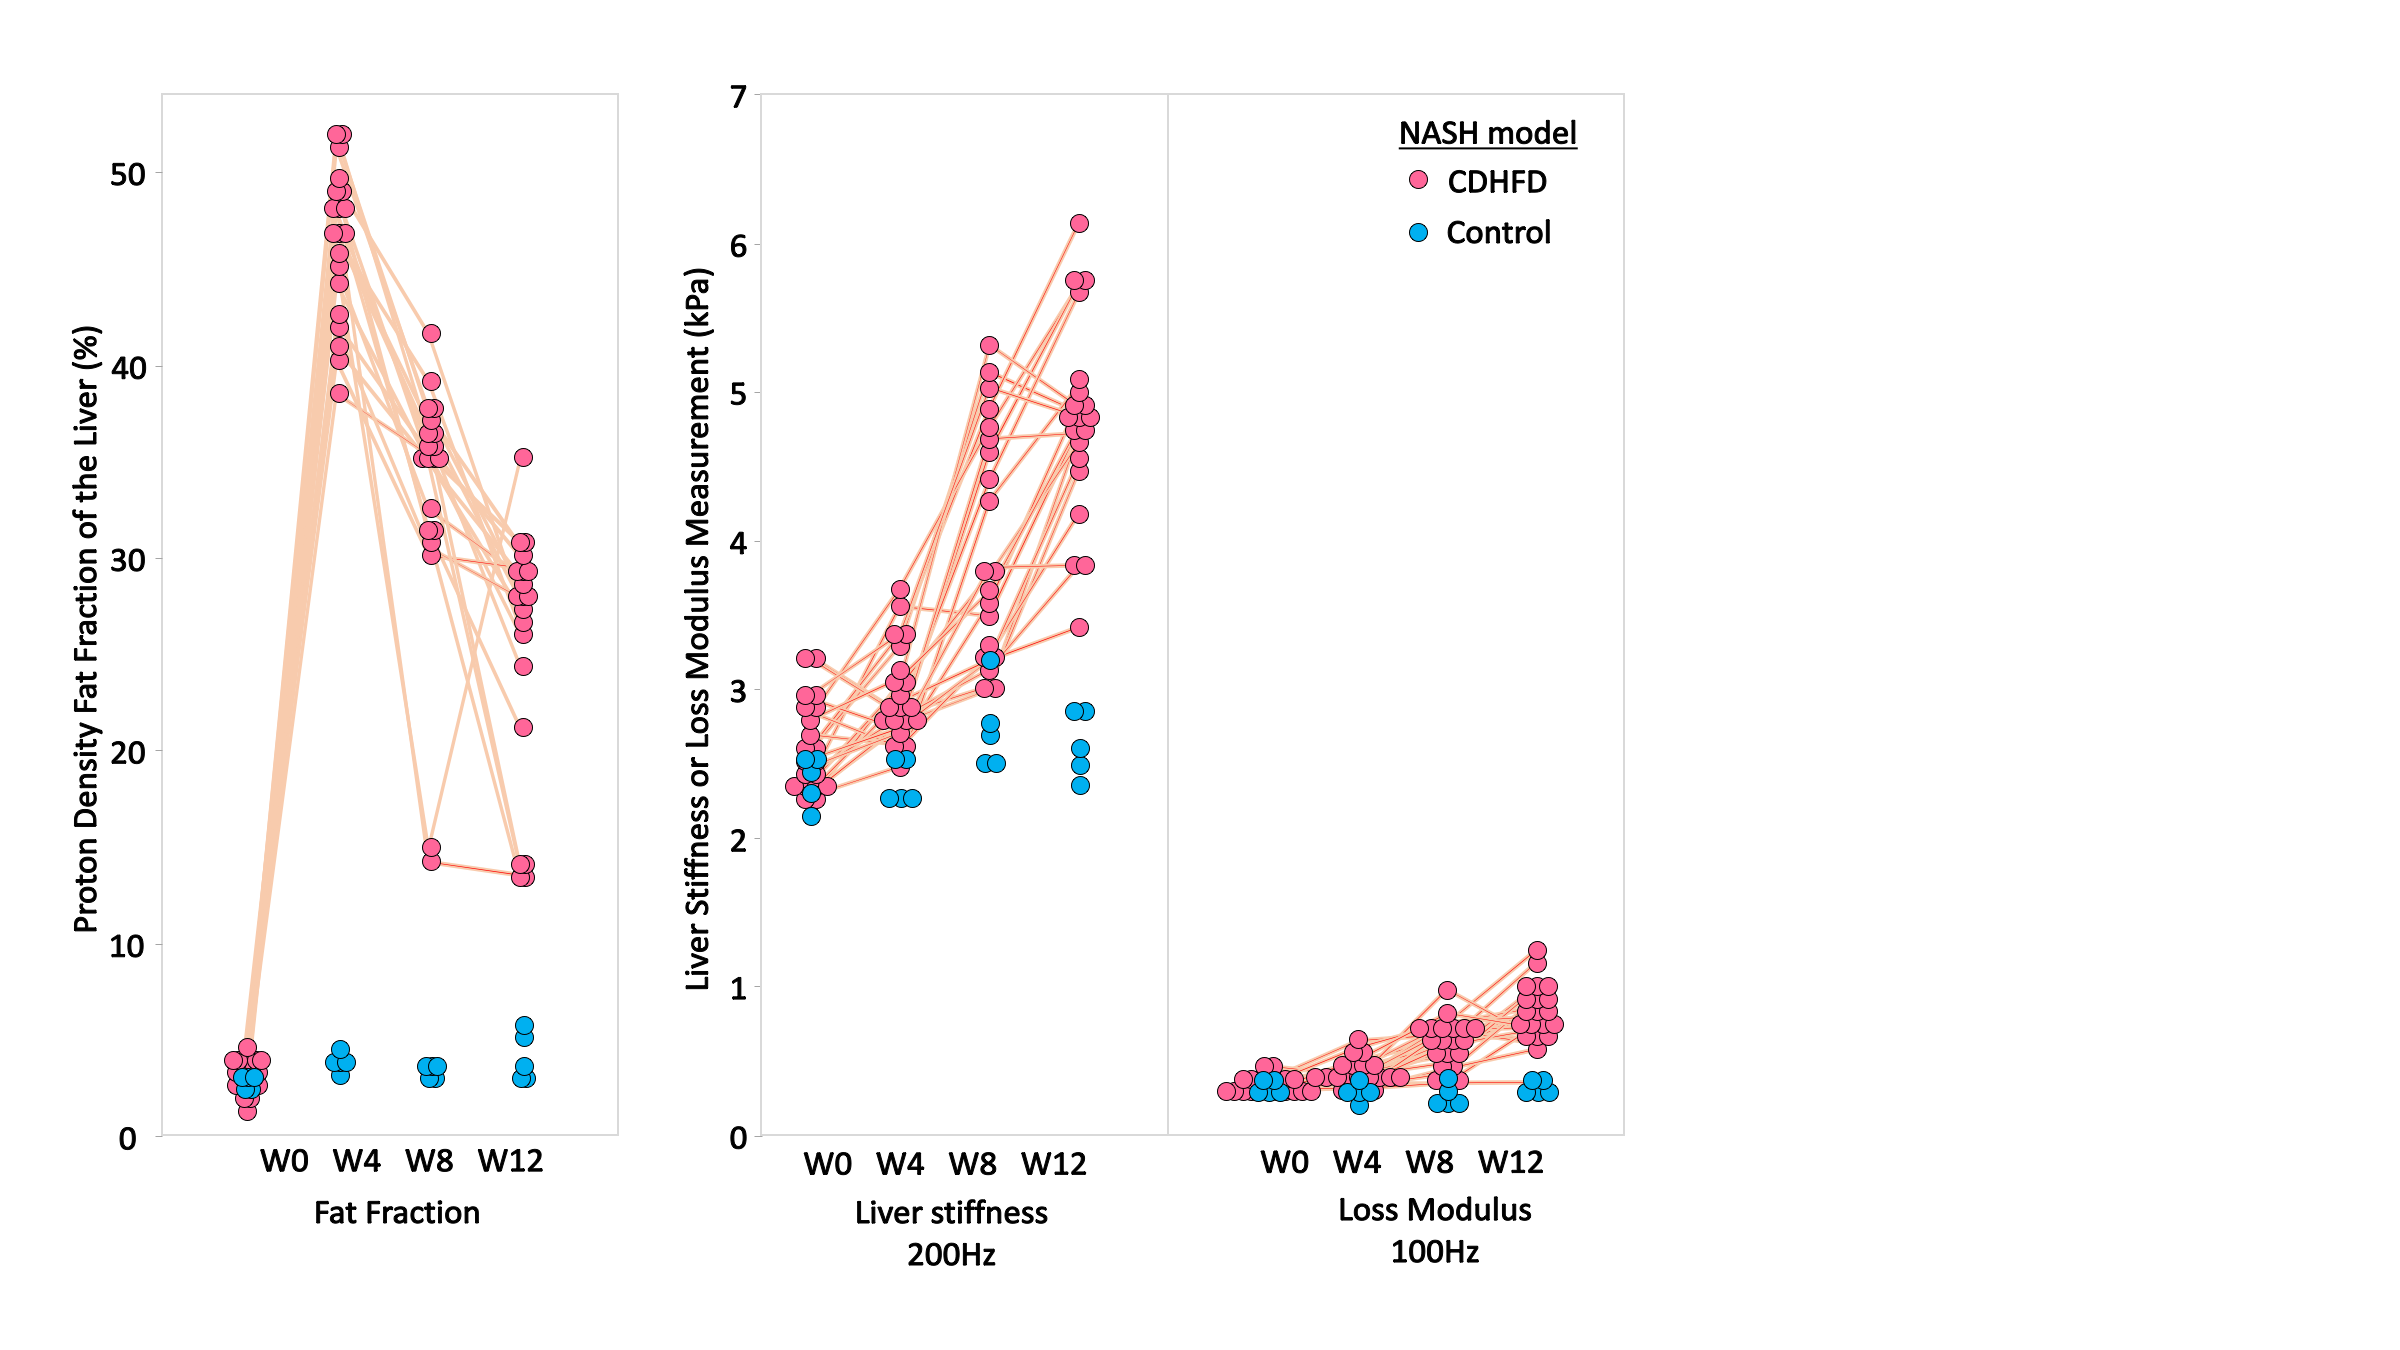
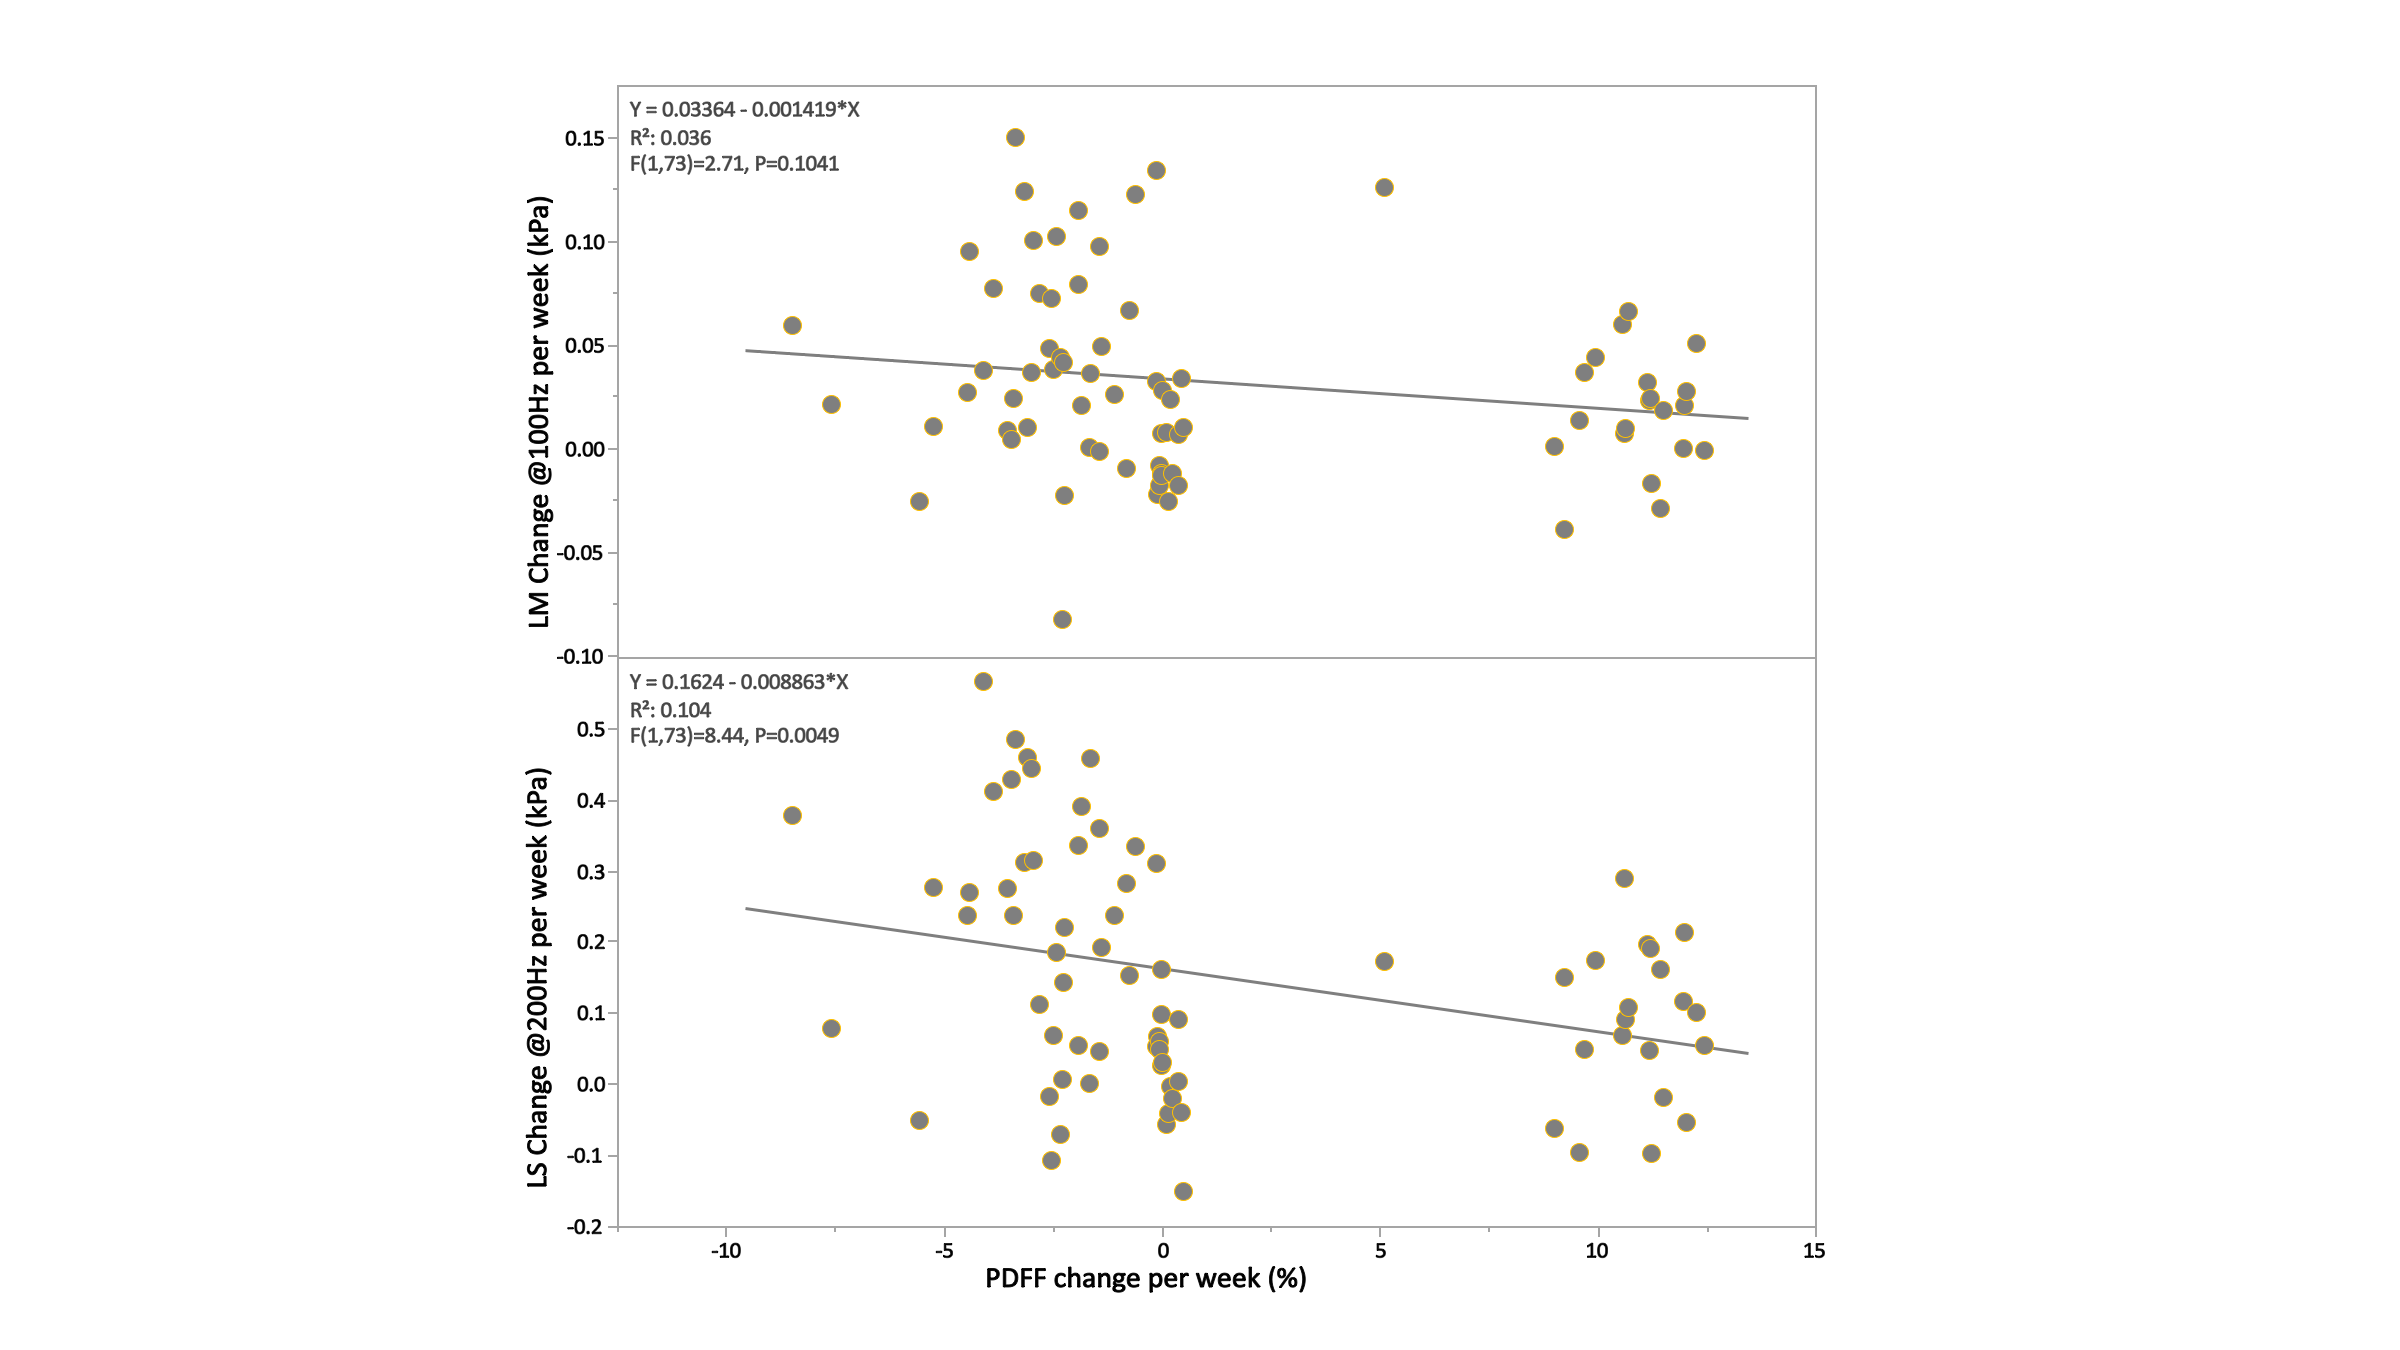
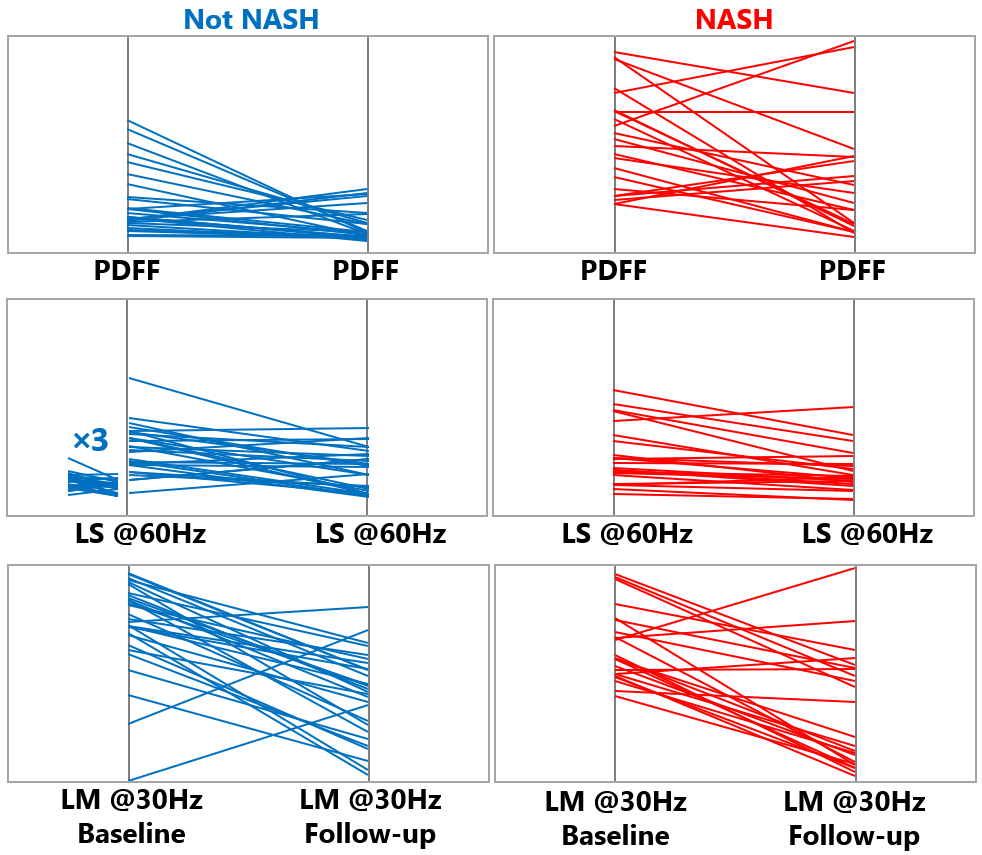
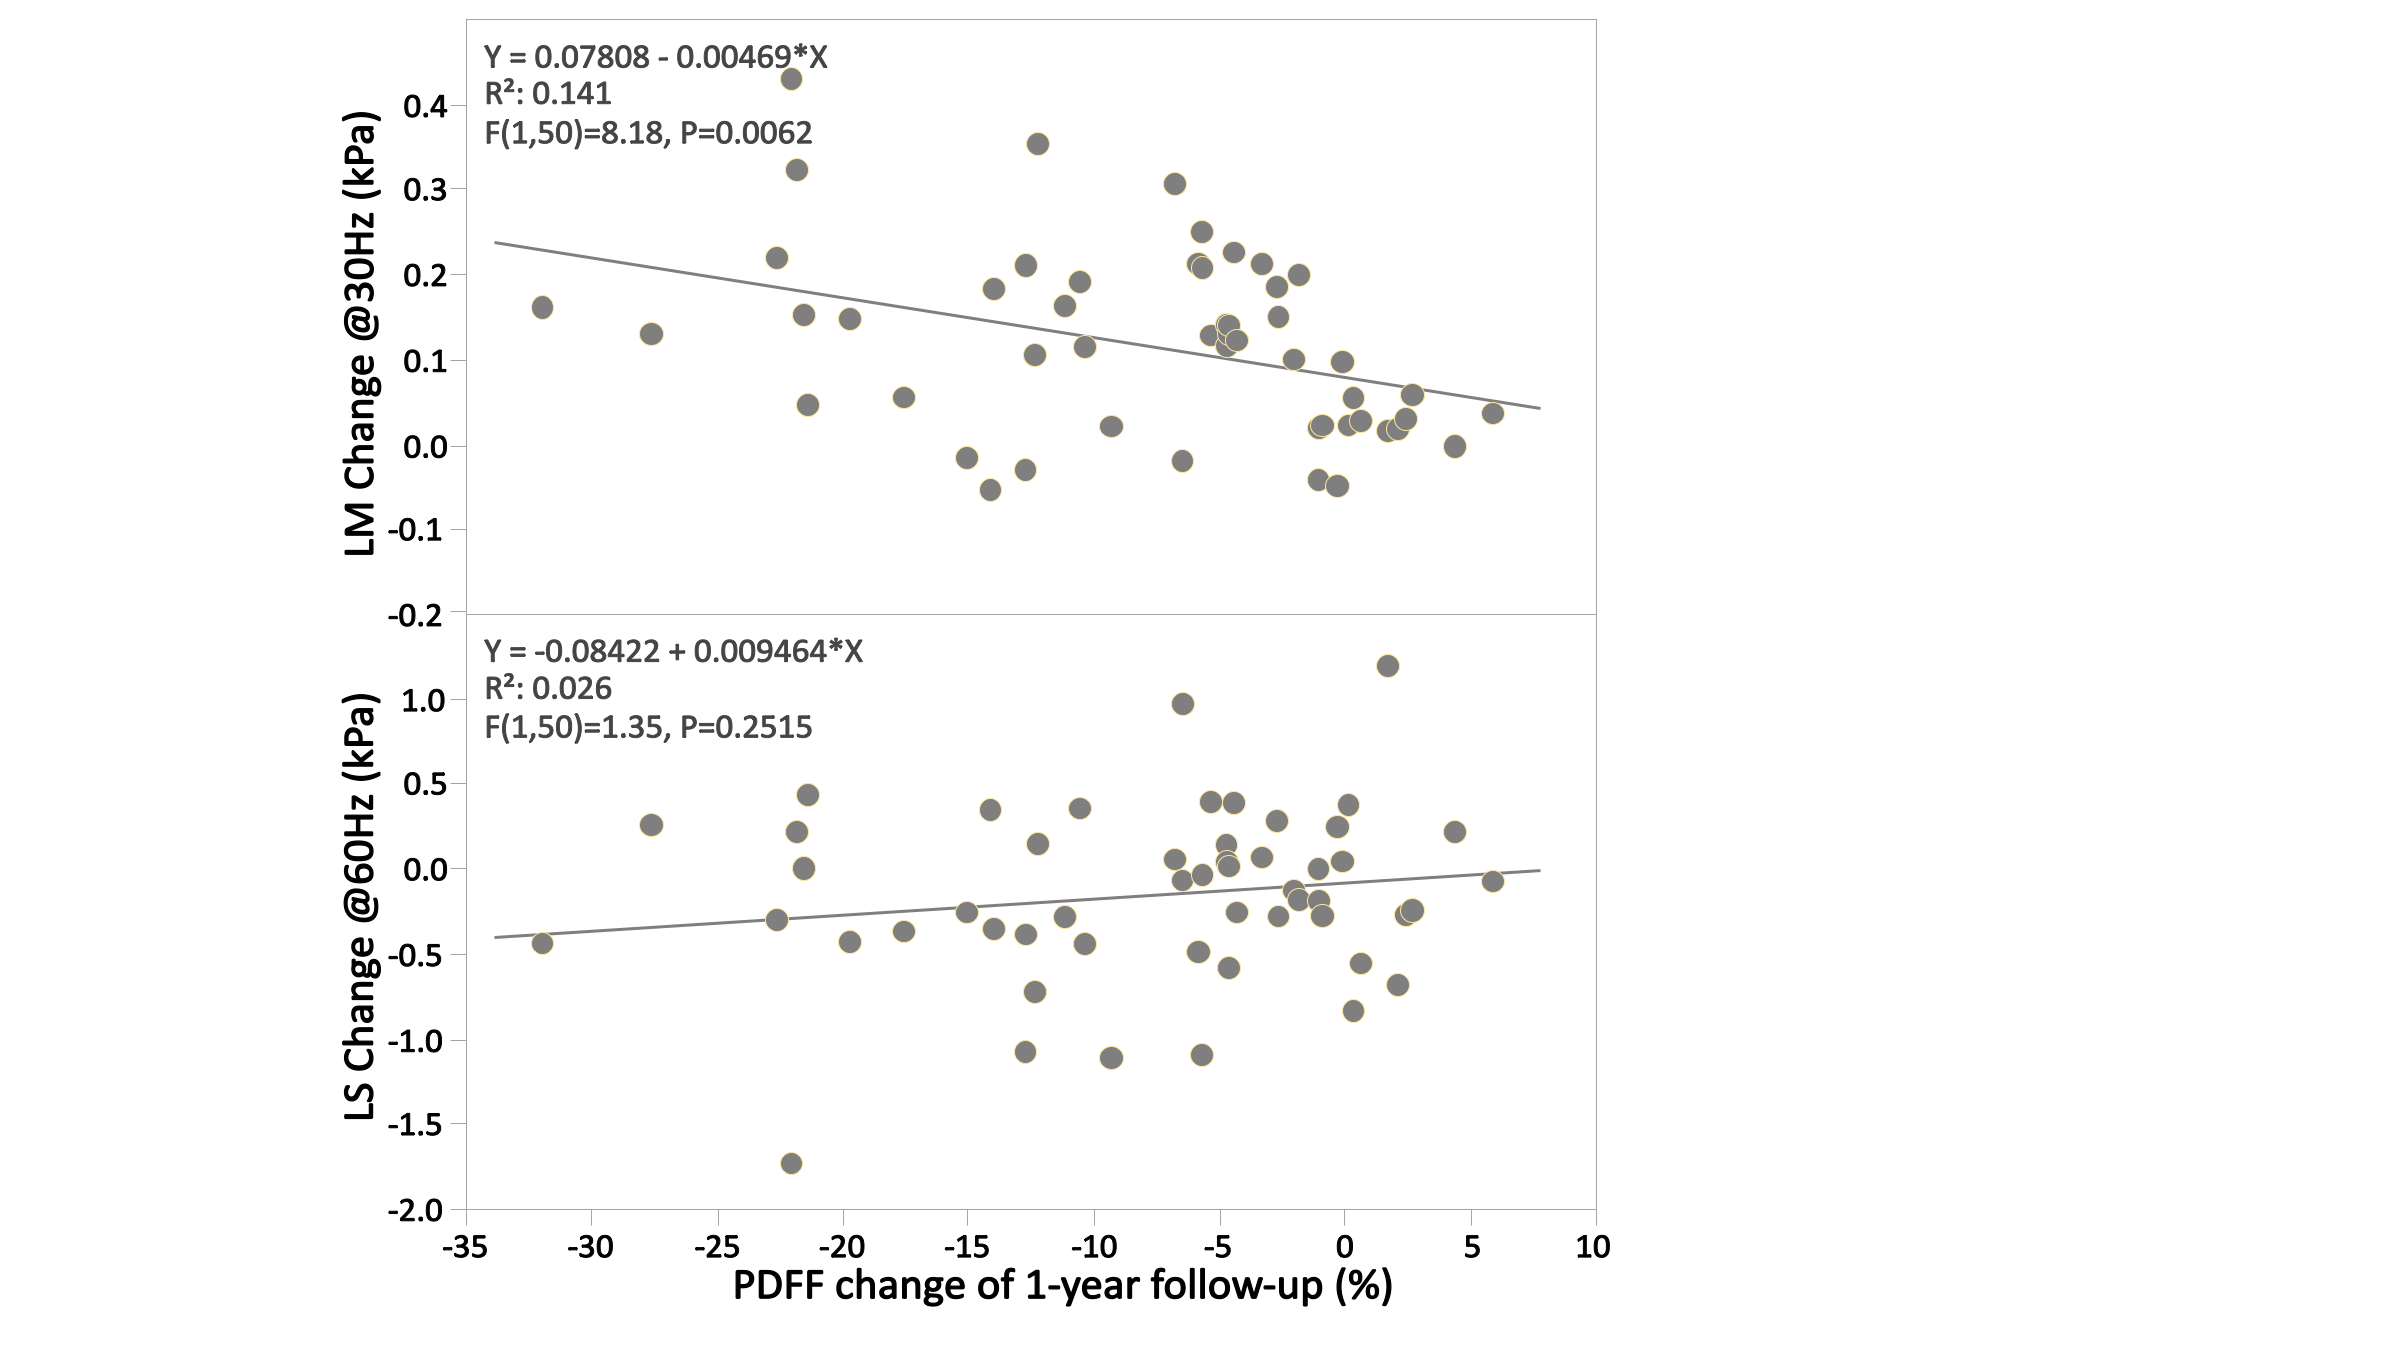
In the preclinical study, as illustrated in Figure1, all 20 rats at the endpoint reached severe steatosis (grade 3) and fibrosis (stage 4) with mild inflammation (grade 1) and ballooning (grade 1) from histologic analyses. Figure2 demonstrates longitudinal PDFF, high-frequency LS and low-frequency LM measurements for all animals. Less impressive data not shown here include low-frequency LS (longitudinal change is significant but less compared with high-frequency LS) and high-frequency LM (no significant elevation in the NASH at all). The direction of ΔPDFF did not well agree with that of ΔLS and ΔLM, indicating the specific biological relationship between PDFF, LS and LM in this rapidly developed NASH rat model with severe steatosis and fibrosis development from stage 0 to stage 4 at the endpoint. Figure3 illustrated that ΔLS was negatively correlated to ΔPDFF, while there is no correlation between ΔLM and ΔPDFF. In 52 patients, 23 of them were diagnosed with NASH at the baseline, 14 out of 23 had resolved NASH one year after successful weight-loss treatment. As shown in Figure4, both PDFF and low-frequency LM decreased significantly, while high-frequency LS did not change within one year regardless of treatment efficacy. Figure 5 showed ΔLM was negatively correlated to ΔPDFF, while there is no correlation between ΔLS and ΔPDFF within one year.Discussion
The outlook for patients with NASH is guarded because many are at an increased risk of developing cirrhosis and hepatocellular carcinoma.5 Monitoring NAFLD with repeated liver biopsies has shown a variable natural history with 42% fibrosis progression and 18% regression over a median follow-up of 6.6 years.6, 7In this 12-week longitudinal preclinical study, NASH was well established at week 4, cirrhosis at week 12. High-frequency ΔLS primary indicates accelerated fibrosis development, while low-frequency ΔLM mainly reflects the accumulation of bound water to extracellular matrix (i.e., hepatic fibrosis), as well as increased interstitial fluid induced by sustained mild inflammation. That is why both changes coped well with each other. It is a typical “burnt-out” NASH phenomenon for the observed negative correlation between ΔLS and ΔPDFF. In the one-year follow-up clinical study, the attribute the low-frequency ΔLM to resolution of mild inflammation due to successful weight loss and PDFF reduction, while high-frequency LS does not change significantly because fibrosis remodeling is much slower process, evolving over a timeframe of years.Advanced hepatic fibrosis is the primary driver and critical factor for long-term outcome and mortality in NASH.8, 9Steatosis change rate should directly impact the subsequent inflammation and fibrosis change. Our pilot studies indicate that ΔLM and ΔPDFF are promising for monitoring treatment effects in a short-term period, while ΔLS is recommended for stratifying significant fibrosis that needs treatment in long-term follow-up.Conclusion
The results of this study provide evidence that measured longitudinal changes in MRE-assessed LS and LM, as well as MRI-assessed PDFF, are useful for monitoring treatment effect and identifying NASH patients at high risk of early clinical progression.Acknowledgements
This study is funded by NIH grants EB017197 (M.Y.), EB001981(R.L.E.), DK115594 (A.M.A.), DK059615 (V.S.), and DoD grant W81XWH-19-1-0583-01 (M.Y.).References
1. Gariani K, Jornayvaz FR. Pathophysiology of NASH in endocrine diseases. Endocr Connect. 2021;10(2):R52-R65. Epub 2021/01/16. doi: 10.1530/EC-20-0490. PubMed PMID: 33449917; PMCID: PMC7983516.
2. Abdelaziz AO, Shousha HI, Said EM, Soliman ZA, Shehata AA, Nabil MM, Abdelmaksoud AH, Elbaz TM, Abdelsalam FM. Evaluation of liver steatosis, measured by controlled attenuation parameter, in patients with hepatitis C-induced advanced liver fibrosis and hepatocellular carcinoma. Eur J Gastroenterol Hepatol. 2018;30(11):1384-8. Epub 2018/09/05. doi: 10.1097/MEG.0000000000001196. PubMed PMID: 30179227.
3. Kim HJ, Kim B, Yu HJ, Huh J, Lee JH, Lee SS, Kim KW, Kim JK. Reproducibility of hepatic MR elastography across field strengths, pulse sequences, scan intervals, and readers. Abdom Radiol (NY). 2020;45(1):107-15. Epub 2019/11/14. doi: 10.1007/s00261-019-02312-9. PubMed PMID: 31720766.
4. Idilman IS, Li J, Yin M, Venkatesh SK. MR elastography of liver: current status and future perspectives. Abdom Radiol (NY). 2020;45(11):3444-62. Epub 2020/07/25. doi: 10.1007/s00261-020-02656-7. PubMed PMID: 32705312; PMCID: PMC7954231.
5. Anstee QM, Targher G, Day CP. Progression of NAFLD to diabetes mellitus, cardiovascular disease or cirrhosis. Nat Rev Gastroenterol Hepatol. 2013;10(6):330-44. Epub 2013/03/20. doi: 10.1038/nrgastro.2013.41. PubMed PMID: 23507799.
6. Pais R, Charlotte F, Fedchuk L, Bedossa P, Lebray P, Poynard T, Ratziu V, Group LS. A systematic review of follow-up biopsies reveals disease progression in patients with non-alcoholic fatty liver. J Hepatol. 2013;59(3):550-6. Epub 2013/05/15. doi: 10.1016/j.jhep.2013.04.027. PubMed PMID: 23665288.
7. Singh S, Allen AM, Wang Z, Prokop LJ, Murad MH, Loomba R. Fibrosis progression in nonalcoholic fatty liver vs nonalcoholic steatohepatitis: a systematic review and meta-analysis of paired-biopsy studies. Clin Gastroenterol Hepatol. 2015;13(4):643-54 e1-9; quiz e39-40. Epub 2014/04/29. doi: 10.1016/j.cgh.2014.04.014. PubMed PMID: 24768810; PMCID: PMC4208976.
8. Angulo P, Kleiner DE, Dam-Larsen S, Adams LA, Bjornsson ES, Charatcharoenwitthaya P, Mills PR, Keach JC, Lafferty HD, Stahler A, Haflidadottir S, Bendtsen F. Liver Fibrosis, but No Other Histologic Features, Is Associated With Long-term Outcomes of Patients With Nonalcoholic Fatty Liver Disease. Gastroenterology. 2015;149(2):389-97 e10. Epub 2015/05/04. doi: 10.1053/j.gastro.2015.04.043. PubMed PMID: 25935633; PMCID: PMC4516664.
9. Hagstrom H, Nasr P, Ekstedt M, Hammar U, Stal P, Hultcrantz R, Kechagias S. Fibrosis stage but not NASH predicts mortality and time to development of severe liver disease in biopsy-proven NAFLD. J Hepatol. 2017;67(6):1265-73. Epub 2017/08/15. doi: 10.1016/j.jhep.2017.07.027. PubMed PMID: 28803953.
Figures