3367
Reproducibility of Chemical Shift-Encoded MRI Fat Quantification in Liver Across Field Strengths in Patients with Iron Overload1Biomedical Engineering, University of Wisconsin-Madison, Madison, WI, United States, 2Radiology, University of Wisconsin-Madison, Madison, WI, United States, 3Medical Physics, University of Wisconsin-Madison, Madison, WI, United States, 4Medicine, University of Wisconsin-Madison, Madison, WI, United States, 5Emergency Medicine, University of Wisconsin-Madison, Madison, WI, United States
Synopsis
The purpose of this study is to assess the reproducibility of CSE-MRI methods to measure proton density fat fraction (PDFF) in liver in patients with iron overload. The PDFF measurements of 31 patients with known or suspected iron overload and 10 healthy volunteers were imaged at both 1.5T and 3.0T. Patients were separated into four groups with increasing liver iron concentration (LIC). The reproducibility across field strengths was quantified within each group and reported below.
Introduction
Chemical shift encoded MRI (CSE-MRI)-based proton density fat fraction (PDFF) is an established biomarker for quantification of tissue triglyceride concentration, with applications in the assessment of non-alcoholic fatty liver disease (NAFLD)1. Previous studies have demonstrated that CSE-based PDFF quantification is reproducible across protocols and field strengths2. However, the presence of concomitant liver iron overload (with corresponding increase in signal decay rate R2*=1/T2*) has an unknown effect on the reproducibility of PDFF quantification. This is clinically relevant, since NAFLD often coexists with iron overload2,3. Hence, the purpose of this study is to assess the reproducibility of CSE-MRI to quantify PDFF across different field strengths in patients with iron overload.Methods
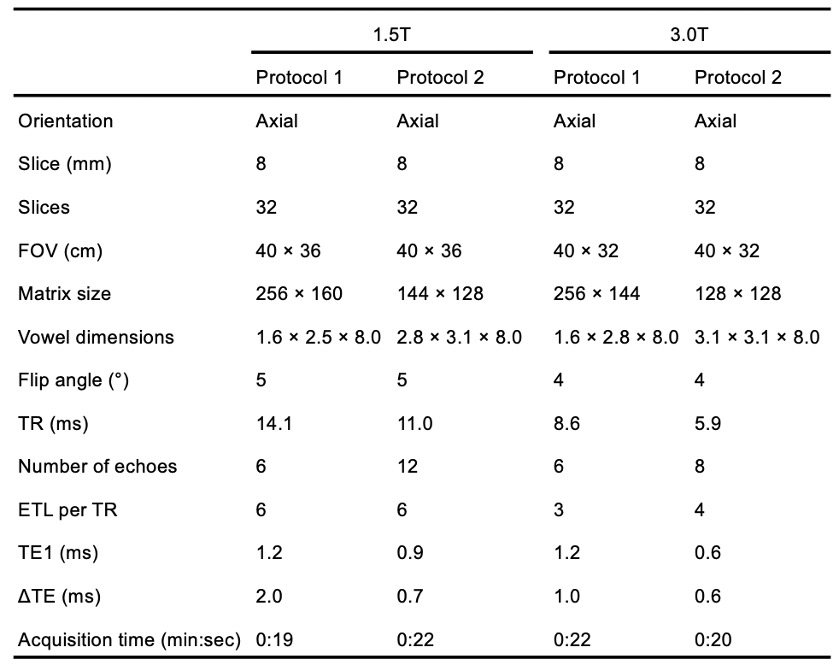
Overview and subjects: Data from a previously published study in healthy volunteers and patients with known or suspected liver iron overload were used to assess the reproducibility of PDFF across different field strengths (1.5T and 3.0T)4. All healthy volunteers and patients were recruited after obtaining IRB approval and informed written consent.PDFF mapping: Healthy volunteers and patients with known or suspected iron overload were scanned under two different protocols under each field strength: Protocol 1, which is a standard fat quantification acquisition, and Protocol 2, which has shorter echo times for improved performance in the presence of iron. See Table 1 for detailed acquisition parameters.
Confounder-corrected PDFF maps were reconstructed using least-squares complex fitting with a multi-peak fat model5. Regions of interest (ROIs) were drawn on each of the nine Couinaud liver segments. For each ROI, the mean PDFF value was recorded. The average value of the measured PDFF across all nine segments was calculated as the overall mean PDFF6.
Reference liver iron concentration (LIC) measurements were obtained for each subject using an FDA-approved, R2-based relaxometry method at 1.5T (Ferriscan, Resonance Health).
Analysis: Subjects were separated into four groups based on LIC: normal (LIC < 1.8 mg Fe/g), mild iron overload (1.8 mg Fe/g < LIC < 3.2 mg Fe/g), moderate iron overload (3.2 mg Fe/g < LIC < 7 mg Fe/g), and severe iron overload (LIC >7 mg Fe/g)7. Bland-Altman analysis was used for statistical analysis on liver mean PDFF. The reproducibility coefficient (RPC) across two field strengths was calculated for both liver mean PDFF and segment-by-segment PDFF from nine Couinaud liver segments.
Results
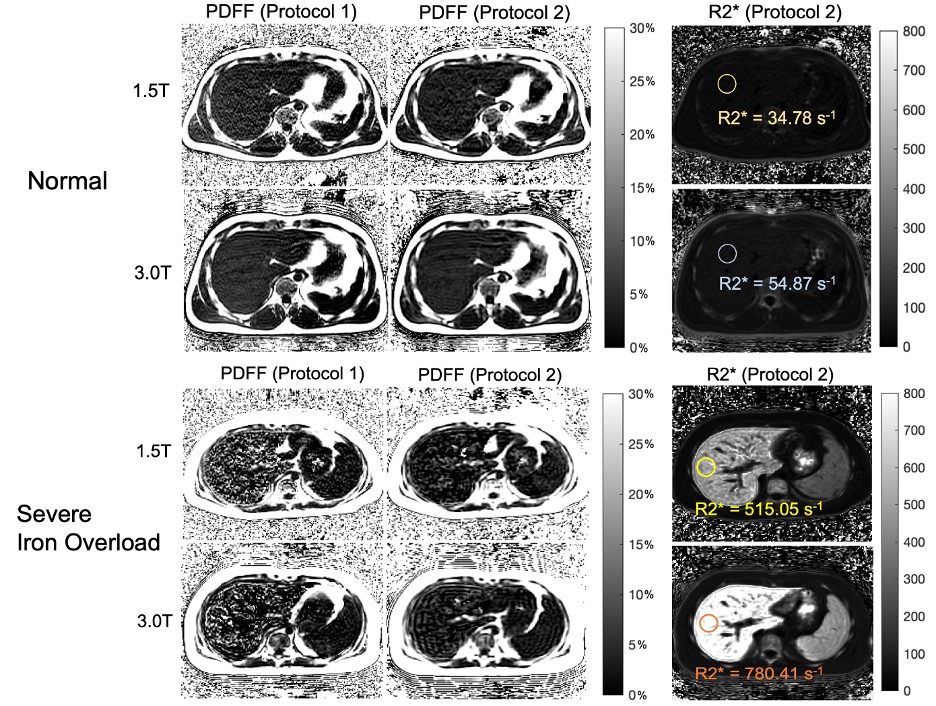
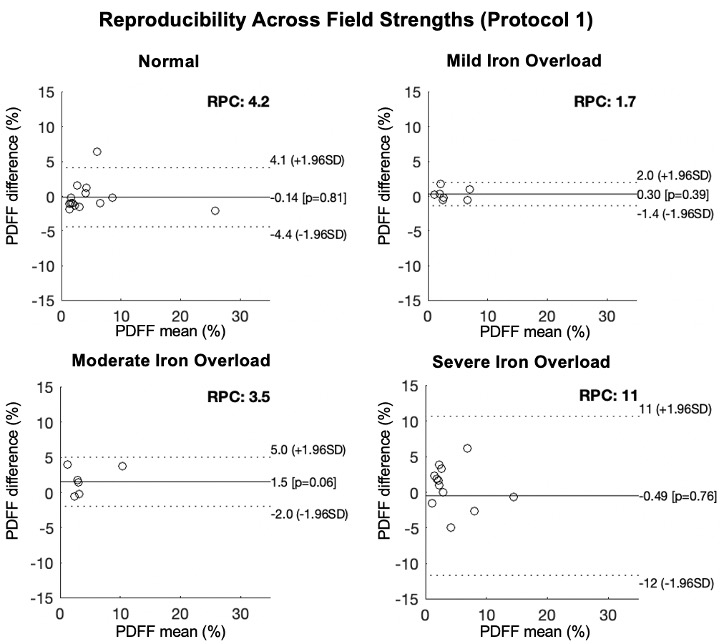
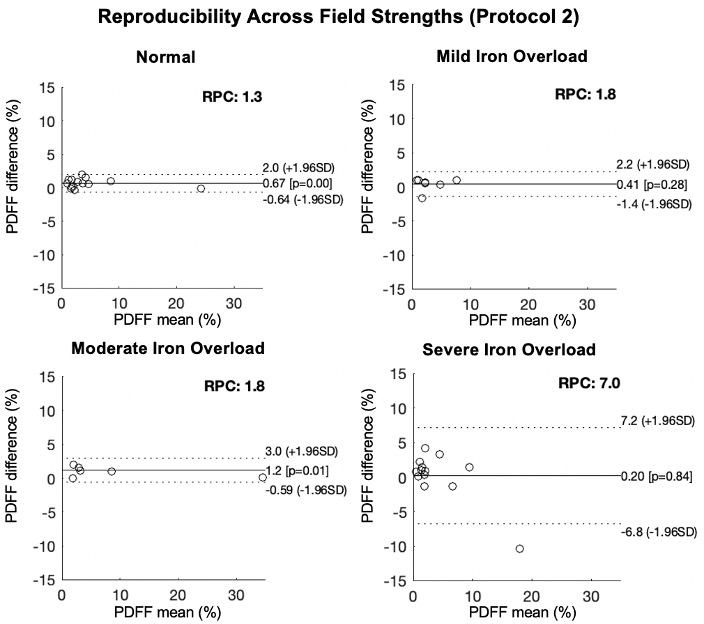
In total, 31 patients and 10 healthy volunteers were recruited. Figure 1 shows the PDFF maps using Protocol 1 and Protocol 2 respectively and R2* maps using Protocol 2 of patients with normal liver iron and severe liver iron deposition. As shown in this figure, PDFF maps in patients with high iron overload were of degraded image quality.Figures 2 and 3 show the reproducibility of PDFF measurements across field strengths using Protocol 1 and Protocol 2, respectively. Bland-Altman analysis demonstrated highly reproducible fat quantifications in patients with normal iron, mild iron overload, and moderate iron overload, but worsening reproducibility in patients with severe iron overload. The iron-optimized protocol (Protocol 2) demonstrated an overall better reproducibility than Protocol 1 as shown in Figure 3.
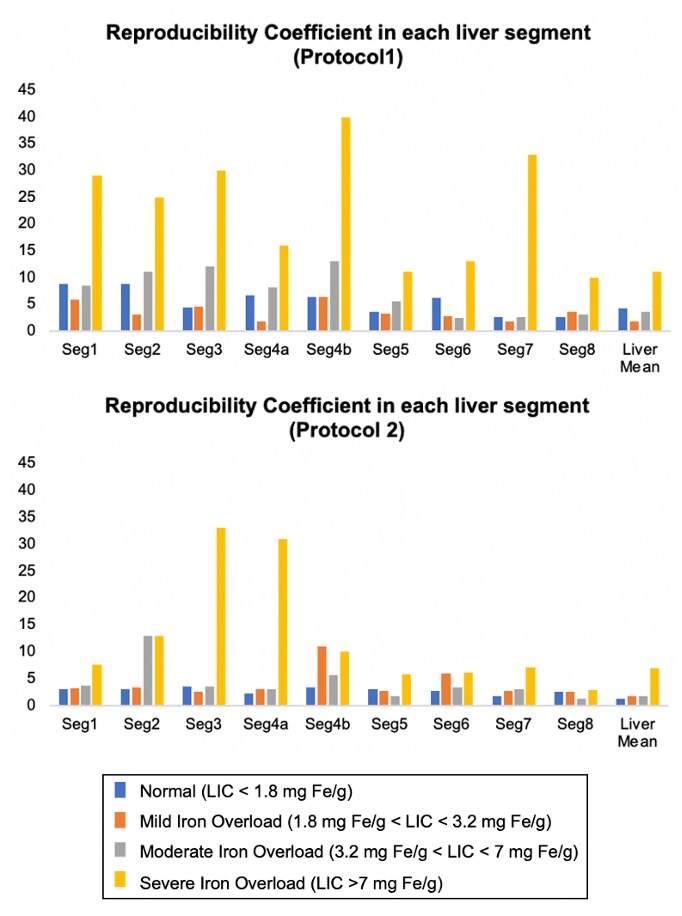
Figure 4 plots the reproducibility across field strengths for Protocol 1 and 2 across all Couinaud segments of the liver. Results demonstrate that measurements in liver segments 5, 6, 7 and 8, ie: right lobe of the liver, demonstrate better reproducibility across field strengths compared with segments from the left lobe of the liver.
Discussion & Conclusions
This study quantified the reproducibility of liver PDFF with increasing LIC, which indicates that the PDFF quantification in patients with severe iron overload (LIC > 7 mg Fe/g) is no longer reliable. These results are consistent with a recent study examining the ability of CSE-MRI to quantify PDFF in the presence of iron overload8.Limitations of this study include a moderate number of patients in each LIC group. Further, this study was conducted only on one MRI vendor using two protocols. Future validation across multiple vendors using multiple protocols would be desirable.
Overall, this study has demonstrated excellent reproducibility of PDFF mapping over a relatively wide range of liver iron concentrations, particularly when using optimized acquisition protocols. However, quantification of PDFF in the presence of severe iron overload has substantially poorer reproducibility.
Acknowledgements
The authors wish to acknowledge support from the NIH (R01 DK100651, R01 DK117354, R01 DK083380, and K24 DK102595), as well as GE Healthcare who provides research support to the University of Wisconsin. Additionally, Dr. Reeder is a Romnes Faculty Fellow, and has received an award provided by the University of Wisconsin-Madison Office of the Vice Chancellor for Research and Graduate Education with funding from the Wisconsin Alumni Research Foundation.References
1. S. B. Reeder and C. B. Sirlin, “Quantification of liver fat with magnetic resonance imaging,” Magnetic Resonance Imaging Clinics of North America, vol. 18, no. 3, pp. 337–357, 2010.
2. T. Yokoo, S. D. Serai, A. Pirasteh, M. R. Bashir, G. Hamilton, D. Hernando, H. H. Hu, H. Hetterich, J.-P. Kühn, G. M. Kukuk, R. Loomba, M. S. Middleton, N. A. Obuchowski, J. S. Song, A. Tang, X. Wu, S. B. Reeder, and C. B. Sirlin, “Linearity, bias, and precision of hepatic proton density fat fraction measurements by using MR imaging: A meta-analysis,” Radiology, vol. 286, no. 2, pp. 486–498, 2018.
3. K. P. Batts, “Iron overload syndromes and the liver,” Modern Pathology, vol. 20, no. S1, 2007.
4. D. Hernando, R. J. Cook, N. Qazi, C. A. Longhurst, C. A. Diamond, and S. B. Reeder, “Complex confounder-corrected R2* mapping for liver iron quantification with MRI,” European Radiology, vol. 31, no. 1, pp. 264–275, 2020.
5. D. Hernando, J. H. Kramer, and S. B. Reeder, “Multipeak fat-corrected complex R2* relaxometry: Theory, optimization, and clinical validation,” Magnetic Resonance in Medicine, vol. 70, no. 5, pp. 1319–1331, 2013.
6. C. A. Campo, D. Hernando, T. Schubert, C. A. Bookwalter, A. J. Pay, and S. B. Reeder, “Standardized approach for ROI-based measurements of proton density fat fraction and R2* in the liver,” American Journal of Roentgenology, vol. 209, no. 3, pp. 592–603, 2017.
7. T. G. St. Pierre, P. R. Clark, W. Chua-anusorn, A. J. Fleming, G. P. Jeffrey, J. K. Olynyk, P. Pootrakul, E. Robins, and R. Lindeman, “Noninvasive measurement and imaging of liver iron concentrations using Proton Magnetic Resonance,” Blood, vol. 105, no. 2, pp. 855–861, 2005.
8. T. J. Colgan, R. Zhao, N. T. Roberts, D. Hernando, and S. B. Reeder, “Limits of fat quantification in the presence of iron overload,” Journal of Magnetic Resonance Imaging, vol. 54, no. 4, pp. 1166–1174, 2021.
Figures