3366
Fat-Compensated T1 Mapping of Non-Alcoholic Fatty Liver Disease with MPRAGE and MP2RAGE1Faculty of Medicine, Dalhousie University, Halifax, NS, Canada, 2Diagnostic Radiology, Dalhousie University, Halifax, NS, Canada, 3Biomedical Translational Imaging Centre, Nova Scotia Health Authority, Halifax, NS, Canada, 4Pathology, Dalhousie University, Halifax, NS, Canada, 5General Internal Medicine, Dalhousie University, Halifax, NS, Canada
Synopsis
Fat is a confounding factor in the use of T1 measurements as a non-invasive method of assessing non-alcoholic fatty liver disease. A Dixon-based water/fat separation was used to produce T1 maps based on the separated water signal in MPRAGE and MP2RAGE sequences. A correlation inconsistent with biophysical processes was observed between uncorrected MP2RAGE T1 values and fibrosis stage, but using the fat compensated T1 values corrects the correlation. The same effect was seen to a lesser extent with MPRAGE T1 values. Further investigation and validation with a larger cohort may provide a more reliable biomarker of liver fibrosis within NAFLD.
Introduction
Non-alcoholic fatty liver disease (NAFLD) is a major health concern, with an estimated global prevalence of up to 25%1. While often benign, 20-30% of patients will progress to non-alcoholic steatohepatitis (NASH), which carries increased risk for fibrosis/cirrhosis and cancer2. Due to the limitations of biopsy for screening, non-invasive diagnostic tests capable of early detection of NASH are in great demand. While T1 measurements correlate with hepatic steatosis3, the degree of steatosis is not associated with steatohepatitis or fibrosis; in advanced disease with significant fibrosis, fat fraction may actually decrease4. Removing the confounding influence of fat from T1 measurements may lead to a more reliable MRI-based biomarker for NASH with or without fibrosis.Previous studies have used Bloch simulations5 for this purpose, or multi-parametric methods such as Fingerprinting6 and Multitasking7. We propose an alternative in which two-point Dixon fat/water separation is performed on T1-weighted images, with maps computed using the separated water signal. Rather than MOLLI [5] or variable flip angle techniques, which are sensitive to B1 inhomogeneity, we measure T1 with MP2RAGE8 and MPRAGE9. These offer robustness to B0 and B1 inhomogeneity, with the latter being entirely insensitive to B0 and B1 effects at the cost of additional scan time.
Methods
16 patients recruited to participate in a liver health research study under an NSH REB-approved protocol were imaged using MP2RAGE and MPRAGE sequences modified for multi-echo readout. Images were acquired on a GE MR750 3T system with a 32-channel abdominal RF coil, and the following parameters: 400x400x240 mm FOV, 160x160x24 matrix, TR/TE1/TE2 = 4.8/1.1/2.2ms, FA=5, ARC factor 3x2. MP2RAGE used TI=500/2300ms in a single 25s breath hold, while MPRAGE required three breath holds of 25s each, one for each inversion time (TI=100/800/3500ms). Clinical standard fat fraction maps were obtained with a chemical shift encoded technique (IDEAL IQ10).Prior to T1 map computation, fat-water separation was performed on each T1-weighted volume using the FLEX algorithm in GE’s Orchestra Toolkit. This provides magnitude-only water and fat images, but computation of MP2RAGE and MPRAGE T1 maps requires sign information, so the sign of each pixel in the water-only images was estimated based on the inversion time, fat fraction, and relative signal intensities of the in-phase, (water+fat), and (water-fat) images. T1 maps were computed based on sign-corrected water-only images, and from out-of-phase and in-phase images prior to water/fat separation, to produce T1 maps without fat compensation for comparison. Fat fraction maps were computed from IDEAL IQ, and from the ratio of fat/(fat+water) images obtained from MPRAGE and MP2RAGE.
Regions of interest (ROI) drawn in all 8 segments of the liver (based on T1-weighted anatomical scans) were registered to the T1 maps, and T1 values were extracted. Data analyses in GraphPad Prism 9 used the mean liver T1 averaged across all ROIs for a particular patient and scan type. Fat fraction values from IDEAL IQ were extracted from the same ROIs. Fibrosis stage was obtained from biopsy and graded by a specialized hepatopathologist on a 1-4 scale, with 4=cirrhosis.
Results and Discussion
Figure 1 compares the mean liver fat fraction from MPRAGE and MP2RAGE, with that from the clinical standard IDEAL IQ. In both cases there is strong agreement, indicating that Dixon-based fat separation in the T1 mapping methods performs as intended.MP2RAGE (Figure 2) exhibits strong correlations between the fat fraction and both the in-phase and out-of-phase T1. However, the water-only T1 shows no significant relationship to fat fraction, and should therefore reflect biophysical processes other than fat accumulation. The mean water T1 across subjects (787ms) is consistent with previously published values [3,4].
The correlation of MPRAGE-derived T1 values (Figure 3) is not as significant, but there is still a non-zero slope when comparing out-of-phase and in-phase T1 values with fat fraction, which is removed for the case of water-only T1. The mean T1 across patients (1309ms) is higher than in MP2RAGE.
Out-of-phase and in-phase MP2RAGE images show a decrease in T1 as a function of fibrosis stage (Figure 4a). However, this is inconsistent with known biophysical processes, in which increased extracellular water fraction lengthens T1 as fibrosis progresses11. Indeed, Figure 5 shows significantly higher fat fraction in those patients with low fibrosis stage, leading to inflated T1 values. When T1 is computed from water-only MP2RAGE images, the expected trend toward higher T1 at increased fibrosis stage is restored. The impact of fat compensation on MPRAGE T1 values is less clear (Figure 4b), but the overall relationship between T1 and fibrosis stage is similar as in water-only MP2RAGE.
The small sample size (N=16) limits the statistical significance of observed trends. In the future we intend to retrospectively correct MP2RAGE or MPRAGE data acquired with similar parameters (but without explicit fat compensation) to generate a synthetic water-only T1 value, which can be compared to fibrosis stages and other clinical outcomes in a larger cohort.
Conclusions
Dixon-based water/fat separation prior to T1 computation allows the influence of fat to be removed or reduced in MP2RAGE and MPRAGE-based T1 measurements of the liver. Further investigation in a larger cohort is required to validate this technique and may provide a more reliable biomarker of liver fibrosis in the setting of NAFLD.Acknowledgements
Thanks to Dr. Kevork Peltekian and staff of the Division of Digestive Care and Endoscopy for assistance with patient recruitment. Funding support for patient scans was provided by the David Fraser Radiology Research Foundation, the Nova Scotia Health Authority Research Fund, and the QEII Health Science Centre’s Department of Radiology 3T MRI Grant.
References
1. Chalasani N, Younossi Z et al. The diagnosis and management of nonalcoholic fatty liver disease: Practice guidance from the American Association for the Study of Liver Diseases. Hepatology 2018;67(1):328-357.
2. Bellentani S. The epidemiology of non-alcoholic fatty liver disease. Liver Int 2017; 37 Suppl 1:81-84.
3. Ahn JH, Yu JS, et al. Effect of hepatic steatosis on native T1 mapping of 3T magnetic resonance imaging in the assessment of T1 values for patients with non-alcoholic fatty liver disease. Magn Reson Imaging 2021;80:1-8.
4. Dennis A, Kelly MD et al. Correlations Between MRI Biomarkers PDFF and cT1 With Histopathological Features of Non-Alcoholic Steatohepatitis. Front Endocrinol 2021; 11:575843.
5. Mozes FE, Tunnicliffe EM et al. Mapping tissue water T1 in the liver using the MOLLI T1 method in the presence of fat, iron and B0 inhomogeneity. NMR Biomed 2019; 32:e4030.
6. Cencini M, Biagi L et al. Magnetic resonance fingerprinting with dictionary‐based fat and water separation (DBFW MRF): A multi‐component approach. Magn Reson Med 2019; 81:3032:3045.
7. Wang N, Cao T et al. Six-dimensional, free-breathing multitasking multi-echo (MT-TE) MRI for whole-liver T1, PDFF and R2* quantification. Proc ISMRM 2021; #0609.
8. Marques JP, Kober T et al. MP2RAGE, a self bias-field corrected sequence for improved segmentation and T1-mapping at high field. NeuroImage 2010; 49: 1271-1281.
9. Liu JV, Bock NA, Silva AC. Rapid high-resolution three-dimensional mapping of T1 and age-dependent variations in the non-human primate brain using magnetization-prepared rapid gradient-echo (MPRAGE) sequence. NeuroImage 2011; 56:1154-1163.
10. Reeder SB, Pineda AR, et al. Iterative decomposition of water and fat with echo asymmetry and least-squares estimation (IDEAL): application with fast spin-echo imaging. Magn Reson Med 2005;54(3):636–44.
11. Hoffman DH, Ayoola A, et al. T1 mapping, T2 mapping and MR elastography of the liver for detection and staging of liver fibrosis. Abdominal Radiology 2020; 45:692–700.
Figures
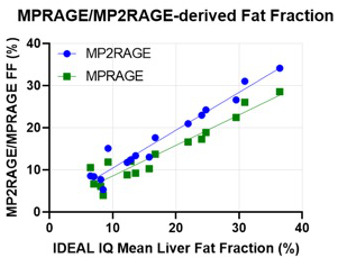
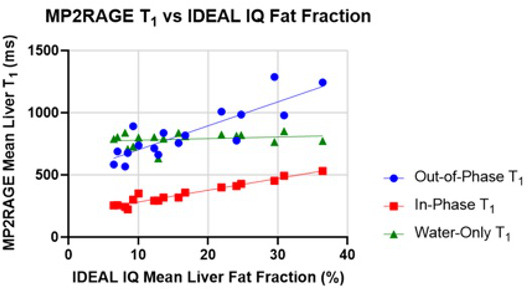
Figure 2. MP2RAGE-derived T1 values as a function of fat fraction. Both out-of-phase and in-phase images yield T1 measurements that correlate with fat fraction (slopes are significantly different from zero, p < 0.0001), but there is no significant correlation between the fat fraction and the water-only T1 (p=0.3976) indicating that the effect of fat on the T1 measurement has been mitigated.
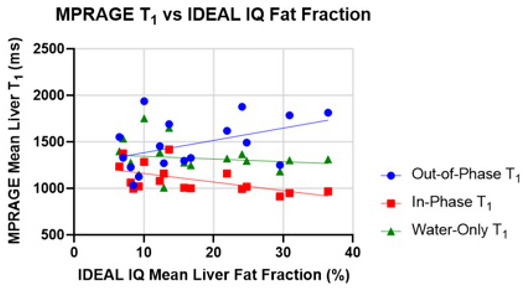
Figure 3. MPRAGE-derived T1 values as a function of fat fraction. For this sequence, T1 values from the out-of-phase image appear to increase with fat fraction (slope differs from zero with p=0.071), while in-phase images yield a T1 that decreases with fat fraction (slope significantly different from zero, p=0.017). Water-only T1 values do not exhibit this behavior and have a relatively stable value regardless of fat fraction (slope is not significantly different from zero, p=0.586).
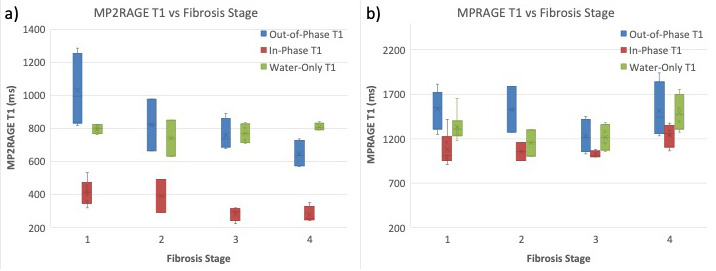
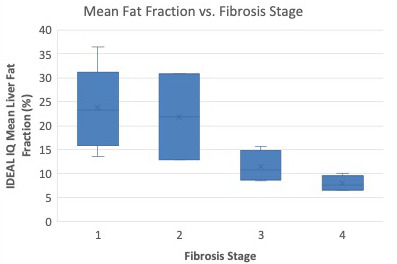
Figure 5. Mean liver fat fraction from the cohort of patients in this study (N=16) as a function of fibrosis stage assessed via pathology. There is an overall trend of decreasing fat fraction as fibrosis stage increases, as has been previously been observed in literature.