3365
Lung perfusion at 0.55T using ASL: Feasibility and Initial Results1Electrical and Computer Engineering, University of Southern California, Los Angeles, CA, United States, 2Biomedical Engineering, University of Southern California, Los Angeles, CA, United States, 3Siemens Medical Solutions USA, Inc., Los Angeles, CA, United States
Synopsis
Lung perfusion is challenging because of the complex anatomy and pulsatile blood flow. At 1.5T and 3T, a major challenge is the low signal from parenchyma due to the short T2*. Here, we demonstrate feasibility of lung ASL perfusion imaging on a high-performance 0.55T system. Experiments were performed using FAIR labeling with snapshot bSSFP imaging and quantified using Buxton’s GKM. In four healthy volunteers, pulmonary blood flow (PBF) ranges from 0.62 to 0.99 ml-blood/ml-tissue/min, which are within the expected range (0.51 to 1.52 ml/ml/min) and agree with the total average PBF estimated by a phase contrast method.
Introduction
Quantitative measurement of pulmonary blood flow (PBF) and its spatial distribution is of clinical importance for the diagnosis of several pulmonary diseases such as pulmonary embolism, pulmonary hypertension and chronic obstructive disease (1). Arterial Spin Labeling (ASL) (2) is a non-contrast perfusion imaging technique that uses blood water as an endogenous tracer. However, lung perfusion with ASL has been challenging because of the complex anatomy, pulsatile blood flow (3), and low signal from parenchyma. At 1.5T and 3T, arguably the biggest challenge is low signal from parenchyma due to the short T2*. It has recently been shown that high-performance 0.55T systems provide improved field homogeneity and prolonged T2*, resulting in significantly higher lung parenchyma signal (4). In this study, we demonstrate the feasibility of ASL perfusion assessment at 0.55T with flow alternative inversion recovery (FAIR) - based balanced steady-state free precession (bSSFP) imaging.Methods
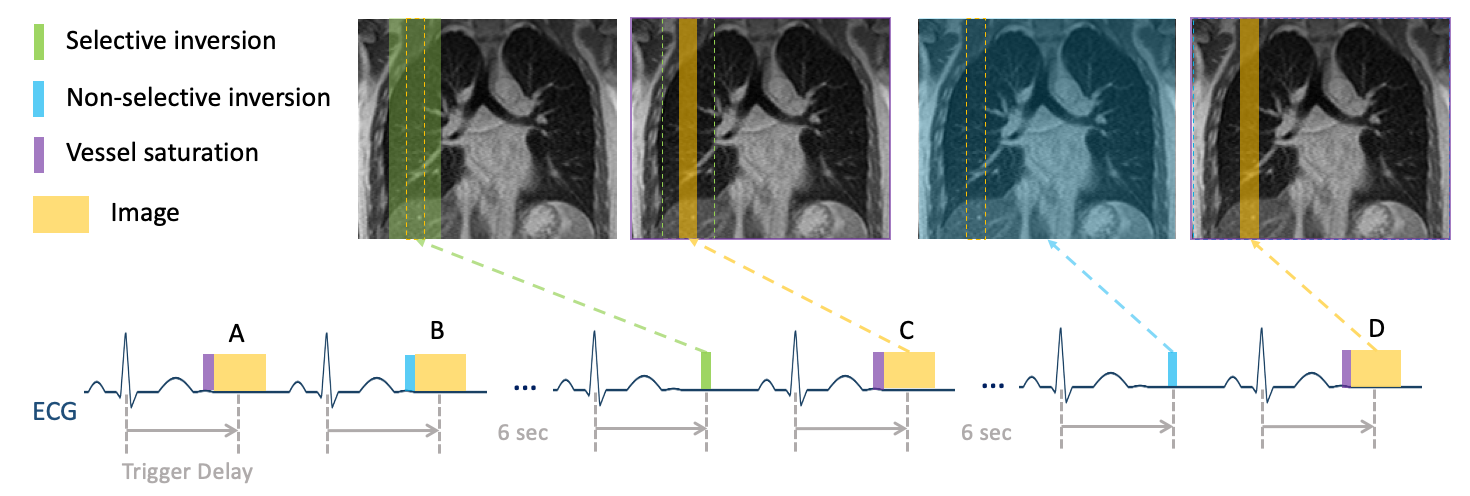
ASL pulse sequence Figure 1 illustrates the proposed cardiac gated FAIR-bSSFP pulse sequence. Imaging was performed during diastole (3). The trigger delay was set to approximately half of the RR interval (450 to 500ms). Images were acquired during a 16 sec end-expiration breath hold. A sagittal plane was chosen to avoid signal contamination by large major vessels. Other imaging parameters were: FOV = 320 x 288 mm2, resolution = 2.5 x 2.5 x 15 mm3, inversion thickness = 45 mm; TE/TR = 1.87/3.75 ms, Bandwidth = 120 kHz, flip angle = 70°, number of averages = 6. To reduce the contribution of vessels on the PBF map, A BIR-4 velocity selective (VS) saturation pulse (5) with a gradient crusher was applied immediately before image acquisition. To explore the efficiency of the intravascular crushing, 1) a range of cut-off velocity Vcut was tested: 1 cm/s, 2 cm/s and 4 cm/s, 2) orientations of a bipolar gradient were tested: Right-Left (R-L), Anterior-Posterior (A-P), and Superior-Inferior (S-I) directions. As a comparison, FAIR-bSSFP without VS saturation was also performed.In-vivo experiments Experiments were performed using a whole body 0.55T system (prototype MAGNETOM Aera, Siemens Healthineers, Erlangen, Germany) equipped with high-performance shielded gradients (45 mT/m amplitude, 200 T/m/s slew rate). A real-time imaging platform(RT-Hawk, Heart Vista Inc, Los Altos, CA) was used to design/play ASL pulse sequences. Data were collected using a 6-channel body array (anterior) and 6 elements from a table-integrated 18-channel spine array (posterior). Four healthy volunteers (3M/1F) were scanned. To provide an alternate measurement of total lung perfusion, CINE phase contrast (PC) imaging was performed with a scan plane perpendicular to the right pulmonary artery (RPA) (6). VENC was experimentally selected as the minimum value without phase wrapping (80-100cm/s). A 3D T1-weighted GRE sequence with volumetric interpolated breath-hold examination (VIBE) was used to measure the total lung volume during end-of-exhalation.
Analysis Images were reconstructed with SENSE (R=1) (7) using MATLAB. PBF maps were estimated using Buxton’s general kinetic model (8). The potential errors in quantitative maps from thermal noise(TN) and physiological fluctuations(PN) were estimate by standard deviation(STD), temporal STD maps, and the ratio between them (9).
Results
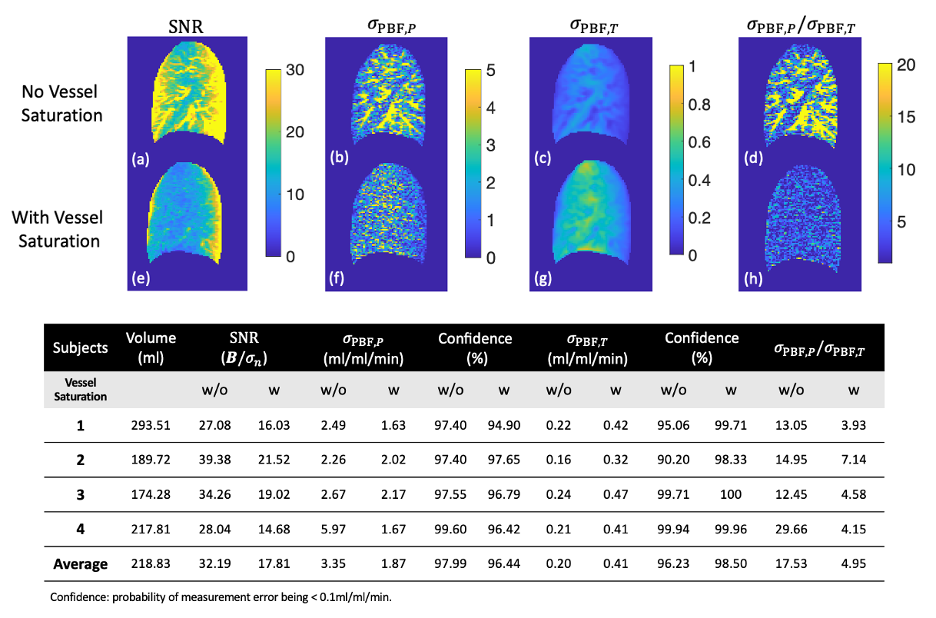
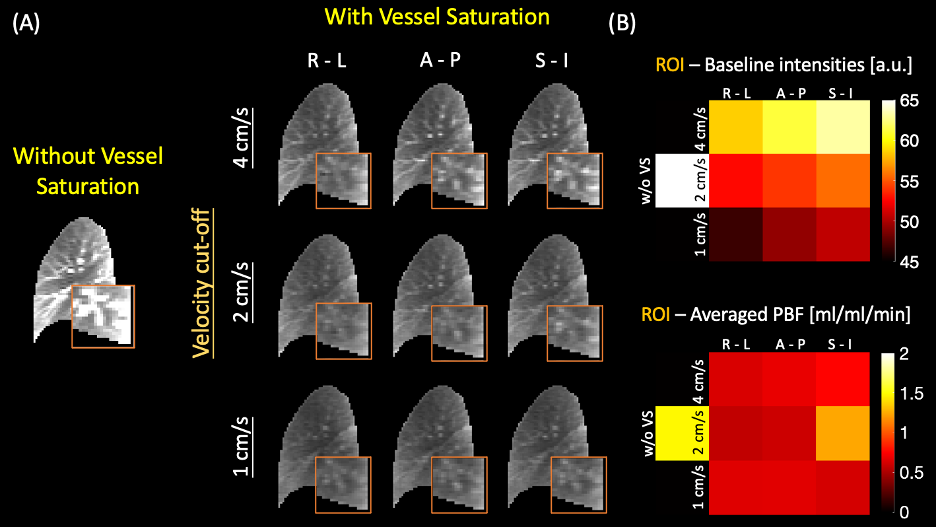
Figure 2 demonstrates SNR, physiological and thermal noise analysis. The vessels are substantially suppressed in (f) SNR and (h) $$$\sigma_{PBF, P}$$$/$$$ \sigma_{PBF, T}$$$ ratio maps with VS saturation, resulting in reduced physiological noise. The averaged $$$\sigma_{PBF, P}$$$/$$$ \sigma_{PBF, T}$$$ value has substantially decreased from 17 to 5 with VS saturation.Figure 3 demonstrates the impact of vessel saturation on baseline images and calculated PBF. The vessel regions (orange box) are clearly suppressed (A,right) in baseline images compared with those without saturation (A,left). VS saturation applied along the R-L direction gives the best performance, especially with Vcut=4cm/s. Quantitatively, the average of baseline intensities is minimum with Vcut=1cm/s and RL direction. The measured PBF is reduced with vessel saturation.
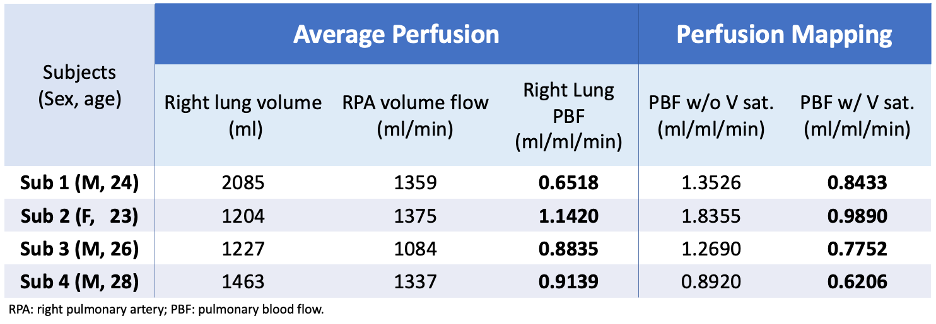
Table 1 compares the ASL PBF estimates against the average perfusion estimated by PC. The ASL perfusion estimates are reduced by 0.3–0.9 ml/ml/min when vessel saturation is applied. Overall, the average perfusion matches well with ASL PBF estimates with vessel saturation, resulting in differences within 0.29 ml/ml/min.
Discussion
This study has several limitations. First, we assumed that M0$$$\approx$$$B, resulting in large variations in (c and g in Figure 2), that are due to variations in baseline signal without versus with vessel saturation. The ASL modeling also includes several assumptions, including on-resonance bSSFP, perfect saturation efficiency, perfect blood-tissue partition coefficient, identical T1 values of lung parenchyma and feeding blood, and uniform distribution of T1 and T2 in lung. Bloch equation-based ASL signal modeling incorporating B1+, T1, T2, and off-resonance may provide improved pixel-wise quantification. Finally, for total PBF, we used a phase contrast method without compensating background phase (11) that would improve the accuracy. These limitations are all surmountable.Gravity-related PBF differences between anterior and posterior regions in the supine and prone positions (10) have been reported (~2.4%), but the proposed technique was not sensitive enough to capture such small differences.
Conclusion
We have demonstrated the feasibility of measuring lung perfusion using breath-hold, FAIR-bSSFP snapshot imaging at 0.55T with sufficient SNR (>14). We detect the pulmonary blood flow from 0.62 to 0.99 ml-blood/ml-tissue/min in four healthy volunteers, which agrees well with total average perfusion measured by a phase contrast method.Acknowledgements
We acknowledge grant support from the National Science Foundation (#1828736) and research support from Siemens Healthineers.References
1. Hopkins SR, Wielpütz MO, Kauczor HU. Imaging lung perfusion. J. Appl. Physiol. 2012;113:328–339.
2. Wong EC. An introduction to ASL labeling techniques. J. Magn. Reson. Imaging 2014;40:1–10.
3. Nichols WW, O’Rourke MF, Vlachopoulos C, Hoeks AP, Reneman RS. McDonald’s blood flow in arteries theoretical, experimental and clinical principles. McDonald’s Blood Flow Arter. Sixth Ed. Theor. Exp. Clin. Princ. 2011:1–742.
4. Campbell-Washburn AE, Ramasawmy R, Restivo MC, et al. Opportunities in interventional and diagnostic imaging by using high-performance low-field-strength MRI. Radiology 2019;293:384–393.
5. Wong EC, Guo J. BIR-4 based B1 and B0 insensitive velocity selective pulse trains. Proc. 18th Annu. Meet. ISMRM, Stock. Sweden 2010;18:2853.
6. Ugander M, Jense E, Arheden H. Pulmonary intravascular blood volume changes through the cardiac cycle in healthy volunteers studied by cardiovascular magnetic resonance measurements of arterial and venous flow. J. Cardiovasc. Magn. Reson. 2009;11.
7. Pruessmann KP, Weiger M, Scheidegger MB, Boesiger P. SENSE: Sensitivity encoding for fast MRI. Magn. Reson. Med. 1999;42:952–962.
8. Bolar DS, Levin DL, Hopkins SR, et al. Quantification of regional pulmonary blood flow using ASL-FAIRER. Magn. Reson. Med. 2006;55:1308–1317.
9. Zun G, Wong EC, Nayak KS. Assessment of myocardial blood flow (MBF) in humans using arterial spin labeling (ASL): Feasibility and noise analysis. Magn. Reson. Med. 2009;62:975–983.
10. Glenny RW, Lamm WJE, Albert RK, Robertson HT. Gravity is a minor determinant of pulmonary blood flow distribution. J. Appl. Physiol. 1991;71:620–628.
11. Hofman MB, Rodenburg MJ, Bloch KM, et al. In-vivo validation of interpolation-based phase offset correction in MR flow quantification: A multi-vendor, multi-center study. J. Cardiovasc. Magn. Reson. 2016;18:1–3.
Figures