3364
Whole Liver Phase-Based R2 Mapping in Liver Iron Overload within a Breath-hold
Ruvini Navaratna1,2, Daiki Tamada2, Diego Hernando1,2, and Scott B Reeder1,2,3,4,5
1Medical Physics, University of Wisconsin-Madison, Madison, WI, United States, 2Radiology, University of Wisconsin-Madison, Madison, WI, United States, 3Emergency Medicine, University of Wisconsin-Madison, Madison, WI, United States, 4Medicine, University of Wisconsin-Madison, Madison, WI, United States, 5Biomedical Engineering, University of Wisconsin-Madison, Madison, WI, United States
1Medical Physics, University of Wisconsin-Madison, Madison, WI, United States, 2Radiology, University of Wisconsin-Madison, Madison, WI, United States, 3Emergency Medicine, University of Wisconsin-Madison, Madison, WI, United States, 4Medicine, University of Wisconsin-Madison, Madison, WI, United States, 5Biomedical Engineering, University of Wisconsin-Madison, Madison, WI, United States
Synopsis
There is an unmet need for non-invasive methods that provide rapid and accurate quantification of liver iron concentration (LIC) over a wide range of iron overload severity. Current R2 mapping techniques suffer from long acquisition times and limited spatial coverage. Recently, a phase-based R2 mapping technique for rapid whole-liver R2 quantification within a single breath-hold has been introduced. However, the feasibility of this method to quantify liver iron overload has not been demonstrated. In this work, we optimize and validate phase-based R2 mapping to quantify R2 in phantom experiments, healthy volunteers, and demonstrate feasibility in patients with iron overload.
Introduction
Excess accumulation of iron in hereditary hemochromatosis and transfusional hemosiderosis is an established risk factor for cirrhosis, hepatocellular carcinoma, liver failure, and heart failure among other complications.1 Diagnosis and treatment of iron overload is often evaluated through measurement of liver iron concentration (LIC). MR-based R2 (=1/T2) mapping methods have been shown to have good correlation with LIC,2 but the current standard, the spin-echo sequence, is prone to lengthy acquisition times, limited coverage of the liver, and respiratory artifacts.Preliminary work on a novel phase-based R2 mapping method has shown promise to quantify whole-liver R2 within a single breath-hold.3,4 It has been shown that the signal phase (θ) of an RF phase modulated 3D gradient echo (GRE) decreases monotonically with increasing R2 through the use of small RF phase increments. Using a Bloch equation simulation lookup table (requiring approximate knowledge of the T1), R2 can be estimated from the signal phase.
A modified version of the phase-based R2 method for high R2 mapping with a short TR has been presented.3 However, clinical demonstration of this technique in high R2 tissues seen in liver iron overload has not been shown. Therefore, the purpose of this work is to optimize and demonstrate the feasibility of the phase-based R2 method in liver iron overload patients.
Methods
Phantom Acquisition: Eleven vials of varying MnCl2 concentration (0.3 – 3.7 mM) in agarose gel (2% w/v) were constructed to achieve high R2 values, nominally 40 – 400 s-1 (Figure 1a). Vials were imaged on a 3.0T MR system (Signa Premier, GE Healthcare, Waukesha, WI) using a standard head coil (AIR Coil, 48 channel, GE Healthcare). Reference R2 and T1 values were found using single-echo spin-echo (SE) and inversion-recovered spin-echo (SE-IR) acquisitions, respectively. Acquisition parameters are shown in Table 1.Volunteer/Patient Enrollment: A volunteer/patient feasibility study was performed with approval from the local IRB and informed consent was obtained from all subjects. Five healthy volunteers were enrolled in the study. Two adults with known liver iron overload were also recruited. Inclusion criteria included patients with an estimated LIC between 5-15 mg/g.
Volunteer/Patient MR Acquisition: Liver imaging was performed on a 3.0T MR system (Signa Premier, GE Healthcare, Waukesha, WI) using a posterior and anterior receive array coil (AIR Coil, GE Healthcare) for the abdomen. 3D RF phase modulated GRE images of the whole-liver were acquired for phase-based R2 mapping. IDEAL IQ (GE Healthcare, Waukesha, WI) was acquired for R2* mapping.
Reference R2 values were determined using a single breath-hold, single-voxel, multi-TE STEAM-MRS5 on a 20x20x20 mm3 volume in the right lobe of the liver, avoiding blood vessels. Acquisition parameters are shown in Table 1.
Reconstruction/Analysis: An “average first, fit second” method3 was applied to avoid inaccurate R2 estimates due to negative phase measurements related to image noise at high iron concentrations. The average phase from an ROI in the liver was estimated, and then mapped to the corresponding R2 value from a lookup table.
Since the value of T1 (required for the lookup table) is unknown, a T1 correction3 was applied using an a priori relationship between T1 and T2. This relationship was calculated from a linear regression of SE T2 as a function of SE-IR T1 for the phantom and using results from a recent multi-center liver iron study6 for in vivo imaging.
Bland-Altman analysis was performed to compare phase-based R2 estimates with reference spin echo R2 estimates in phantoms and reference STEAM-MRS R2 estimates in volunteers/patients.
Results
Phantom Experiments: Phantom studies confirm that phase-based R2 quantification closely matches reference single-echo spin echo R2 measurements at high R2 values (Figure 1). Bland-Altman (Figure 1b) and linear regression (Figure 1c) analysis comparing phase-based R2 and reference single-echo SE R2 (Figure 1a) estimates is shown.Healthy Volunteer Study: Images from the volunteer study demonstrate good agreement between the phase-based R2 estimate and the reference STEAM-MRS R2 for all five volunteers (Figure 2). An example volunteer R2 map is shown in Figure 2a. Results from Bland-Altman analysis comparing phase-based R2 and reference STEAM-MRS R2 is shown in Figure 2b.
Iron Overload Patient Study: ROI histogram analysis comparing signal phase in the iron overload patient and a healthy volunteer is shown (Figure 3). The histogram demonstrates the need for “average first, fit second” in iron overloaded tissue. Images from the iron overload patient study demonstrate good agreement between the phase-based R2 estimate and reference STEAM-MRS R2 for patient 1 (Figure 4). The MRS acquisition failed for patient 2.
Discussion and Conclusions
In this work, we have investigated the application and feasibility of the phase-based R2 mapping method for iron overload assessment in phantoms, healthy volunteers, and patients with known iron overload. Compared with standard spin echo based R2 mapping methods, phase-based R2 mapping has potential to quantify R2 in even severely iron overloaded patients with a significantly reduced acquisition time. This allows for whole-liver R2 quantification over a wide range of LIC within a single-breath hold. Limitations of this work include the limited patient population size and use of only 3.0T. Further studies in a larger cohort of patients with known or suspected iron overload at both 1.5T and 3.0T are planned.Acknowledgements
The authors wish to acknowledge support from the NIH (R01-DK100651, UL1-TR00427, R01-DK117354), as well as GE Healthcare who provides research support to the University of Wisconsin. Ruvini Navaratna is supported by an NIH Metabolism and Nutrition Training Program (MANTP) T32 Fellowship (T32-DK007665). Finally, Dr. Reeder is a Romnes Faculty Fellow, and has received an award provided by the University of Wisconsin-Madison Office of the Vice Chancellor for Research and Graduate Education with funding from the Wisconsin Alumni Research Foundation.References
- Kew MC. Hepatic iron overload and hepatocellular carcinoma. Cancer Lett. 2009;286(1):38-43. doi:10.1016/j.canlet.2008.11.001
- St. Pierre TG, Clark PR, Chua-Anusorn W, et al. Noninvasive measurement and imaging of liver iron concentrations using proton magnetic resonance. Blood. 2005;105(2):855-861. doi:10.1182/blood-2004-01-0177
- Navaratna R, Tamada D, Simchick G,
Hernando D, Reeder S. T2 Quantification in Liver Iron Overload Using RF Phase
Modulated Gradient Echo MRI.
29th
Annual Meeting of ISMRM. 2021. (No. 1876).
- Wang X, Hernando D, Reeder SB. Phase-based T2 mapping with gradient echo imaging. Magn Reson Med. 2020;84(2):609-619. doi:10.1002/mrm.28138
- Hamilton G, Middleton MS, Hooker JC, et al. In vivo breath-hold 1H MRS simultaneous estimation of liver proton density fat fraction, and T1 and T2 of water and fat, with a multi-TR, multi-TE sequence. J Magn Reson Imaging. 2015;42(6):1538-1543. doi:10.1002/jmri.24946
- Simchick G, Zhao R, Hamilton G, Reeder SB, Hernando D. Spectroscopy-based multi-parametric quantification in subjects with liver iron overload at 1.5T and 3T. Magn Reson Med. doi:https://doi.org/10.1002/mrm.29021
Figures

Figure
1. Phantom experiments demonstrate good correlation between the phase-based R2
and reference spin-echo R2 estimates. (a) Reference R2 map generated from a
single-echo spin-echo (SE) sequence. (b) Bland-Altman plot of phase-based (PB)
R2 compared to single-echo SE R2 is shown. (c)
Linear regression of phase-based R2 as a function of single-echo SE R2 is
shown. Slope and intercept are shown with their 95% confidence interval. The
identity line is plotted as a dashed line.
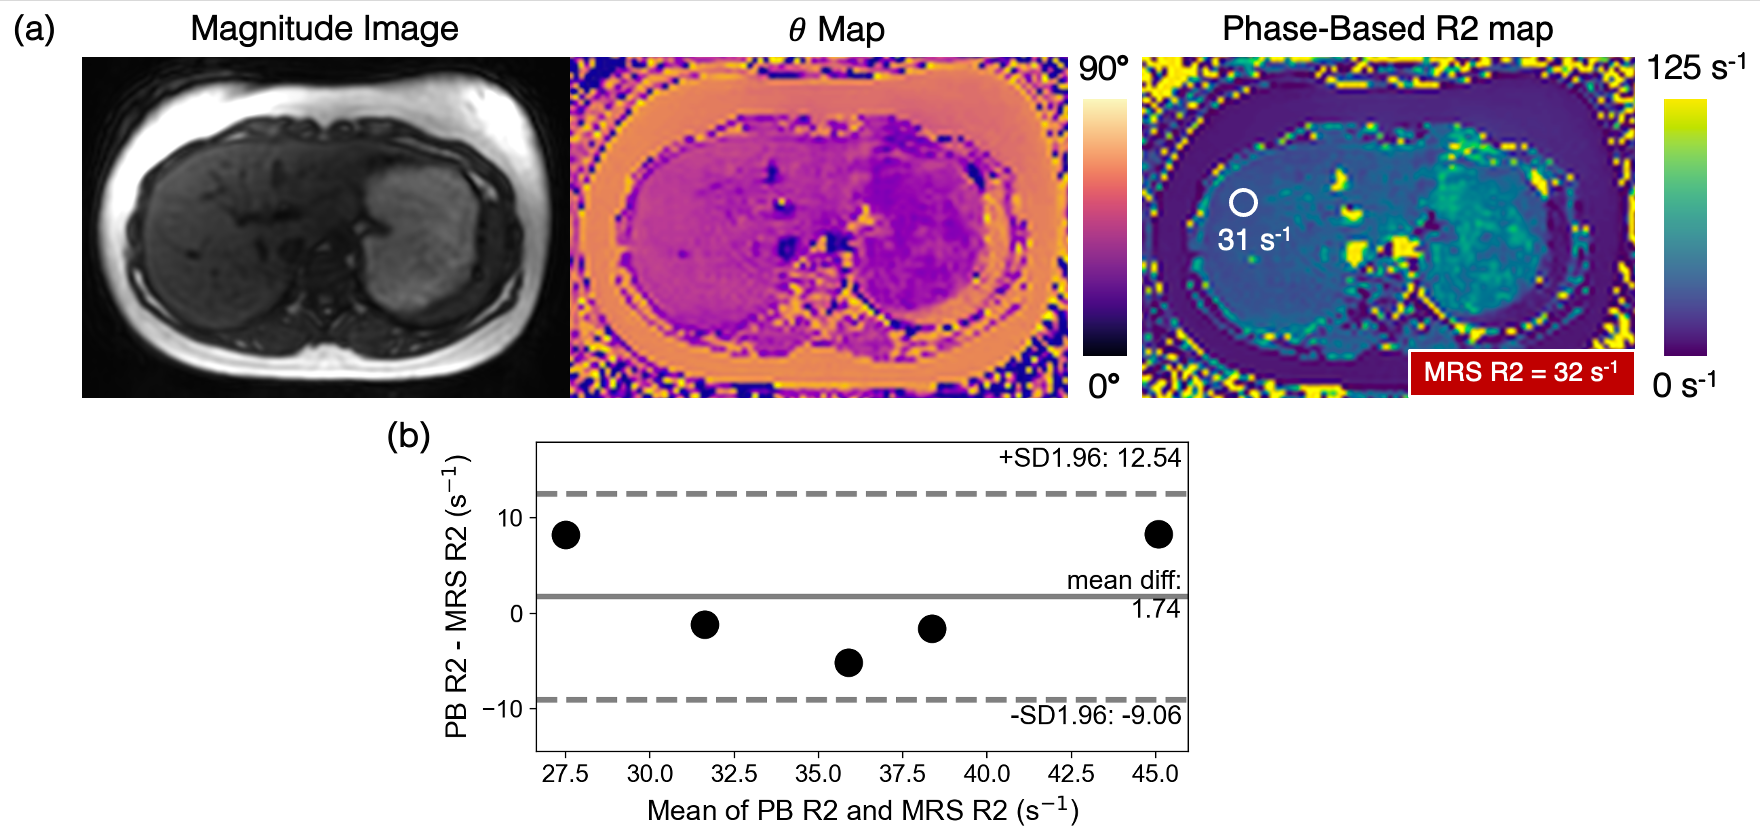
Figure
2. Volunteer experiments demonstrate good agreement between the phase-based
(PB) R2 and reference MRS R2 estimates.
(a) Example of a volunteer phase-based GRE magnitude image, phase (θ) map, and
associated phase-based R2 map with corresponding ROI PB R2 and MRS R2 estimates. The phase-based R2 map is generated assuming T1 = 1000 ms,
while the R2 estimate in the ROI is estimated using “average first, fit second” (Figure 3)
and T1-corrected reconstruction3. (b) Bland-Altman plot of ROI PB R2 as a
function of STEAM MRS R2 for all five volunteers is shown.

Figure
3. ROI histogram analysis comparing healthy and iron overloaded tissue demonstrates
the necessity of the “average first, fit second” technique in high R2 tissue.
An ROI (green) drawn in the GRE signal phase (θ) map of the healthy volunteer liver
demonstrates high signal phase with no negative phase values. An ROI (blue)
drawn in the phase map of a high R2 region of the iron overload patient liver
has some voxels with negative phase values which map to very high, inaccurate
R2s if no averaging is done.
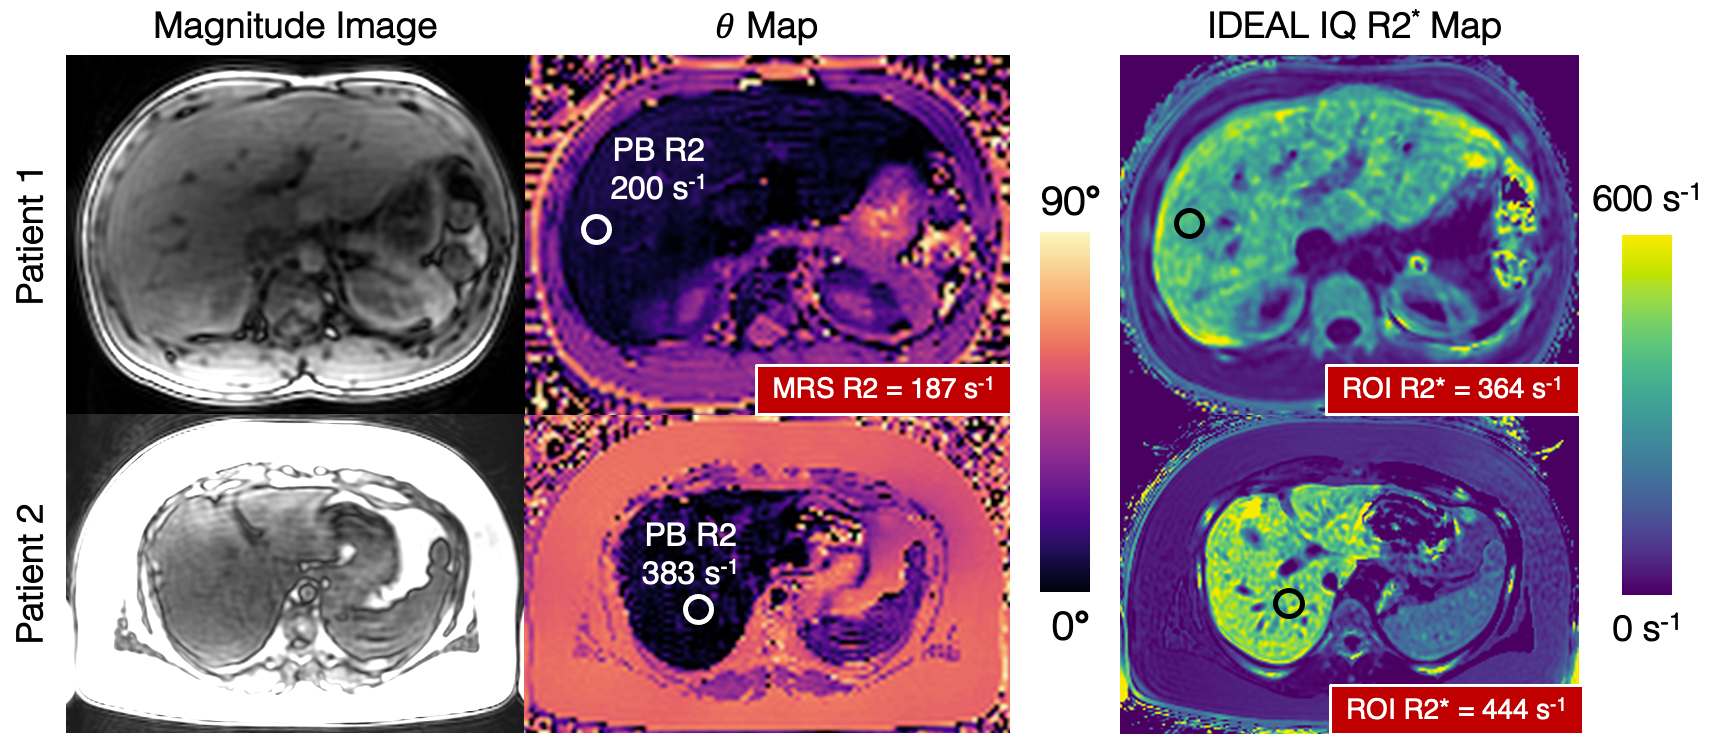
Figure
4. Iron overload patient studies demonstrate diagnostic image quality using the
phase-based R2 mapping method. PB R2 maps are not shown because of the
necessity of “average first, fit second” in high R2 livers (Figure 3). IDEAL IQ
R2* maps are shown for reference. An ROI drawn in the liver of the phase-based θ map corresponds to high PB R2 values for the two patients. Multi-TE STEAM-MRS
was acquired at approximately the same location as the ROI. For patient 2, MRS
R2 estimation failed due to incorrect placement of the STEAM voxel. Note that
the magnitude images still have good SNR.
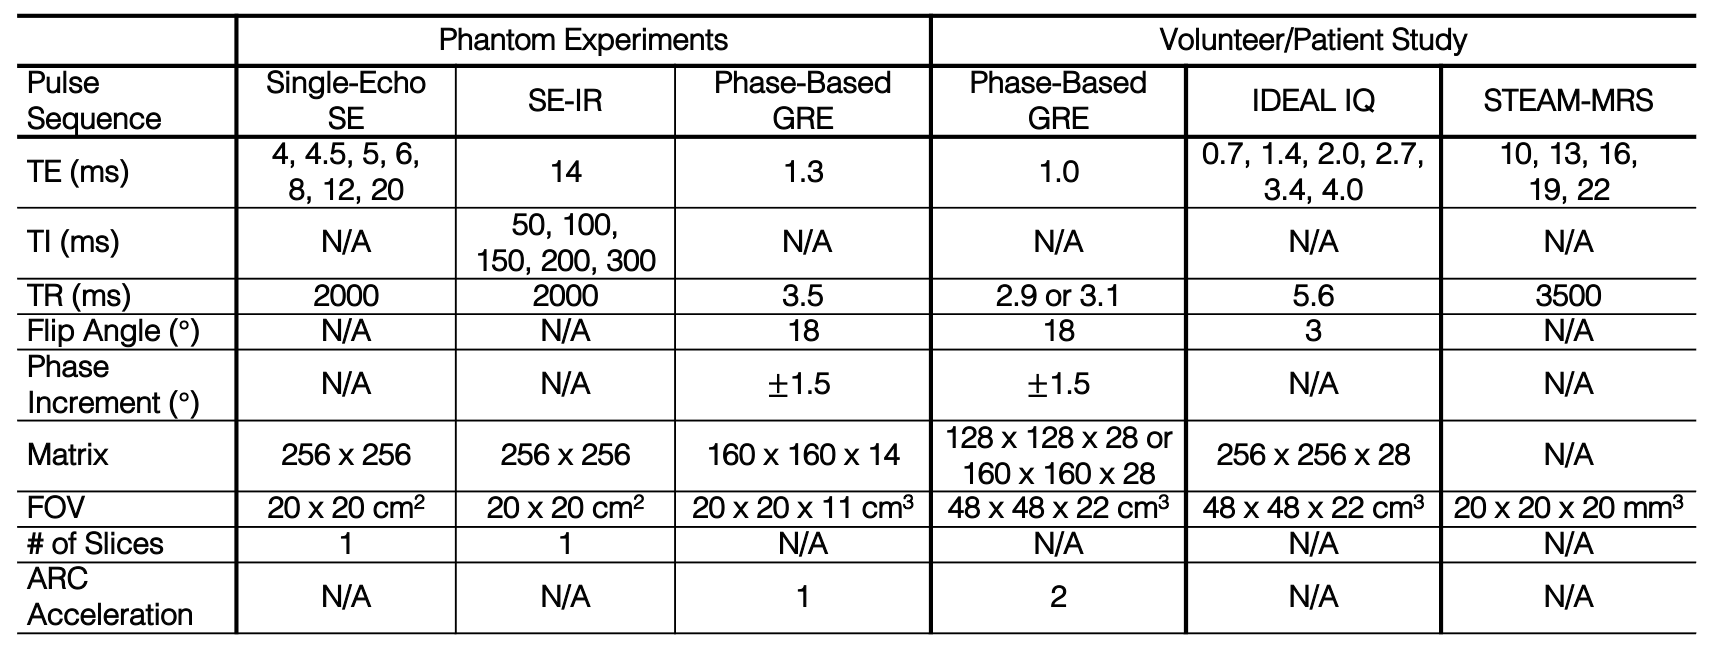
Table 1. Acquisition parameters for the
phantom experiments and volunteer/patient study. All acquisitions were
performed at 3.0T. A low resolution (128 x 128) phase-based GRE was acquired to
achieve a very short TR (2.9 ms) for very high R2 mapping3 seen in patients if needed.
DOI: https://doi.org/10.58530/2022/3364