3356
Aberrant Structural Brain Network Hierarchy in Trigeminal neuralgia1Icahn School of Medicine at Mount Sinai, New York, NY, United States
Synopsis
Trigeminal neuralgia (TN) is a physically and mentally incapacitating disorder characterized by extreme, sporadic, sudden facial pain. TN is associated with the trigeminal sensory pathway, however, the etiology of TN remains unclear. Implementing a graph-theory analysis using diffusion MRI we tested whether whole brain network structural connectivity hierarchies differentiate between TN patients and healthy controls. We found aberrant centrality measures of various brain regions in TN. Specifically, this whole-brain data-driven network analysis was able to depict two major regions of the trigeminal sensory circuit, the brainstem and thalamus, and highlight their dysfunction role in the whole brain network.
INTRODUCTION
Trigeminal neuralgia (TN) is a physically and mentally incapacitating disorder characterized by extreme, sporadic, sudden facial pain1. Although clearly associated with the trigeminal sensory pathway, the etiology of TN remains unclear. Classical TN is conventionally attributed to neurovascular compression (NVC). In addition to NVC, TN may be caused by inflammatory lesions or demyelination, infarctions, tumors, injury, and potentially other undiscovered causes2. The insult may lie anywhere along the trigeminal sensory pathway, including the trigeminal nerve and ganglion, spinal trigeminal nucleus pars caudalis within the brainstem, thalamus, somatosensory cortex, or the white matter tracts connecting these areas3. Structural alterations in the whole-brain networks have been largely understudied in the context of TN. Standard MRI protocols at conventional field strengths currently lack the sensitivity required to identify the true cause of pain. MRI at ultra-high 7Tesla (7T) MRI provides increased signal to noiseratio, yielding images with exquisite resolution that can reveal subtle microstructural alterations4. In order to examine the whole brain high resolution structural network organization, we applied a graph theoretical approach5. We hypothesized that the structural brain network features will distinguish between TNpatients and healthy controls (HC).METHODS
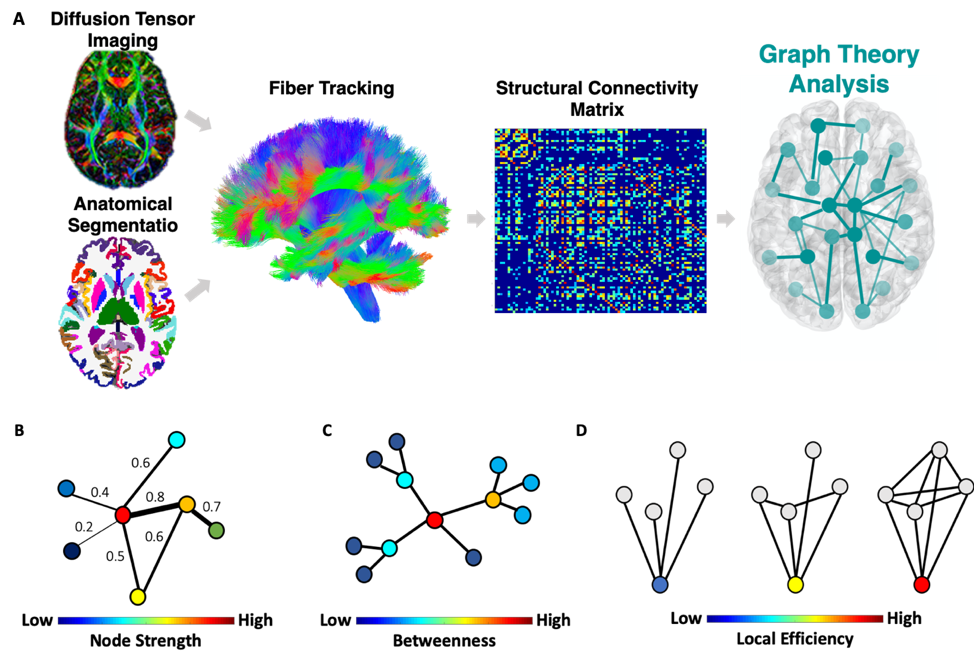
Data were acquired on a Siemens Magnetom 7T MRI scanner (Erlangen, Germany). 13 TN patients and 13 age and gender matched HC underwent Diffusion weighted imaging (DWI). DWI images were preprocessed using MRtrix3. Each subject’s anatomical T1-weighted image was segmented into Desikan-Killiany Atlas6 using FreeSurfer v.6.0 and co-registered into the DWI space to construct the structural connectome. Each of the segmented 84 regions of interest (ROIs) represents a node in the graph. The structural network edges (links) are defined by the streamline count between any pairwise ROIs derived from diffusion probabilistic tractography7 (Figure 1A). To enable comparison across participants, we used a sparsity threshold S, which retains S% of the top connections for each participant. Using the Brain Connectivity Toolbox8, we examined common local nodal centrality features; 1) node strength, which is the sum of weights of connections to the node (Figure 1B); 2) betweenness centrality, which is a measure of the number of shortest paths that traverse a given node (Figure 1C); and 3) local efficiency, which is the efficiency computed on the neighbors of a given node (Figure 1D). We examined the network features across a range of thresholds (10% < S < 30% in steps of 1%)7. We then calculated the area under the curve for each network feature, which provides a summarized measure independent of single threshold selection7. Finally, we conducted a between-group t-test for each region's local feature.RESULTS
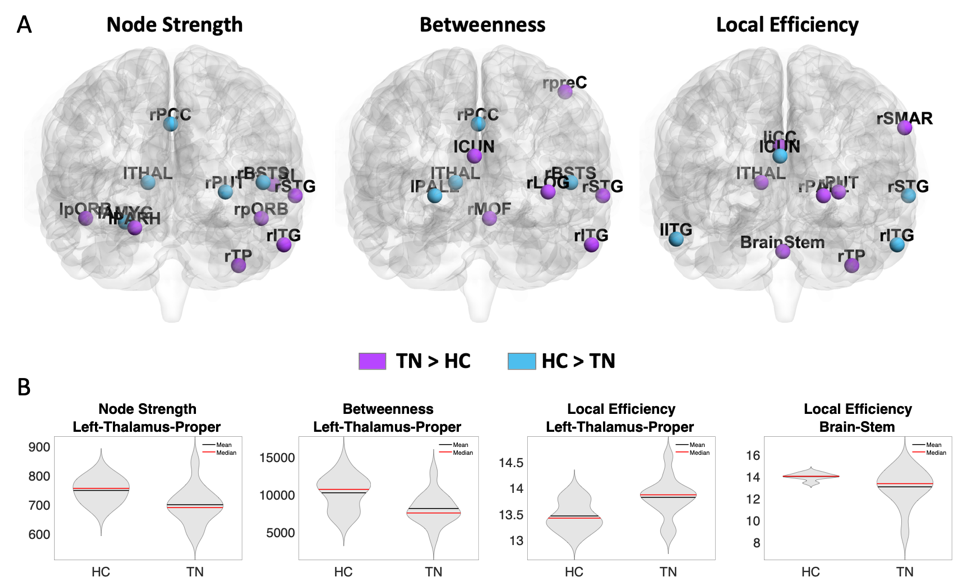
The results revealed aberrant centrality measures of various regions in TN compared to HC (Figure 2A). Specifically, the left thalamus, a region in the trigeminal sensory pathway, was found to exhibit abnormal criticality among the TN patients in all three centrality measures as measured by its lower node strength (t(24)=-2.46, p<0.03, Cohen’s d = 1.1), lower betweenness centrality (t(24)=-2.59, p<0.02, Cohen’s d = 0.97) and higher local efficiency (t(24)=2.76, p<0.02, Cohen’s d = 1.1). The brainstem, which is another trigeminal sensory pathway region, exhibit lower local efficiency (t(24)=-2.15, p<0.05, Cohen’s d = 0.8) among TN patients (Figure 2B).DISCUSSION
The structural connectomic network analysis revealed several aberrant centrality measures among TN patients compared to HC. Importantly, this whole-brain data driven analysis found two major regions of the trigeminal sensory pathway to have aberrant connectivity among TN patients. TN is most prominently associated with NVC, whereby a vessel compresses the trigeminal nerve at its brainstem entry zone, resulting in nerve sheath degradation8. Beyond NVC, the trigeminal sensory pathway includes neurons in the brainstem nuclei receiving afferents from CNV which then project, via the ventral trigeminothalamic tract to the contralateral thalamus, that in turn project to the somatosensory cortex9,10. Here, we found that TN patients exhibited lower left thalamus centrality measures both in the node strength and betweenness centrality suggesting its decreased connectivity to the rest of the brain. The local efficiency of the left thalamus on the other hand, was found to be higher indicating its neighbors are highly connected, suggesting a network compensation mechanism to overcome its decreased connectivity. The brainstem however, showed reduced local efficiency, indicating its criticality in the whole brain network and the lack of network’s resistance to its failure. These results are in line with the known critical role of the brainstem and previous studies showing contralateral thalamus atrophy and its reduced connectivity to the somatosensory cortex in TN10,11.CONCLUSION
In conclusion, our results highlight the brainstem and thalamus decreased connectivity and critical role in the whole brain network among TN patients. The network hierarchy and specifically the role of the thalamus and brainstem within the structural brain network might serve as quantitative TN markers, which may greatly impact TN understanding.Acknowledgements
Funding was provided by NIH R01 CA202911
References
- Trigeminal Neuralgia Fact Sheet | National Institute of Neurological Disorders and Stroke [Internet]. [cited2020 Jul 27].
- Kontzialis, M. & Kocak, M. Imaging evaluation of trigeminal neuralgia. Journal of Istanbul University Faculty of Dentistry 51, S62 (2017).
- Bista, P. & Imlach, W. L. Pathological mechanisms and therapeutic targets for trigeminal neuropathic pain. Medicines 6, 91 (2019).
- Balchandani, P. & Naidich, T. Ultra-high-field MR neuroimaging. American Journal of Neuroradiology 36, 1204-1215 (2015).
- Sporns, O. Networks of the Brain. (MIT press, 2010).
- Desikan, R. S. et al. An automated labeling system for subdividing the human cerebral cortex on MRI scans into gyral based regions of interest. Neuroimage 31, 968-980, doi:10.1016/j.neuroimage.2006.01.021 (2006).
- Jacob, Y. et al. Neural correlates of rumination in major depressive disorder: A brain network analysis. NeuroImage: Clinical 25, 102142, doi:https://doi.org/10.1016/j.nicl.2019.102142 (2020).
- DeSouza, D. D. Structural abnormalities and treatmentrelated plasticity in classical trigeminal neuralgia. (University of Toronto (Canada), 2015).
- Mistry, A. M. et al. Neurovascular compression at the root entry zone correlates with trigeminal neuralgia and early microvascular decompression outcome. World neurosurgery 95, 208-213 (2016).
- Rutland, J. W. et al. First application of 7-T ultra–high field diffusion tensor imaging to detect altered microstructure of thalamic-somatosensory anatomy in trigeminal neuralgia. Journal of neurosurgery 133, 839-847 (2019).
- Danyluk, H. et al. The Thalamus in Trigeminal Neuralgia: Structural and Metabolic Abnormalities, and Influence on Surgical Response (2021).
Figures