3354
Comparison of high-resolution quantitative peripheral nerve imaging in CMT1A and healthy controls using Double-Echo in Steady-State at 7 Tesla
Bragi Sveinsson1,2, Robert Barry1,2,3, Olivia Rowe1,2, Jason Stockmann1,2, Daniel Park1, Peter Lally4, Matthew S Rosen1,2,5, and Reza Sadjadi6
1Radiology, A. A. Martinos Center, Massachusetts General Hospital, Boston, MA, United States, 2Radiology, Harvard Medical School, Boston, MA, United States, 3Harvard-MIT Health Sciences and Technology, Cambridge, MA, United States, 4Brain Sciences, Imperial College London, London, United Kingdom, 5Physics, Harvard University, Cambridge, MA, United States, 6Neurology, Massachusetts General Hospital, Boston, MA, United States
1Radiology, A. A. Martinos Center, Massachusetts General Hospital, Boston, MA, United States, 2Radiology, Harvard Medical School, Boston, MA, United States, 3Harvard-MIT Health Sciences and Technology, Cambridge, MA, United States, 4Brain Sciences, Imperial College London, London, United Kingdom, 5Physics, Harvard University, Cambridge, MA, United States, 6Neurology, Massachusetts General Hospital, Boston, MA, United States
Synopsis
The ability to estimate neurological disease progression based on objective quantitative measurements could be of great value for assessing treatment efficacy. Here, we demonstrate the feasibility of acquiring high-resolution anatomic and quantitative images at 7T in the sciatic, tibial, and fibular nerves, allowing quantitative assessment of individual fascicles. We also measure the quantities of fascicle cross-sectional area, T2, ADC, and fat fraction for CMT1A patients and healthy controls and investigate any between-group differences.
Introduction
Quantitative MRI, measuring tissue parameters such as T2, diffusivity, and fat fraction, can complement conventional anatomical MR images in radiological assessment by providing quantitative biomarkers to monitor disease severity and progression. Applied in the peripheral nervous system, such biomarkers could potentially allow more effective evaluation of treatment efficacy in nerve diseases such as Charcot-Marie-Tooth Type 1A (CMT1A) syndrome. Obtaining such information at high resolution with a single scan sequence could provide a powerful tool for assessing nerve disease while retaining a simple workflow. In this work, we demonstrate the feasibility of using the Double-Echo in Steady-State (DESS) sequence for high-resolution anatomic imaging at 7 Tesla with an in-plane resolution of under 0.15 mm, while also obtaining quantitative maps of T2, the apparent diffusion coefficient (ADC), and fat fraction. Furthermore, we compare the resulting measurements in patients with CMT1A neurological disease to age- and biological sex-matched healthy controls.Methods
Axial 3D DESS scans were acquired in the lower right thigh of 6 CMT1A subjects (2M/4F) and 6 healthy controls, individually biological sex- and age-matched to the patients (having the same age within a margin of +/-5 years). The scans were performed at a field strength of 7 Tesla (Terra, Siemens Healthineers USA) with a 28-channel knee coil (QED), with scan parameters as shown in Figure 1. In the DESS sequence, two echoes are acquired before and after a spoiler gradient, as shown in Figure 21,2. The first echo has T1/T2 contrast while the second echo predominantly has a T2 contrast and diffusion contrast if the spoiler gradient moment is large enough to act as a diffusion gradient. We ran the sequence three times, each time acquiring and reconstructing both echoes as two separate images: First, it was run with a small-moment spoiler gradient that gave minimal diffusion contrast. By comparing the relative intensities of the two echoes to numerical signal models, a T2 estimate was obtained3. Fat was suppressed by using a water-selective binomial pulse. Next, the sequence was run again with a large spoiler gradient moment. Comparing the results to the low-moment signals gave an ADC estimate3. Finally, the sequence was run again but with a fat-selective binomial pulse. Comparing the results to the first scan gave a fat fraction estimate. This fat fraction measurement was not performed in two of the patients due to time constraints. In the quantitative maps of T2, ADC, and fat fraction thus obtained, regions of interest (ROI) were drawn in each nerve fascicle in the sciatic nerve in a slice just above its bifurcation, and in the tibial and fibular nerves in a slice 1 cm below the bifurcation, and the measurements in each ROI recorded. Fat shift was corrected in post-processing by shifting the resulting image to match the water-based image. Statistical significance was estimated with two-sided t-tests with α = 0.05.Results
Sample images from a healthy control are shown in Figure 3. Individual fascicles are clearly visible, and maps of their T2, ADC, and fat fraction values can be easily assessed. Figure 4 shows the results for the two different populations. The cross-sectional area, T2, ADC, and fat fraction have been measured in each fascicle and the results averaged for each patient and each control. Figure 5 further summarizes this data, showing the mean values in the sciatic, tibial, and fibular nerves in all fascicles of all patients and controls. The cross-sectional area, T2, and ADC were all visually observed to be higher in patients than in healthy controls, although only the cross-sectional area was measured to have a statistically significant difference, with p < 0.005 in the sciatic and fibular nerves and p < 0.01 in the tibial nerve. A difference in the fat fraction was not observed.Discussion
The results demonstrate the feasibility of acquiring high-SNR anatomic and quantitative images in peripheral nerves at below 0.15 mm in-plane resolution using the DESS sequence. Further, the results indicate a larger cross-sectional area, T2, and ADC in the fascicles of CMT1A subjects compared to healthy controls, which is in agreement with prior studies4,5. The lack of observed differences in fat fraction could be an artifact of the small patient population for this parameter (4 patients) and needs to be studied further.Conclusion
The DESS sequence can be used to obtain high-resolution anatomic and quantitative images of peripheral nerves at 7T, yielding measurements that can potentially help differentiate between nerves in CMT1A patients and healthy nerves.Acknowledgements
Imaging was performed at the Athinoula A. Martinos Center for Biomedical Imaging at the Massachusetts General Hospital using resources provided by the Center for Functional Neuroimaging Technologies (P41EB015896) and the Center for Mesoscale Mapping (P41EB030006), Biotechnology Resource Grants supported by the National Institute of Biomedical Imaging and Bioengineering, National Institutes of Health (NIH). The NIH also provided support through grants K99AG066815, R01EB027779, R01EB028797, and S10OD023637. This research was also supported in part by the MGH/HST Athinoula A. Martinos Center for Biomedical Imaging. Siemens Healthineers provided technical support.References
[1] Bruder MRM 1988; [2] Redpath MRM 1988; [3] Staroswiecki MRM 2012; [4] Vaeggemose Muscle and Nerve 2017; [5] Maeda Muscle and Nerve 2021Figures
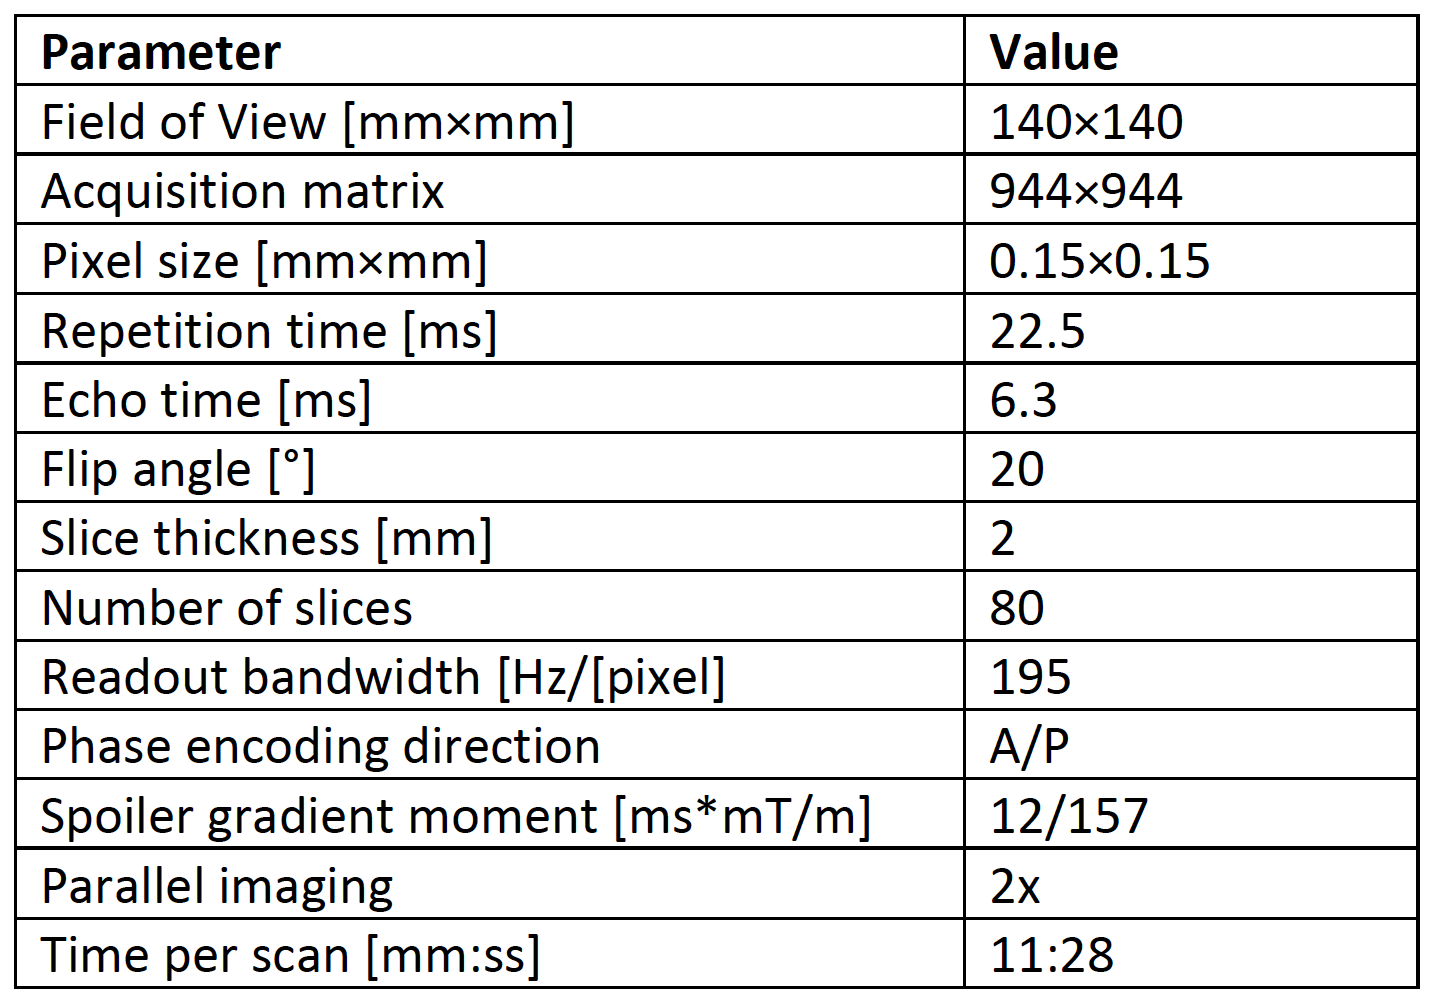
Figure 1: Table of scan parameters

Figure 2: Sequence diagram for the DESS sequence. During each repetition time, signals S1 and S2 are collected before and after a spoiler gradient of duration τ, respectively. If the gradient has a large moment with amplitude GH then S2 will have T2 and diffusion weighting, if it has a small moment with amplitude GL, S2 will primarily have T2 weighting. The radiofrequency pulses, giving a flip angle of α, use a spectral-spatial excitation for water or fat imaging.
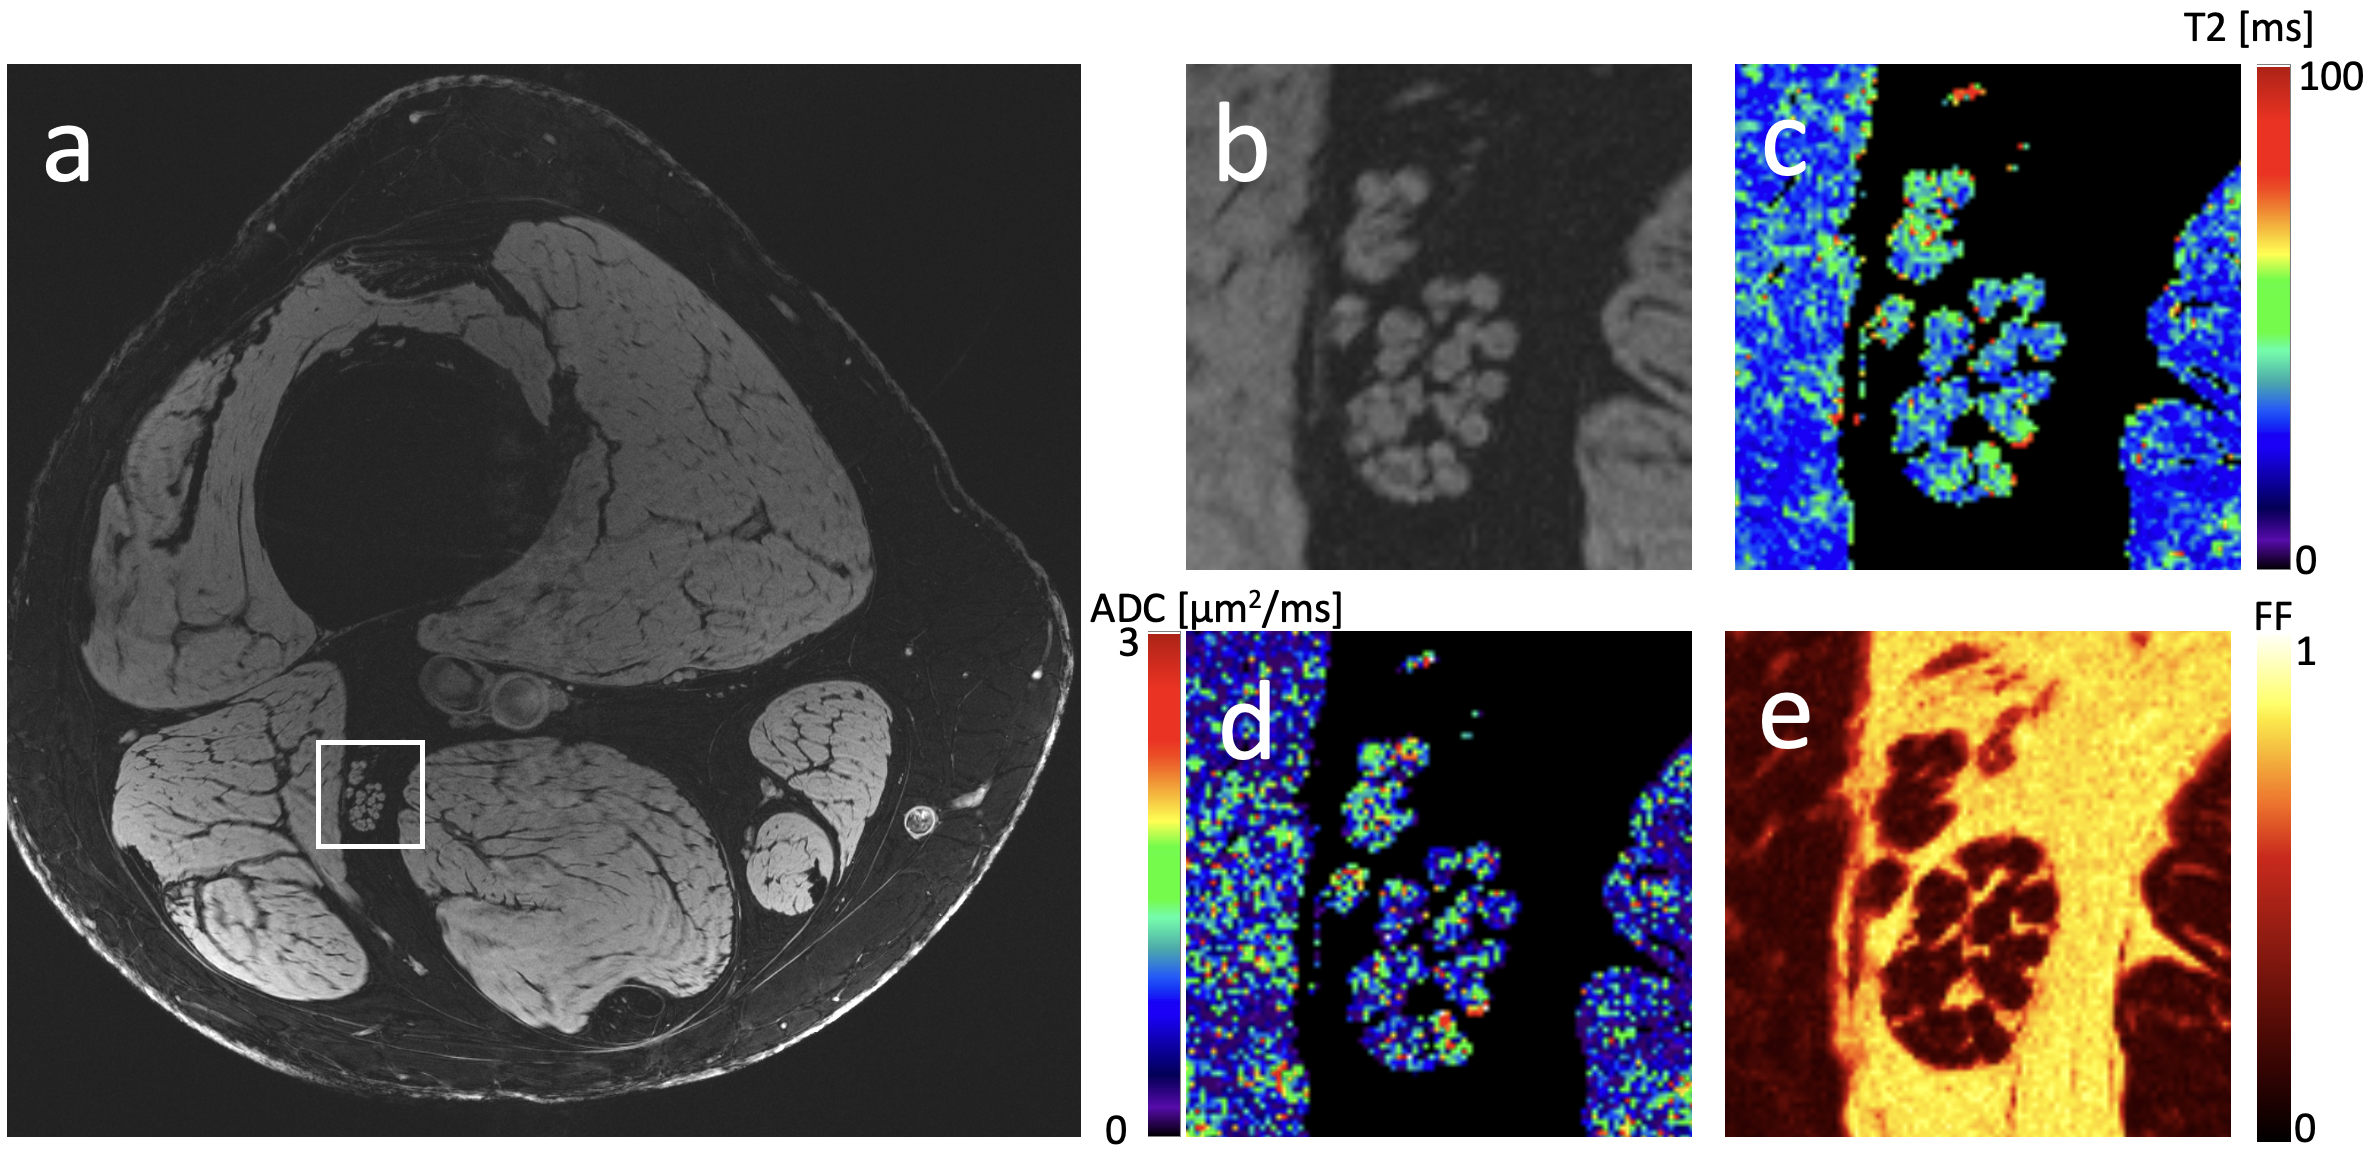
Figure 3: (a) Axial image of lower thigh in healthy control, imaged at 7T. (b) Zoomed-in view of region marked in panel a, focusing on the sciatic nerve. (c) T2 map of zoomed-in region. (d) ADC map of zoomed-in region. (e) Fat fraction map of zoomed-in region.
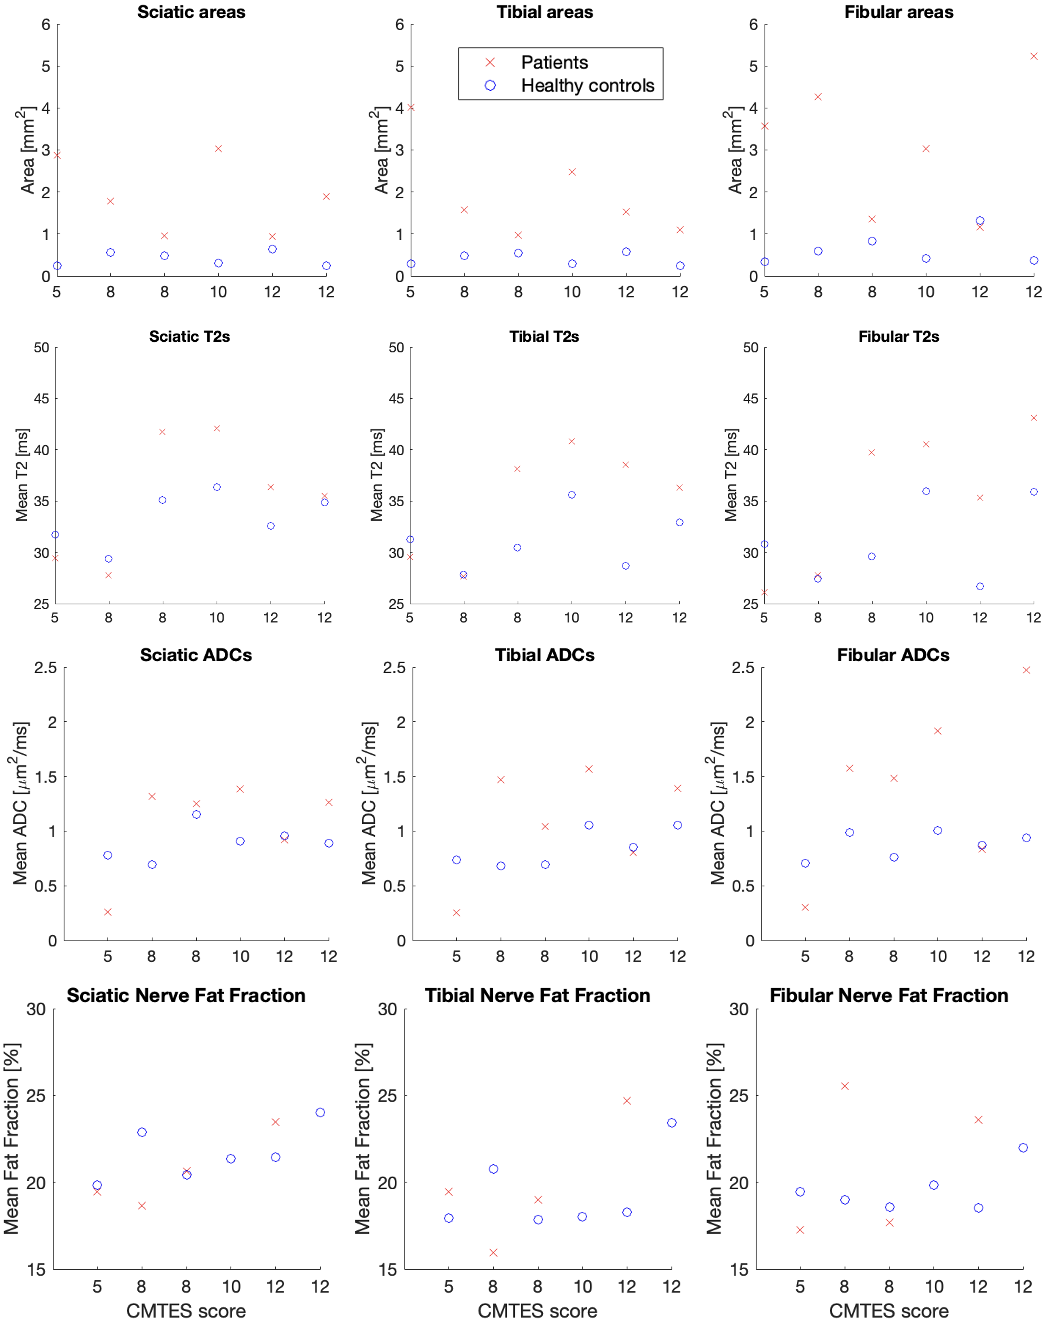
Figure 4: Mean cross-sectional fascicle areas (top row), T2s (2nd row), ADCs (3rd row), and fat fraction (bottom) in sciatic (left column), tibial (middle column), and fibular (right column) nerves in the patients (red crosses) and their controls (blue circles). The x-axis shows the CMTES score of the respective patient. The values are obtained by calculating the measurements for each fascicle in the nerve and averaging the results for each subject. Note that the fat fraction was not measured in two of the patients, but the values for their corresponding healthy controls are still shown.
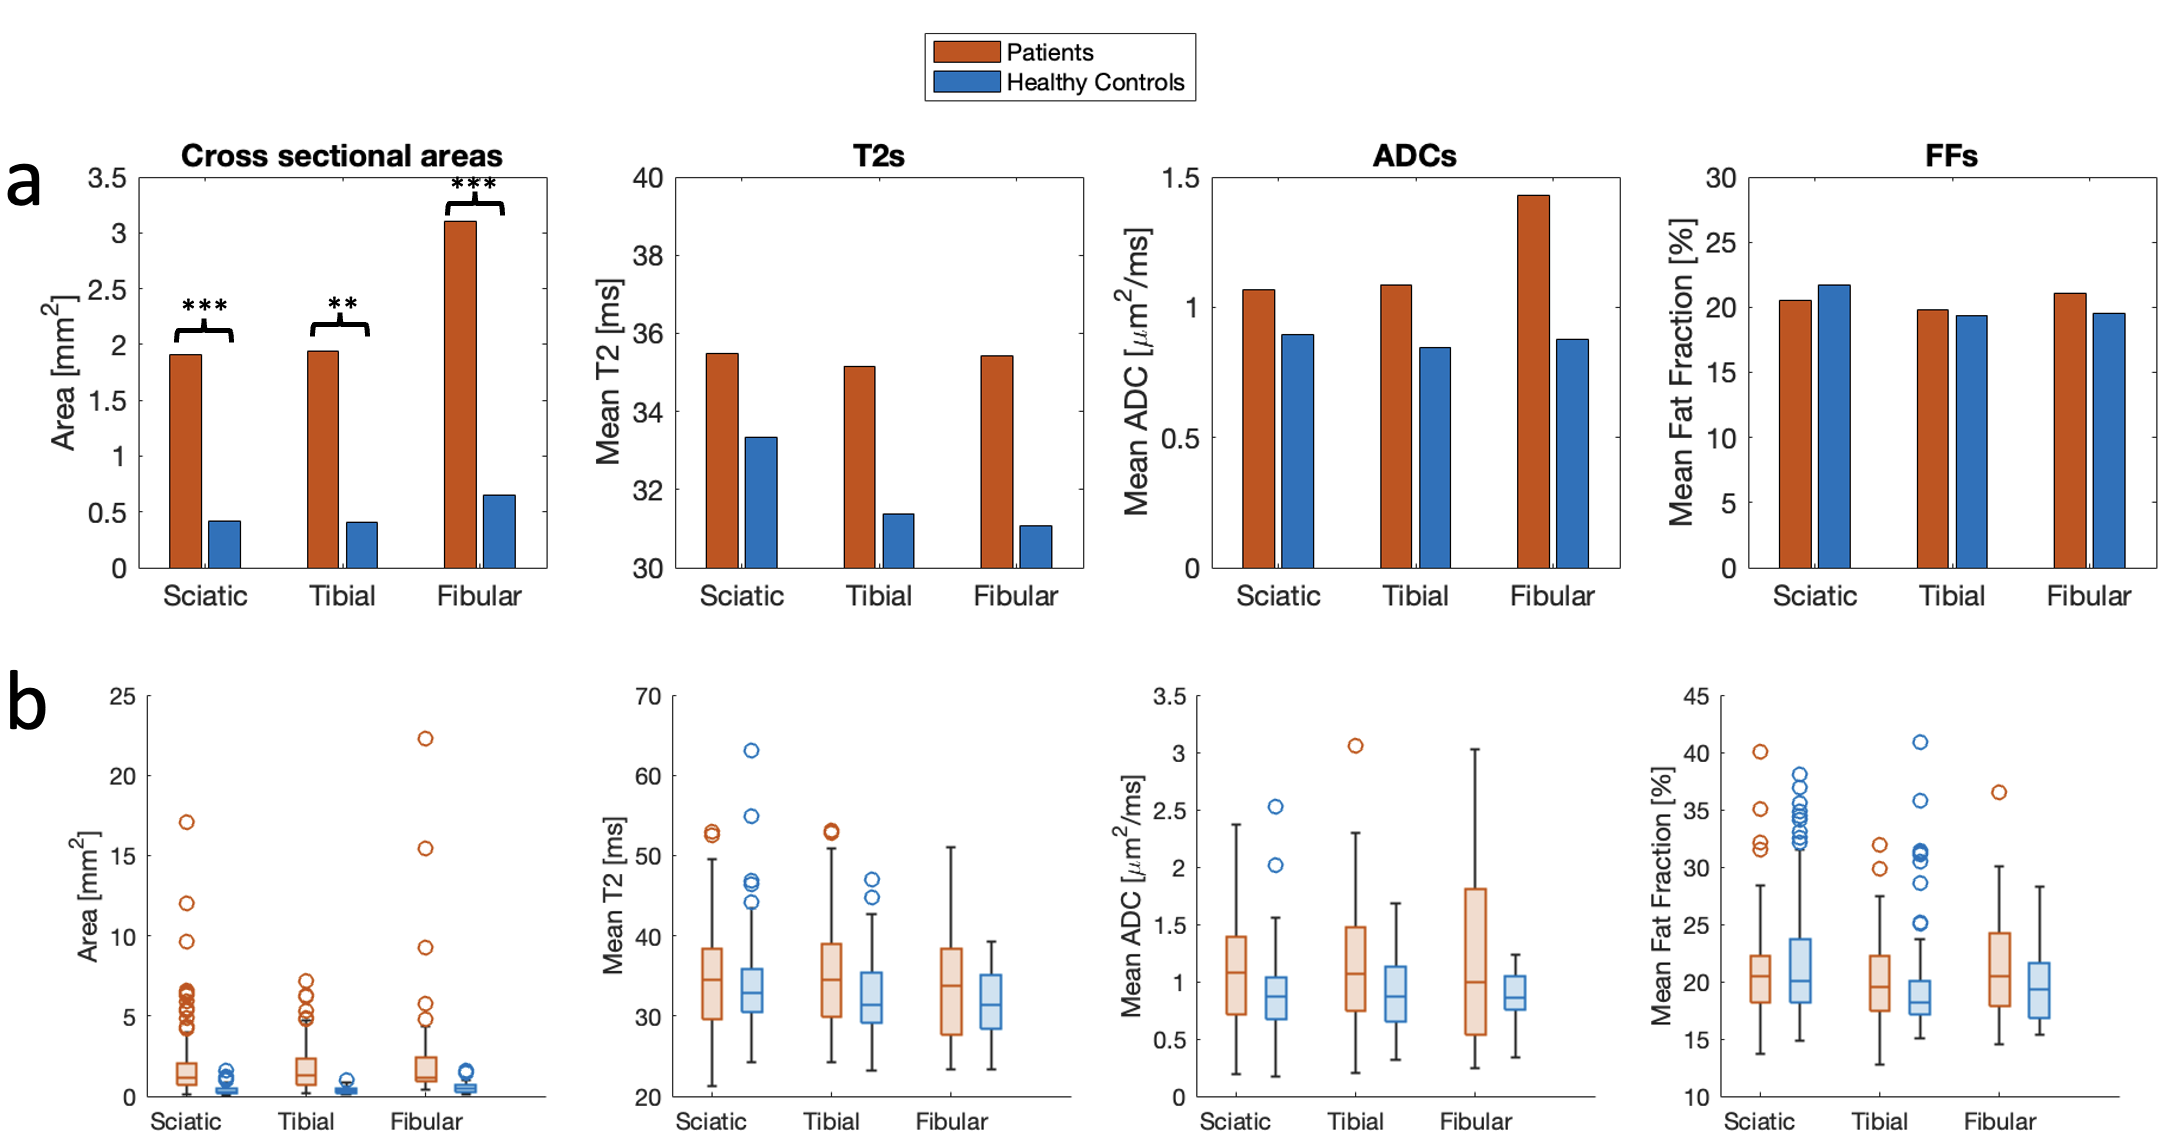
Figure 5: (a) The averages of the measured parameters (cross-sectional areas, T2, ADC, and Fat Fraction) in all patients (red columns) and controls (blue columns). (b) Box plots showing the same data, showing median, 1st and 3rd quartile, outliers, and minimum and maximum values not classified as outliers.
DOI: https://doi.org/10.58530/2022/3354