3352
Quantitative magnetic resonance imaging combined with three-dimensional image analysis in glioblastoma1Radiology, Charité - Universitätsmedizin Berlin, Berlin, Germany, 2Neurosurgery, Charité - Universitätsmedizin Berlin, Berlin, Germany, 3Neuroradiology, Charité - Universitätsmedizin Berlin, Berlin, Germany
Synopsis
Conventional MRI such as T2 and FLAIR do not show sub-regional intensity changes in peritumoral infiltration zone of glioblastoma and cannot visualize tumor margins. Here, we implemented a new method for sub-volumetric analysis of glioblastoma and investigated T1 and T2 relaxation properties in the peritumoral infiltration zone. The results show a decrease in T1 and T2 relaxation times as a function of distance from the contrast-enhanced T1 solid tumor region to the periphery. Our method may help to better select regions for biopsy, to determine the surgical resection margin and improve radiation therapy planning and post-therapeutic progress controls.
Introduction
Glioblastoma (GBM) is one of the most common and deadly brain tumors with a mean life expectancy of only 12-15 months. Its main hallmarks are infiltrative growth and lack of clear tumor boundaries [1]. Conventional MRI such as T1, T2 and FLAIR do not show sub-regional intensity changes in peritumoral infiltration zone (PI), making the definition of tumor volume for surgical resection and radiation therapy challenging. Recently, it has been shown that T1 and T2 relaxometry can reveal distinct sub-regional differences which can be correlated with tumor cell density of the infiltration zone [2,3,4,5,6]. However, during a conventional clinical MRI acquisition around two hundred slices of two-dimensional (2D) images are produced per modality to represent the three-dimensional (3D) brain volume. When multimodal dataset is acquired, manual segmentation and quantitative analysis become time-consuming tasks. Therefore, in the majority of cases only a couple of 2D slices are manually segmented and quantitatively analyzed, which cannot depict the imaging characteristics of the entire tumor volume and are highly influenced by the selected slice positions. The aims of this study are (i) to implement a new machine learning based segmentation method for volumetric analysis of GBM and combine it with high spatial resolution quantitative MRI and (ii) to test if T1 and T2 mapping show sub-volumetric changes around the tumor core.Methods
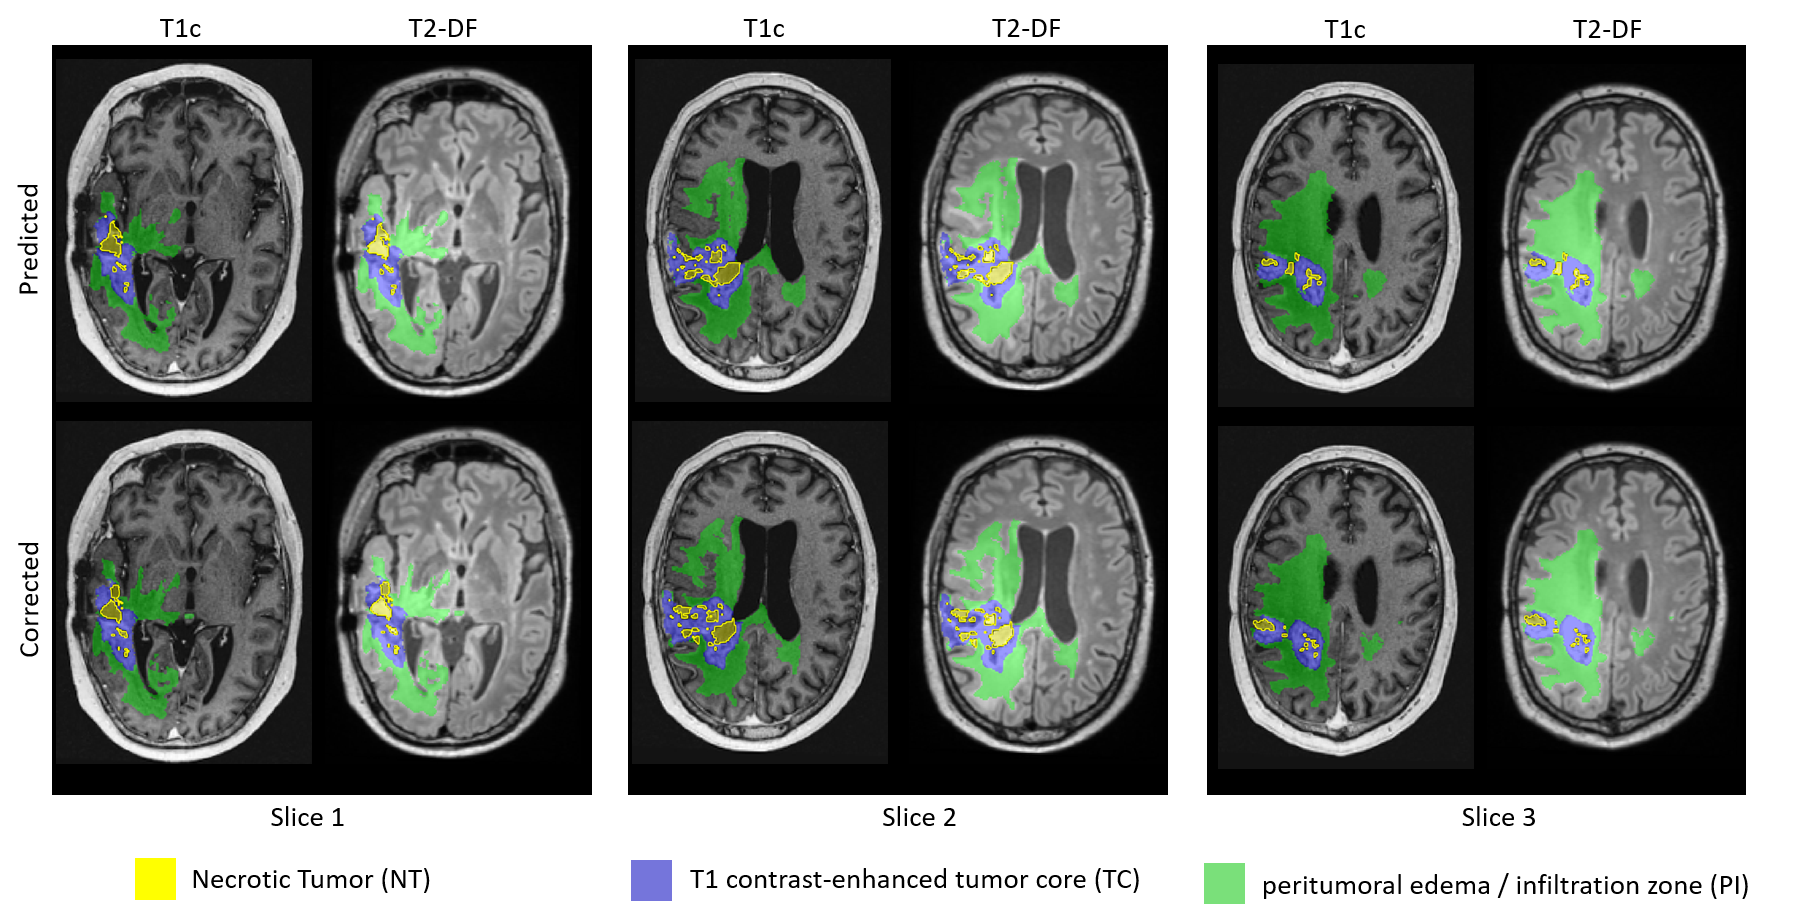
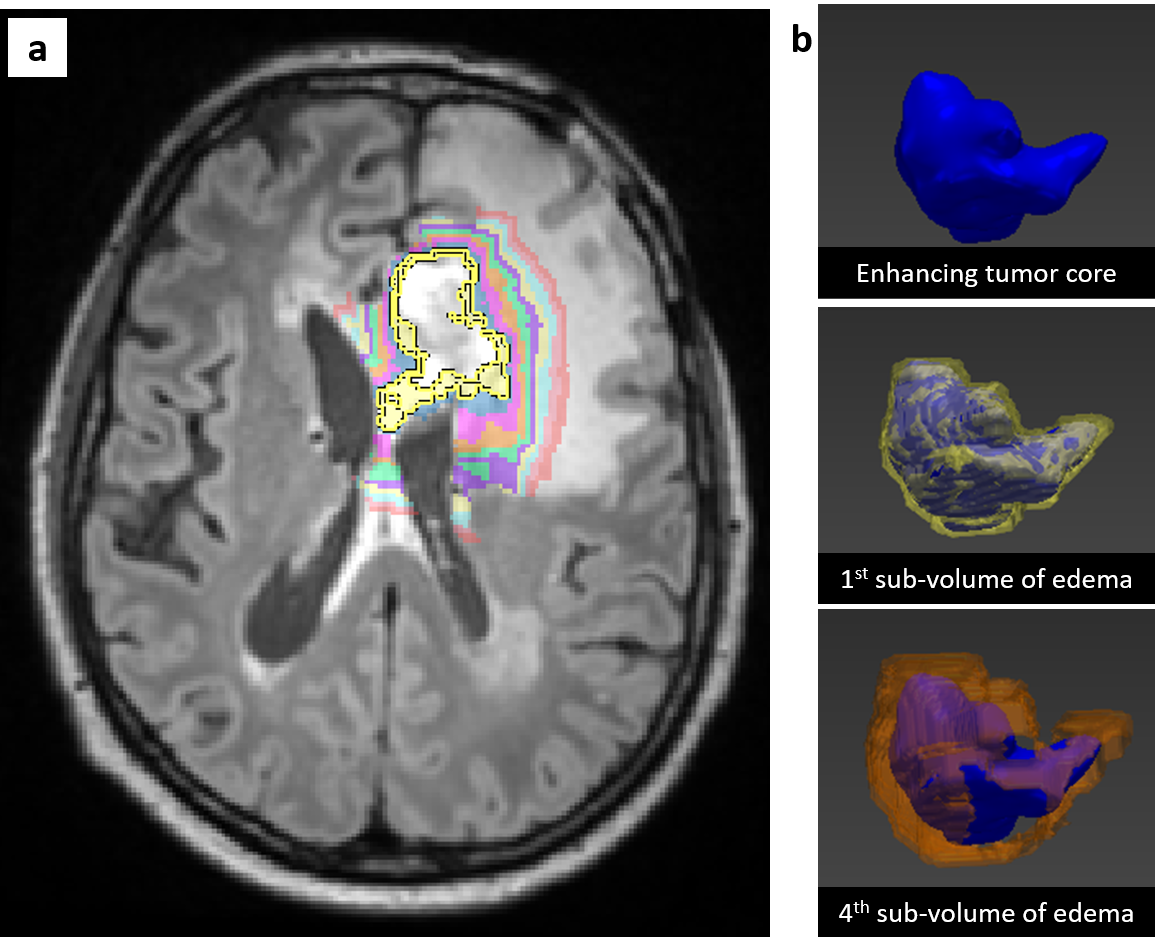
Six patients with recurrent GBMs were investigated. The study protocol (ethical application number EA1/306/16) conforms to the ethical guidelines of the 1975 Declaration of Helsinki. MRI was performed on a 3 Tesla scanner (Vida; Siemens, Erlangen, Germany) using a 32-channel head coil (Siemens, Erlangen, Germany). The clinical protocol consisted of pre-contrast transversal 2D works-in-progress (WIP, Siemens, Erlangen, Germany) GRAPPATINI T2 map with corresponding conventional T2, a 3D T2 dark fluid (T2-DF) and a post-contrast 3D (WIP) MP2RAGE T1 map with corresponding post contrast T1 (T1c). Our new approach consisted of five steps: 1) image resampling and registration, 2) skull stripping, 3) GBM segmentation, 4) division of PI into concentric sub-volumes around the contrast-enhanced T1 tumor core and 5) statistical analysis of the volumes. All images were resampled to a uniform 256×256×220 matrix size and 1mm isotropic resolution and co-registered to the T1c volume by Nibabel3.2 [7]. Skull-striping was done automatically before segmentation by a self-trained standard U-Net model [8]. GBM was segmented into enhancing T1 tumor core (TC), non-enhancing necrotic tumor (NT) and peritumoral infiltration zone (PI) by a modified version of the U-Net model. The model was self-trained on transversal images in a slice-wise fashion in 2D using three contrasts for each slice position: T1c, T2-DF and T2. After automatic segmentation, the created segments were corrected by an experienced neuro-radiologist. At the end, the whole PI was divided into 10 concentric one-pixel-width sub-volumes around the tumor core using a self-implemented discrete 3D region growth algorithm.Results
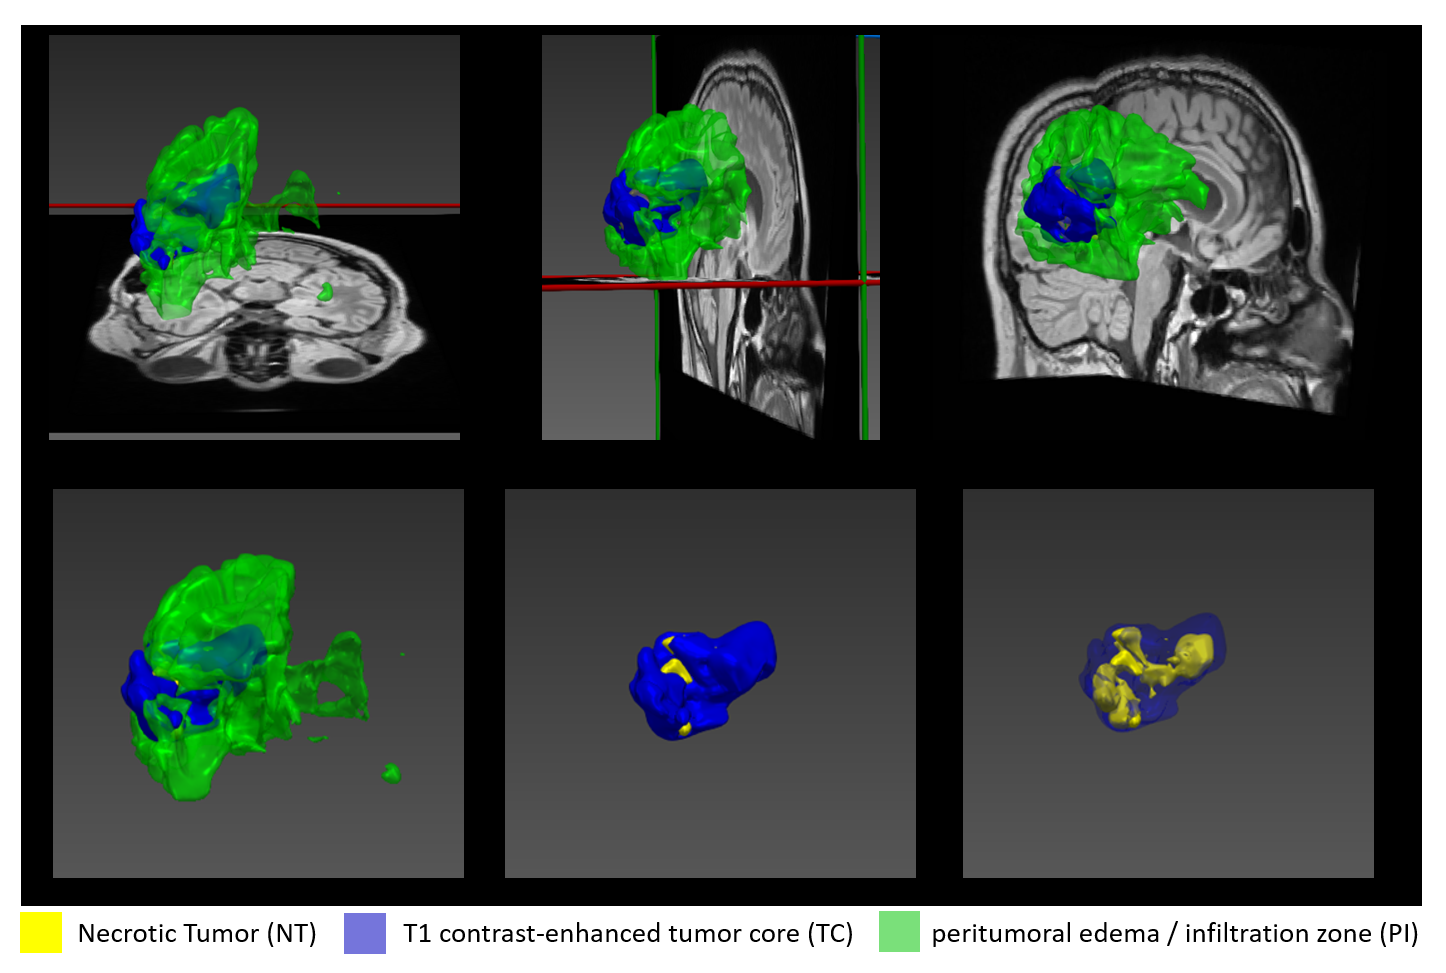
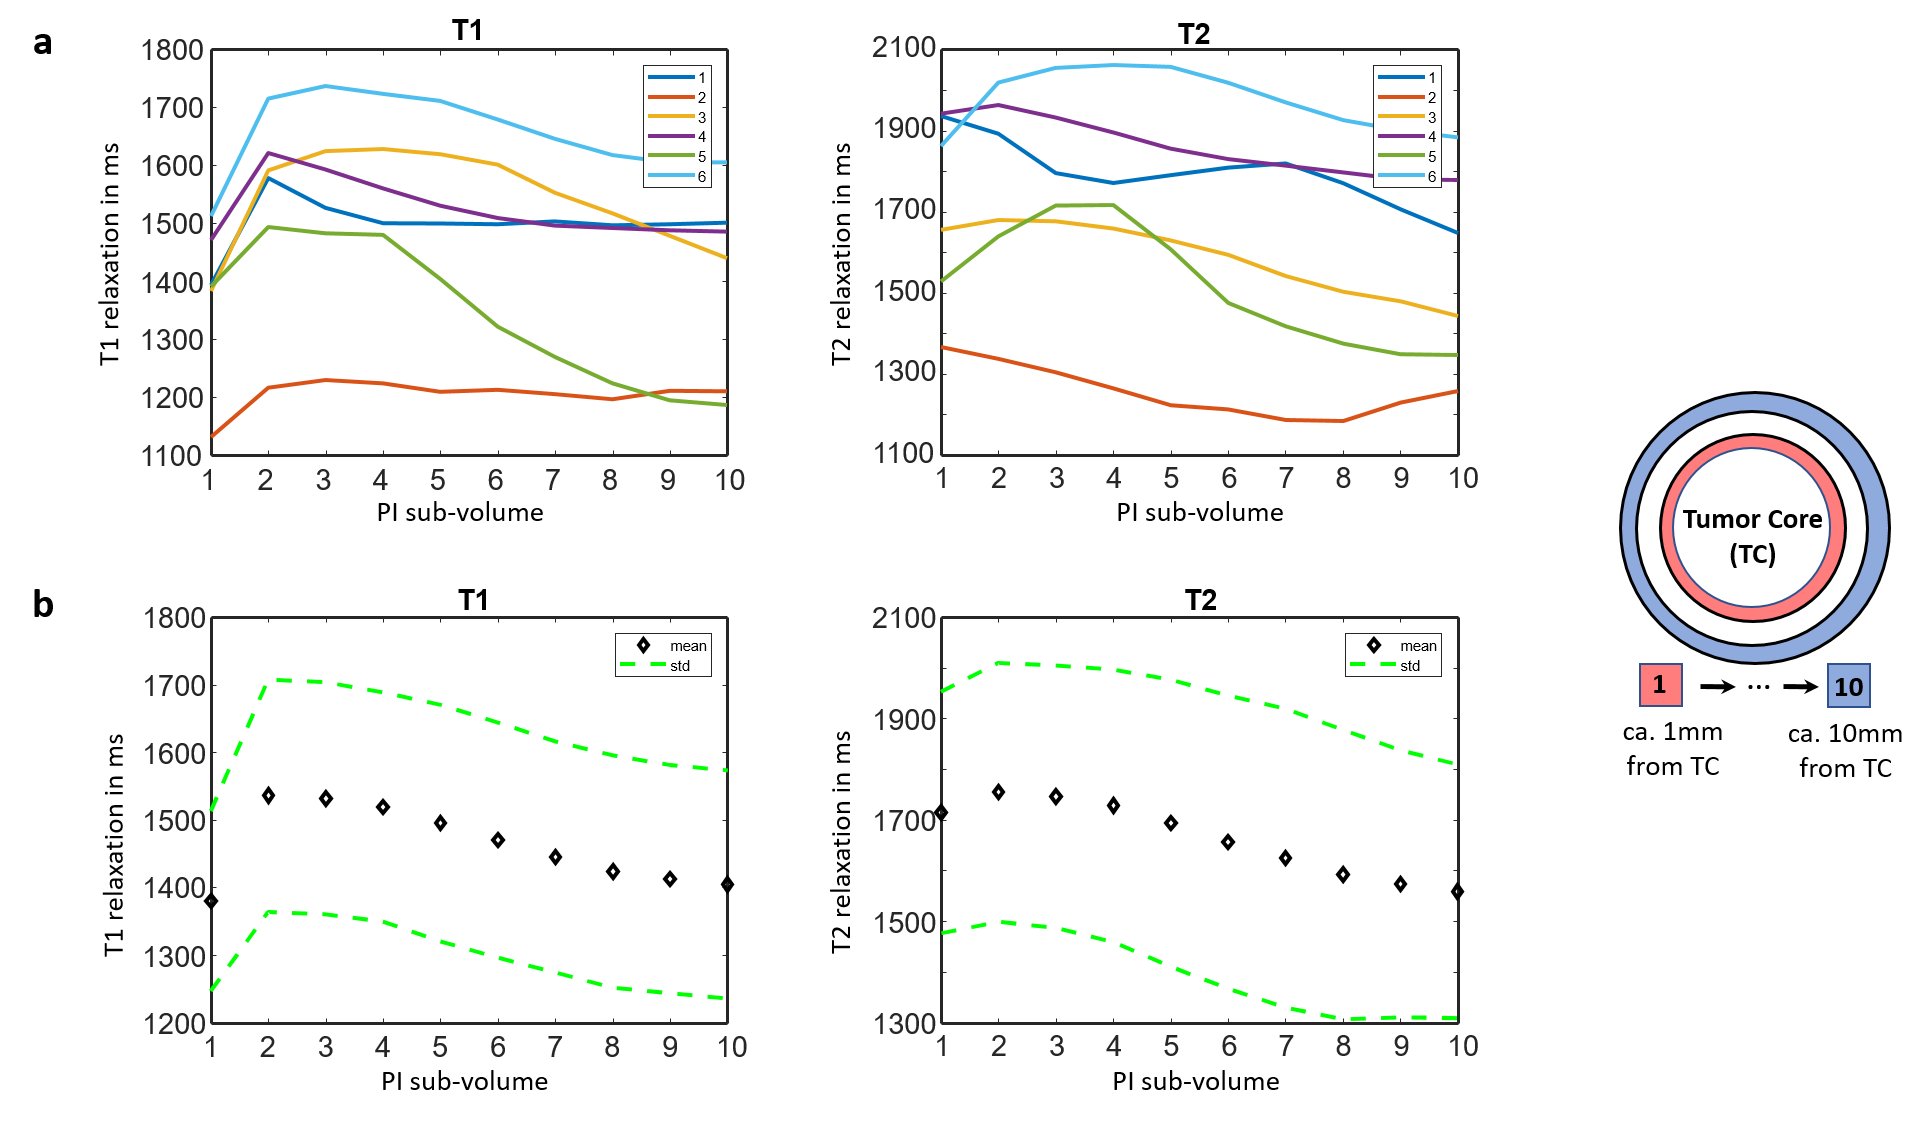
Figure 1 shows example images of our clinical protocol from one patient. Figure 2 shows generated and corrected tumor segments overlaid on T1c and T2-DF for the slice positions showed in Figure 1. Corresponding 3D segments of TC, NT and PI for the entire tumor volume are shown in Figure 3. Figure 4a shows on a 2D transversal slice examples of ten generated, one-pixel-width sub-regions of PI, concentrated around the tumor core with increasing distance from it. Figure 4b shows the entire volume of TC and the corresponding first and fourth concentric sub-volumes of PI in 3D. Figure 5a shows volumetric T1 and T2 relaxation times in the generated sub-volumes of PI in six patients, while Figure 5b shows the corresponding group mean values. Within ca. 10mm from TC (from 2nd to 10th sub-volume), T1 and T2 relaxation times decreased by 9.3% (T1: 2nd sub-volume 1536ms vs. 10th sub-volume 1405ms) and 12.6% (T2: 2nd sub-volume 1755ms vs. 10th sub-volume 1559ms), respectively.Discussion
To our knowledge, this is the first 3D volumetric evaluation of T1 and T2 relaxation times in peritumoral infiltration zone. We found significant decrease in T1 and T2 relaxation times from the neighboring to the peripheral edema regions of GBM. Peritumoral edema in GBM is a mixture of healthy brain parenchyma and tumor cell infiltration zone [9,10]. Edema is mainly caused by vascularization, micro-necrosis, angiogenesis and apoptosis, effects which are higher in the close proximity of the tumor core than at greater distance from it [9,10]. The decay of T1 and T2 relaxation values from tumor core toward the edema periphery might be accountable for changes in tumor cell density and corresponding alteration of the extracellular matrix [3,4,6], as GBM always shows an infiltrative growth and tumor cell migration from the inside out [9,10].Conclusion
Volumetric 3D analysis of T1 and T2 relaxation times reveals marked differences in the sub-volumes of peritumoral infiltration zone around the contrast-enhanced T1 tumor region in glioblastomas, indicating tissue alteration due to tumor cell migration that can be detected by quantitative MRI. The method presented here may help to better select regions for biopsy prior to surgical resection and to better plan the resection margin and radiation therapy field.Acknowledgements
Works-in-progress (WIP, Siemens, Erlangen, Germany) sequences (GRAPPATINI T2 mapping and compressed sensing MP2RAGE) from Siemens Healthineers, which made time-efficient measurements of T1 and T2 mapping in clinical setup possible, are gratefully acknowledged.References
1. Delgado-López PD, Corrales-García EM. Survival in glioblastoma: a review on the impact of treatment modalities. Clin Transl Oncol. 2016;18(11):1062-1071.
2. Nöth U, Tichy J, Tritt S, Bähr O, Deichmann R, Hattingen E. Quantitative T1 mapping indicates tumor infiltration beyond the enhancing part of glioblastomas. NMR Biomed. 2020;33(3):e4242.
3. Kern M, Auer TA, Picht T, Misch M, Wiener E. T2 mapping of molecular subtypes of WHO grade II/III gliomas. BMC Neurol. 2020;20(1):8.
4. Auer TA, Kern M, Fehrenbach U, Tanyldizi Y, Misch M, Wiener E. T2 mapping of the peritumoral infiltration zone of glioblastoma and anaplastic astrocytoma. Neuroradiol J. 2021;34(5):392-400.
5. Blystad I, Warntjes JBM, Smedby Ö, Lundberg P, Larsson EM, Tisell A. Quantitative MRI for analysis of peritumoral edema in malignant gliomas. PLoS One. 2017;12(5):e0177135.
6. Blystad I, Warntjes JBM, Smedby Ö, Lundberg P, Larsson EM, Tisell A. Quantitative MRI using relaxometry in malignant gliomas detects contrast enhancement in peritumoral oedema. Sci Rep. 2020;10(1):17986.
7. Matthew Brett (MB), Chris Markiewicz (CM), Michael Hanke (MH), Marc-Alexandre Côté (MC), Ben Cipollini (BC), Paul McCarthy (PM), Chris Cheng (CC), Yaroslav Halchenko (YOH), Satra Ghosh (SG), Eric Larson (EL), Demian Wassermann, Stephan Gerhard and Ross Markello (RM): NiBabel; https: www.nipy.org/nibabel/
8. Ronneberger, Olaf; Fischer, Philipp; Brox, Thomas (2015). "U-Net: Convolutional Networks for Biomedical Image Segmentation". arXiv:1505.04597
9. Urbańska K, Sokołowska J, Szmidt M, Sysa P. Glioblastoma multiforme - an overview. Contemp Oncol (Pozn). 2014;18(5):307-312.
10. Chang PD, Malone HR, Bowden SG, et al. A Multiparametric Model for Mapping Cellularity in Glioblastoma Using Radiographically Localized Biopsies. AJNR Am J Neuroradiol. 2017;38(5):890-898.
Figures