3349
Brain functional connectivity in schizophrenia: disrupted network dynamics revealed by fMRI1Instituto Superior Técnico, University of Lisbon, Lisbon, Portugal, 2Department of Mathematics and CEMAT, Instituto Superior Técnico, University of Lisbon, Lisbon, Portugal, 3Life and Health Sciences Research Institute, School of Medicine, University of Minho, Braga, Portugal, 4Centre for Eudaimonia and Human Flourishing, Linacre College, University of Oxford, Oxford, United Kingdom, 5Center for Music in the Brain, Department of Clinical Medicine, Aarhus University, Aarhus, Denmark
Synopsis
We investigate differences between the dynamic exploration of resting-state functional connectivity (FC) states using fMRI data from 71 schizophrenia (SZ) patients and 74 healthy controls (HCs) by employing the Leading Eigenvector Dynamics Analysis (LEiDA) method to provide potential biomarkers of this disorder. We found a reduced ability of SZ patients to access and remain in a state of global BOLD phase coherence. Functionally meaningful states presented increased occurrence, limiting probability and altered dynamic transitions in SZ patients. These findings expose pronounced differences between SZ patients and HCs - supporting and developing current knowledge regarding disrupted brain dynamics in schizophrenia.
Introduction
Resting-state fMRI data can be used to characterise brain activity as the time-resolved emergence and dissolution of functionally meaningful networks, i.e., the constant reconfiguration of resting-state functional connectivity (FC) patterns or states over time 1. The characterisation of these resting-state networks (RSNs) in the temporal domain could provide potential biomarkers of schizophrenia (SZ) 2,3 - a chronic brain disorder typified by disruption to thought processes, perception, cognition and behaviours, for which there is still a lack of biomarkers. Most research on dynamic functional connectivity (dFC) in SZ has been carried out using independent component analysis to extract time courses of networks which were subsequently used to estimate dFC through sliding-window analysis (SWA) 3,4. However, the choice of the window length affects the temporal resolution of the SWA approach - raising questions over its validity 2,3. In this study, to overcome this weakness, the Leading Eigenvector Dynamics Analysis (LEiDA) method, based on Blood Oxygenation Level Dependent (BOLD) phase coherence, is used to investigate dFC at an instantaneous level 5.Methods
Data was obtained from the open-source repository 6. The acquisition and preprocessing of the data are fully described in 6. This study analysed preprocessed resting-state fMRI data from 71 SZ patients and 74 healthy controls (HCs) featuring 150 EPI BOLD volumes obtained in 5 minutes with TR=2s (no spatial smoothing, temporal filtering and nuisance regression were performed).For each subject, the entire brain was parcellated using the AAL template 7 - resulting in a $$$\small{90\times148}$$$ BOLD dataset (first and last TR of each scan excluded as in 8). The dFC for each subject was a three-dimensional tensor with dimension $$$\small{90\times90\times148}$$$ which represented the phase coherence between each pair of AAL regions at each TR. The LEiDA method 5 was employed - considering only the leading eigenvector $$$\small{V_{1}(t)}$$$ of each $$$\small{dFC(t)}$$$ matrix. To identify recurrent FC states, the dataset of $$$\small{148\times145}$$$ leading eigenvectors was clustered by applying the $$$\small{K}$$$-means and $$$\small{K}$$$-medoids algorithms 9 with $$$\small{K}$$$ ranging between 2 and 20. For each clustering solution and participant, the set of $$$\small{K}$$$ FC states defined a temporal state trajectory - representing each $$$\small{V_{1}(t)}$$$ by the FC state (centroid) of the cluster to which it was assigned by the clustering algorithm. The state trajectories were dynamically characterised by estimating the fractional occupancy, dwell time, limiting probability of each state and the state-to-state transition probabilities.
Intergroup comparisons of the estimated group mean of the properties derived from the state trajectories were performed using Monte Carlo permutation tests 10 by adapting the procedure used by 5,11,12.
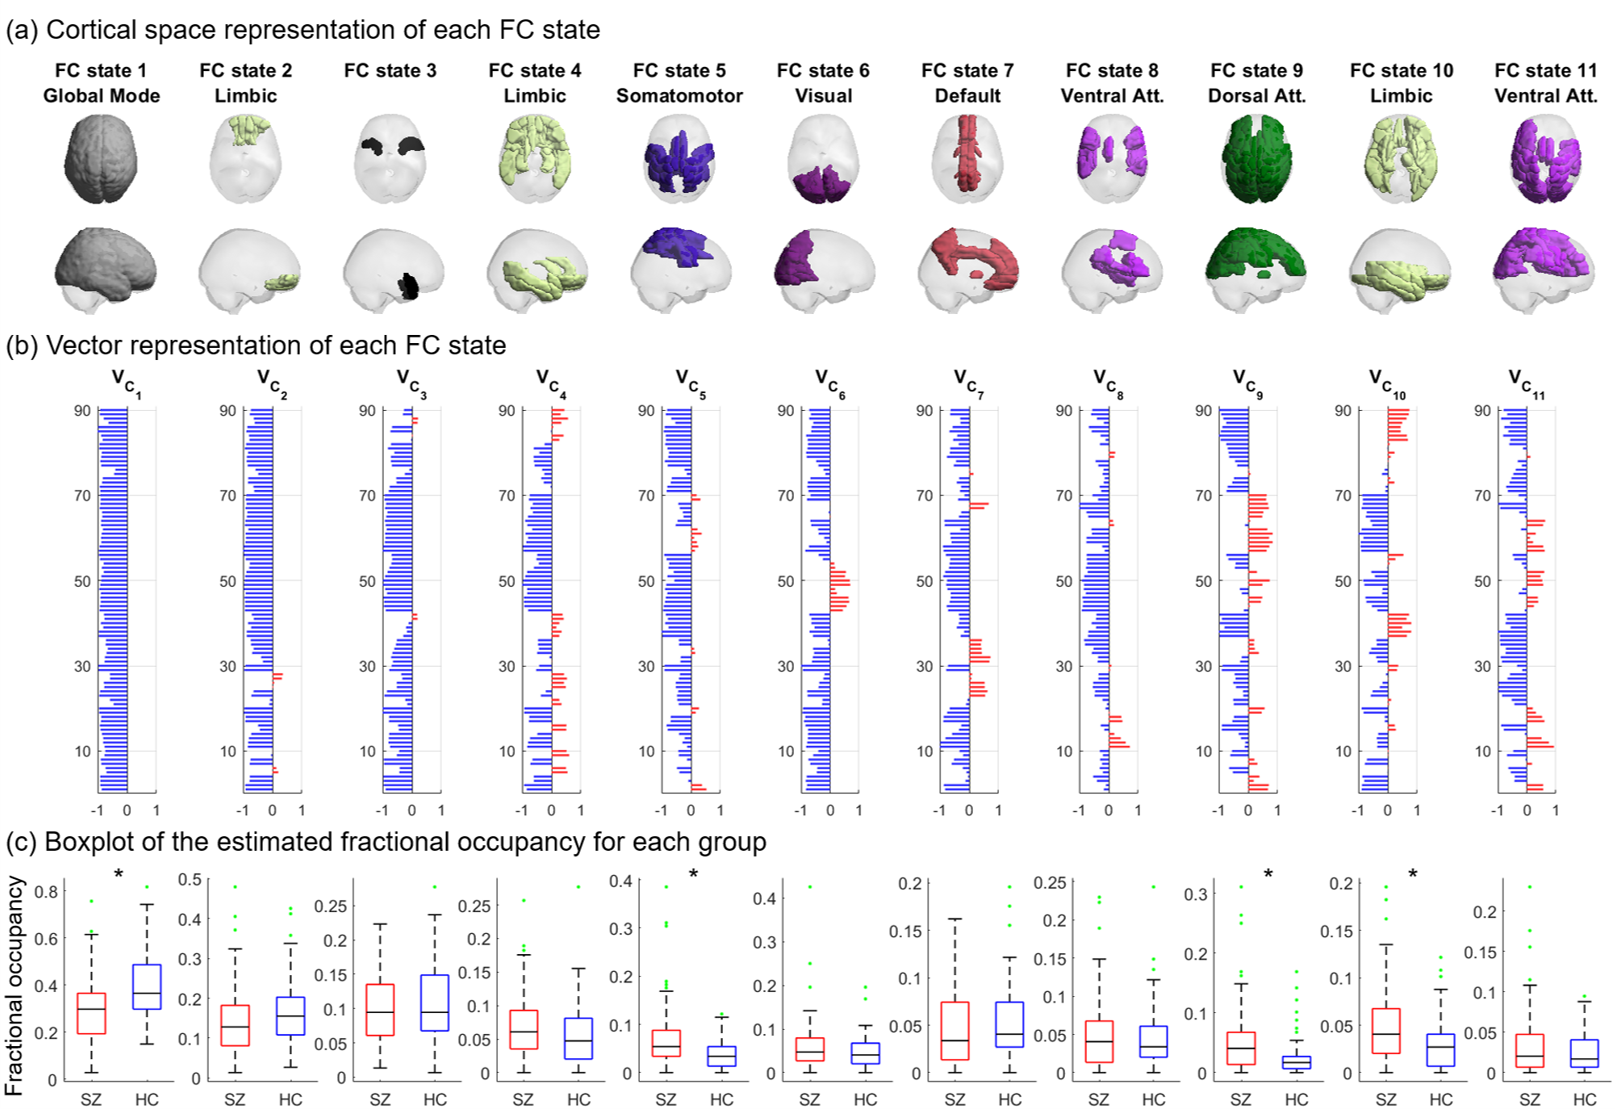
The functional relevance of the estimated FC states was investigated by computing the Pearson's correlation between the FC states and the AAL representation of 7 reference RSNs defined by 13 as in 8,12.
The selection of an optimal clustering solution was based upon the ability to differentiate groups and the quality 9 and stability 14 of the clustering results.
Results
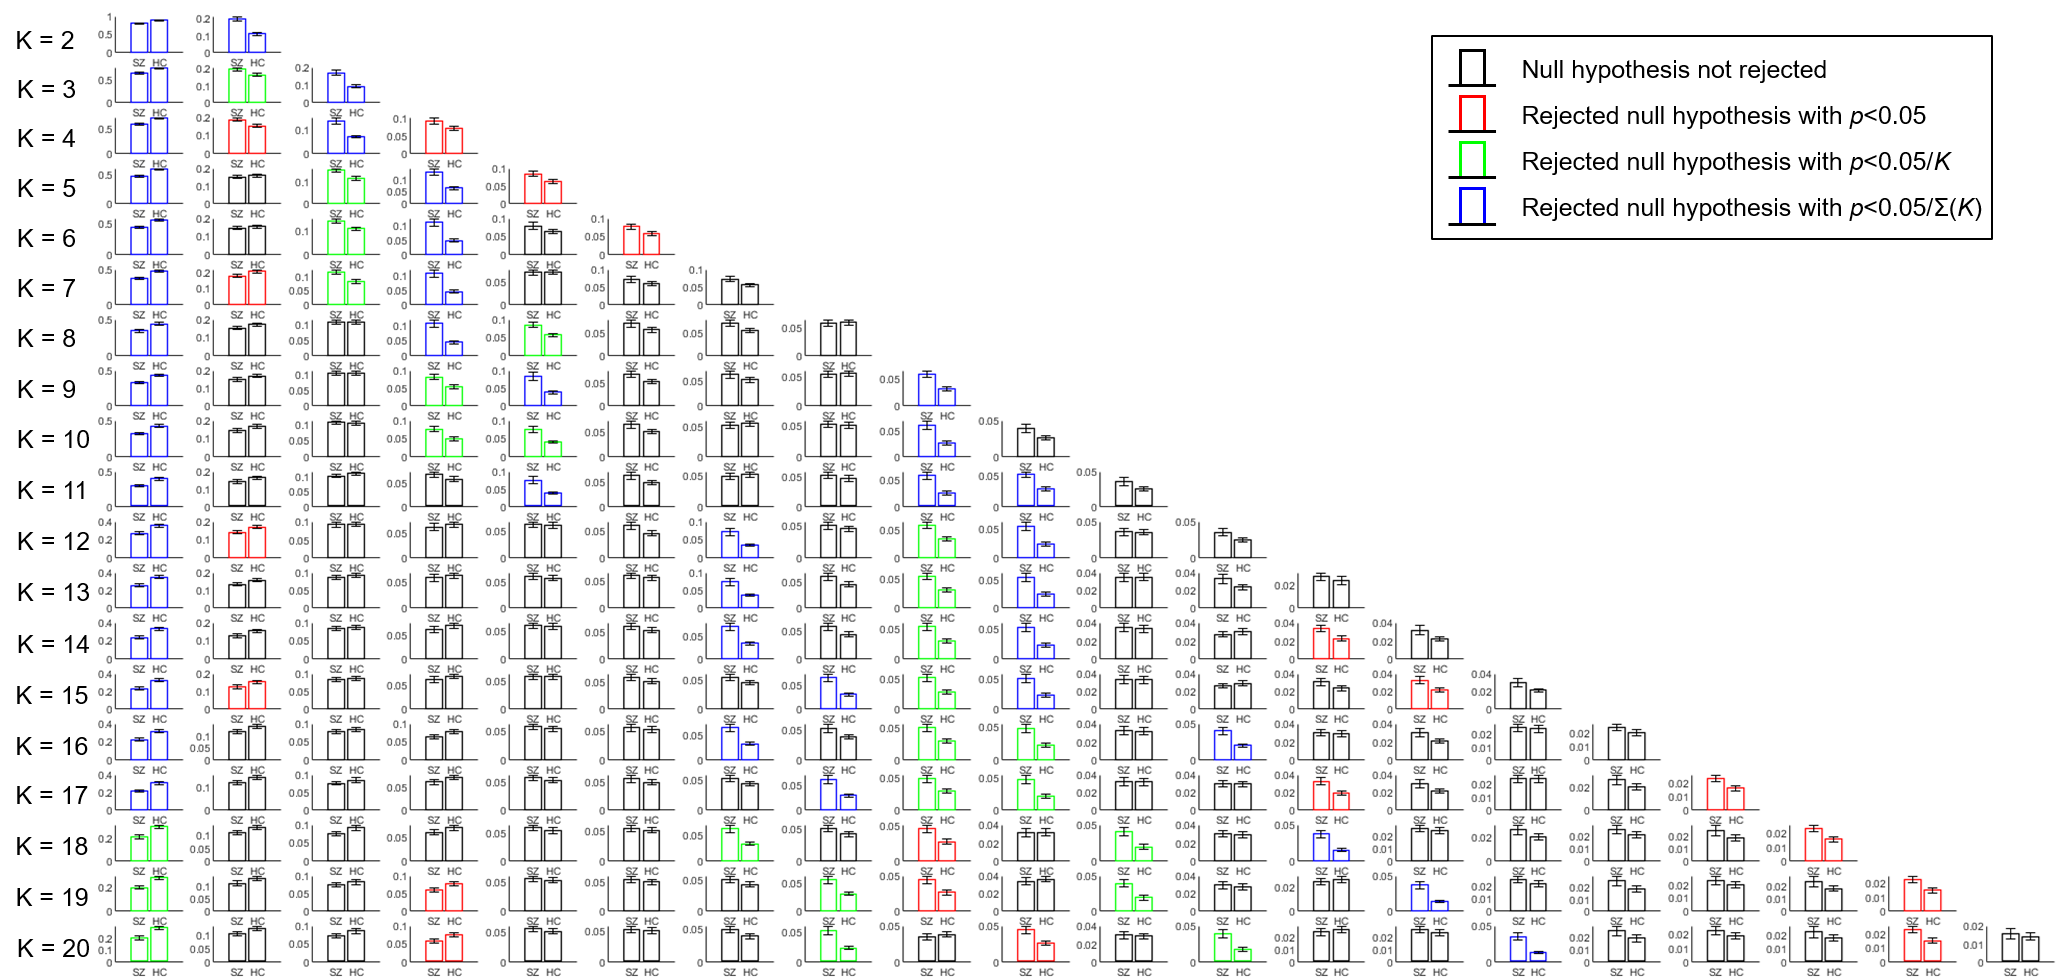
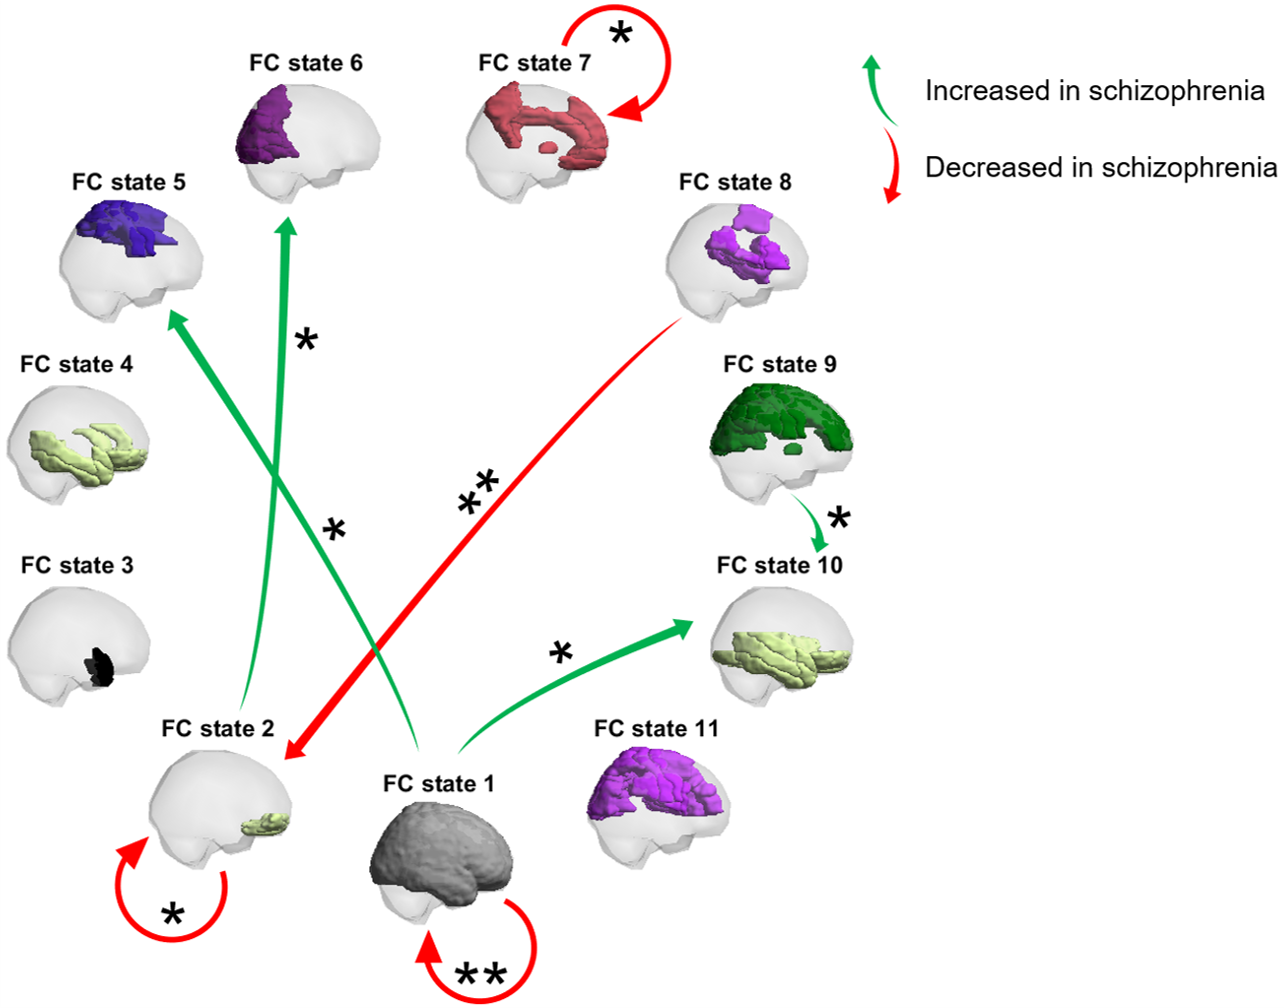
The intergroup differences in the estimated mean fractional occupancy across clustering solutions are presented in Fig.1. Compared to HCs, SZ patients revealed an estimated mean fractional occupancy significantly reduced in FC state 1 (global state of BOLD phase coherence) and significantly increased in a number of non-global FC states.Fig.2 depicts the selected optimal clustering solution with $$$\small{K=11}$$$ FC states. Compared to HCs, SZ patients revealed an estimated mean fractional occupancy significantly reduced in FC state 1 and significantly increased in FC states 5, 9 and 10 which represented functionally meaningful networks related to the Somatomotor, Dorsal Attention and Limbic RSNs respectively. The estimated mean probability of remaining in FC state 1 and 7 was significantly reduced in SZ patients compared to HCs, as shown in Fig.3. A number of other state-to-state transitions were significantly affected in SZ patients compared to HCs. Only the estimated mean limiting probability of FC states 5 and 10 were identified as significantly increased in SZ patients compared to HCs $$$\small{(p<0.05)}$$$.
Both $$$\small{K}$$$-means and $$$\small{K}$$$-medoids identified similar FC states whose properties provided the capacity to differentiate SZ patients from HCs.
Discussion
Consistent with the literature 15-17, SZ patients demonstrably recurred less to a state of global BOLD phase coherence. Conversely, SZ patients were found to recur more often to a number of functionally meaningful "ghost" attractor states 1,8, as shown in 16,18.SZ patients could be hypothesised to present impaired flexible exploration of the full repertoire of FC states due to the reduced ability to access and remain in the more frequently occurring functionally integrative global state 16,18,19. The ability to remain in a Default RSN-related state was reduced in SZ - supporting the view that SZ affects cognitive function 20,21. Consistent with EEG studies 22, SZ patients switched less frequently from a Dorsal Attention RSN-related state to a Limbic RSN-related state.
Similar intergroup differences were captured using either $$$\small{K}$$$-medoids or $$$\small{K}$$$-means - suggesting that the choice of an optimal clustering algorithm should rely not only on statistical and cluster validation analyses, but also on concepts and methods from dynamical systems theory 1,5,8.
Conclusion
Through the characterisation of the temporal expression of different functionally meaningful connectivity patterns detected using the LEiDA method, this study provides unbiased and statistically rigorous evidence of altered dynamic brain activity in schizophrenia.Acknowledgements
No acknowledgement found.References
1. Deco G, Jirsa VK. Ongoing cortical activity at rest: criticality, multistability, and ghost attractors. J Neurosci. 2012;32(10):3366-3375.
2. Hutchison RM, Womelsdorf T, Allen EA, et al. Dynamic functional connectivity: promise, issues, and interpretations. Neuroimage. 2013;80:360-378.
3. Preti MG, Bolton TA, Van De Ville D. The dynamic functional connectome: State-of-the-art and perspectives. Neuroimage. 2017;160:41-54.
4. Sakoğlu U, Pearlson GD, Kiehl KA, Wang YM, Michael AM, Calhoun VD. A method for evaluating dynamic functional network connectivity and task-modulation: application to schizophrenia. MAGMA. 2010;23(5-6):351-366.
5. Cabral J, Vidaurre D, Marques P, et al. Cognitive performance in healthy older adults relates to spontaneous switching between states of functional connectivity during rest. Sci Rep. 2017;7(1):5135. Published 2017 Jul 11.
6. Bellec, P. COBRE preprocessed with NIAK 0.17 - lightweight release. 2016. https://doi.org/10.6084/m9.figshare.4197885.v1. Accessed June 25, 2021.
7. Tzourio-Mazoyer N, Landeau B, Papathanassiou D, et al. Automated anatomical labeling of activations in SPM using a macroscopic anatomical parcellation of the MNI MRI single-subject brain. Neuroimage. 2002;15(1):273-289.
8. Vohryzek J, Deco G, Cessac B, Kringelbach ML, Cabral J. Ghost Attractors in Spontaneous Brain Activity: Recurrent Excursions Into Functionally-Relevant BOLD Phase-Locking States. Front Syst Neurosci. 2020;14:20. Published 2020 Apr 17.
9. Aggarwal CC, Reddy CK. Data Clustering: Algorithms and Applications. 1st ed. Chapman & Hall/CRC; 2014.
10. Pesarin F, Salmaso L. Permutation tests for complex data: theory, applications and software. John Wiley & Sons; 2010.
11. Figueroa CA, Cabral J, Mocking RJT, et al. Altered ability to access a clinically relevant control network in patients remitted from major depressive disorder. Hum Brain Mapp. 2019;40(9):2771-2786.
12. Lord LD, Expert P, Atasoy S, et al. Dynamical exploration of the repertoire of brain networks at rest is modulated by psilocybin. Neuroimage. 2019;199:127-142.
13. Yeo BT, Krienen FM, Sepulcre J, et al. The organization of the human cerebral cortex estimated by intrinsic functional connectivity. J Neurophysiol. 2011;106(3):1125-1165.
14. Von Luxburg U. Clustering stability: an overview. arXiv:1007.1075. 2010.
15. Damaraju E, Allen EA, Belger A, et al. Dynamic functional connectivity analysis reveals transient states of dysconnectivity in schizophrenia. Neuroimage Clin. 2014;5:298-308. Published 2014 Jul 24.
16. Rabany L, Brocke S, Calhoun VD, et al. Dynamic functional connectivity in schizophrenia and autism spectrum disorder: Convergence, divergence and classification [published correction appears in Neuroimage Clin. 2019 Nov 12;:102012]. Neuroimage Clin. 2019;24:101966.
17. Sanfratello L, Houck JM, Calhoun VD. Dynamic Functional Network Connectivity in Schizophrenia with Magnetoencephalography and Functional Magnetic Resonance Imaging: Do Different Timescales Tell a Different Story?. Brain Connect. 2019;9(3):251-262.
18. Miller RL, Yaesoubi M, Turner JA, et al. Higher Dimensional Meta-State Analysis Reveals Reduced Resting fMRI Connectivity Dynamism in Schizophrenia Patients. PLoS One. 2016;11(3):e0149849. Published 2016 Mar 16.
19. Nomi JS, Vij SG, Dajani DR, et al. Chronnectomic patterns and neural flexibility underlie executive function. Neuroimage. 2017;147:861-871.
20. van den Heuvel MP, Hulshoff Pol HE. Exploring the brain network: a review on resting-state fMRI functional connectivity. Eur Neuropsychopharmacol. 2010;20(8):519-534.
21. Fioravanti M, Bianchi V, Cinti ME. Cognitive deficits in schizophrenia: an updated metanalysis of the scientific evidence. BMC Psychiatry. 2012;12:64. Published 2012 Jun 20.
22. Rieger K, Diaz Hernandez L, Baenninger A, Koenig T. 15 Years of Microstate Research in Schizophrenia - Where Are We? A Meta-Analysis. Front Psychiatry. 2016;7:22. Published 2016 Feb 26.
Figures