3347
Structural abnormalities in olfactory brain regions in early Parkinson’s disease (PD) patients measured by high resolution MRI at 7T
Adrian Grant Paez1,2, Suraj Rajan3,4, Alex Y Pantelyat3, Liana I Rosenthal3, Andreia Faria5, Xinyuan Miao2,6, Ted M Dawson3, Peter C. M. van Zijl1,2, Vidyulata Kamath4, and Jun Hua1,2
1Radiology and Radiological Science, Johns Hopkins University School of Medicine, Baltimore, MD, United States, 2F.M. Kirby Research Center, Kennedy Krieger Institute, Baltimore, MD, United States, 3Neurology, Johns Hopkins University School of Medicine, Baltimore, MD, United States, 4Psychiatry and Behavioral Sciences, Johns Hopkins University School of Medicine, Baltimore, MD, United States, 5Radiology and Radiological Science, Kennedy Krieger Institute, Baltimore, MD, United States, 6Johns Hopkins University School of Medicine, Baltimore, MD, United States
1Radiology and Radiological Science, Johns Hopkins University School of Medicine, Baltimore, MD, United States, 2F.M. Kirby Research Center, Kennedy Krieger Institute, Baltimore, MD, United States, 3Neurology, Johns Hopkins University School of Medicine, Baltimore, MD, United States, 4Psychiatry and Behavioral Sciences, Johns Hopkins University School of Medicine, Baltimore, MD, United States, 5Radiology and Radiological Science, Kennedy Krieger Institute, Baltimore, MD, United States, 6Johns Hopkins University School of Medicine, Baltimore, MD, United States
Synopsis
We demonstrate significant structural abnormalities in the OB, primary and secondary olfactory brain regions in early PD patients measured by high resolution MRI at 7T. The MRI measures showed significant correlations with behavioral olfactory deficits in the participants.
Synopsis
We demonstrate significant structural abnormalities in the OB, primary and secondary olfactory brain regions in early PD patients measured by high resolution MRI at 7T. The MRI measures showed significant correlations with behavioral olfactory deficits in the participants.Introduction
Parkinson’s disease (PD) is a neurodegenerative disorder characterized by widespread impairments in motor and cognitive/behavioral functions. Olfactory deficits in PD are prevalent and reportedly present in up to 80-90% of sporadic PD cases(1-5). Such deficits can precede the onset of motor symptoms(6-8), and may be one of the earliest symptoms in PD(9). Postmortem pathological studies have demonstrated that Lewy bodies appear in the olfactory bulb (Braak Stage 1) before spreading to lower brainstem nuclei and the amygdala (Braak stages 2–3), and eventually substantia nigra and other midbrain regions (Braak stage 4: clinical disease stage), when motor functions become clearly affected(10). Olfactory loss has been linked to α-synuclein pathology, a major pathological hallmark of PD(11). Therefore, non-invasive and repeatable in vivo measures associated with olfactory deficits may be excellent candidates as quantitative in vivo biomarkers in early PD for tracking disease progression and evaluating treatment outcomes. In the human olfactory system, odorants are received by olfactory sensory neurons in the nasal epithelium,(12) which project first to glomeruli within the olfactory bulbs (OB) and then to piriform cortex (PC), also known as the primary olfactory cortex. Subsequently, neuronal networks in the orbitofrontal cortex (OFC), insular cortex, hippocampus, amygdala, and hypothalamus are involved to translate external odor information into behavioral responses(13). These regions are often referred to as secondary olfactory regions. Structural changes in the OB, PC and secondary olfactory regions have been reported in PD. In this study, high resolution structural MRI scans were performed in early PD patients and matched controls to systemically investigate structural abnormalities in the primary and secondary olfactory regions. The experiments were conducted on ultra-high magnetic field (7.0 Tesla or 7T) human MRI scanner to enhance the sensitivity. The relationship between MRI and behavioral olfactory measures was investigated.Methods
All MRI scans were performed on a 7T Philips MRI scanner. A cohort of 15 PD patients, and 15 healthy controls matched in age, sex, and education level were recruited for the study (Table 1). The University of Pennsylvania Smell Identification Test (UPSIT) (14,15) was administrated to all participants to assess their behavioral olfactory functions. The following scans were performed for each participant: 1) MPRAGE MRI (16,17) (voxel=1mm isotropic, TR/TE/TI=5ms/1.81ms/563ms); 2) T2-weighted scan (voxel=0.5mm isotropic, TR/TE=5000ms/58ms). Due to its small size and unique contrast, the OB was manually traced on the T2-weighted images. Thirteen additional regions of interest (ROI) in the cortex and subcortex were manually identified and segmented on the MPRAGE images. Figure 1 shows an example of the segmentation from one participant. Volumes of individual ROI were calculated using a custom Matlab script. Two-sample t-tests were performed to examine group difference in the volumes of individual ROI. Age and sex were accounted for as covariates. Correlations between volumes of ROIs and UPSIT scores were assessed with multiple regression with age and sex as covariates. Multiple comparisons were corrected with the false-discovery rate (adjusted P < 0.05).Results
The behavioral olfactory test (UPSIT) scores were significantly lower in early PD patients compared to controls, indicating impaired olfactory function in PD patients. Figure 2 shows the group comparison results of the measured volumes of the OB, primary (piriform cortex) and secondary olfactory regions in early PD patients and controls. The volume of OB did not show significant difference between PD and controls. The volumes of the primary olfactory (piriform) cortex were significantly lower in early PD patients. In contrast, the volumes of insula, thalamus, caudate and cingulate cortex were significantly higher in PD patients. Figure 3 shows the correlation analysis between region volumes and the UPSIT scores, which revealed significant positive correlations in the OB, piriform cortex and amygdala, and significant negative correlations in the insula, caudate and cingulate cortex.Discussion & Conclusion
We demonstrate significant structural abnormalities in the OB, primary and secondary olfactory brain regions in early PD patients measured by high resolution MRI at 7T. The MRI measures showed significant correlations with behavioral olfactory deficits in the participants.Acknowledgements
No acknowledgement found.References
(1)Doty, RL, et al. Neurology 1988;38:1237. (2)Markopoulou, K, et al. Neurology 1997;49:1262. (3)Berendse, HW, et al. Ann Neurol 2001;50:34. (4)Doty, RL Neurobiol Dis 2012;46:527. (5)Ansari, KA, et al. J Chronic Dis 1975;28:493. (6)Montgomery, EB, Jr., et al. Neurology 1999;52:757. (7)Ponsen, MM, et al. Ann Neurol 2004;56:173. (8)Ross, GW, et al. Ann Neurol 2008;63:167. (9)Hawkes, CH, et al. Parkinsonism Relat Disord 2010;16:79. (10)Braak, H, et al. Neurobiol Aging 2003;24:197. (11)Doty, RL Nat Rev Neurol 2012;8:329. (12)Buck, L, et al. Cell 1991;65:175. (13)Doty, RL. (2015) Handbook of olfaction and gustation. Hoboken, New Jersey: Wiley Blackwell (14)Doty, RL, et al. Physiol Behav 1984;32:489. (15)Doty, RL, et al. Perception \& Psychophysics 1989;45:381. (16)Marques, JP, et al. Neuroimage 2010;49:1271. (17)Van de Moortele, PF, et al. Neuroimage 2009;46:432.Figures
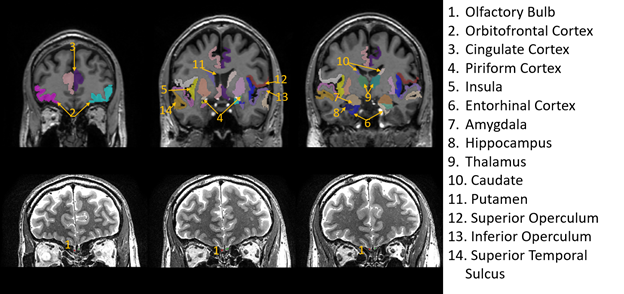
Regions-of-interest (ROI) evaluated in the
study overlaid on structural images from one subject. Due to its small size and
unique contrast, the olfactory bulb (#1) was traced on the T2-weighted images
(bottom row). All the other ROIs were identified and segmented on MPRAGE images
(top row). Note that only six coronal slices were provided to illustrate the
locations of the ROIs, but many ROIs can cover more slices. Most olfactory
regions are best viewed in the coronal plane.
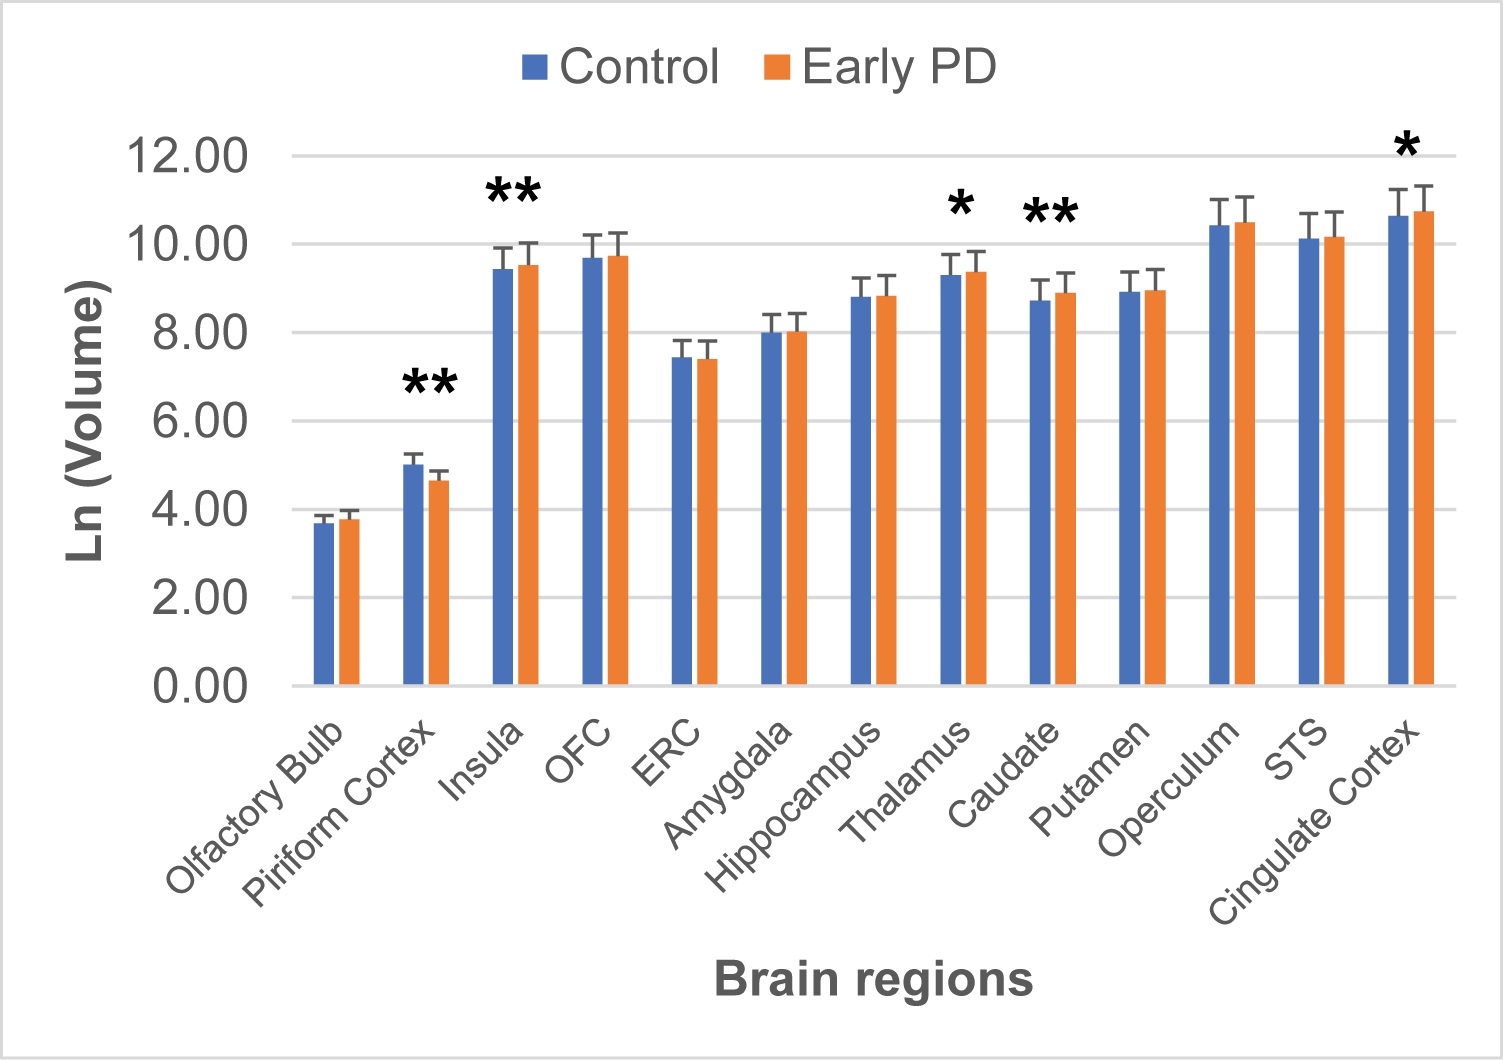
Group
comparison of the volumes of the OB, primary (piriform) and secondary olfactory
regions in the brains of early PD patients (n = 15) and controls (n = 15). Ln
(Volume) was used for display due to the large difference in volumes from different
regions. *: P < 0.05; **: P < 0.01.
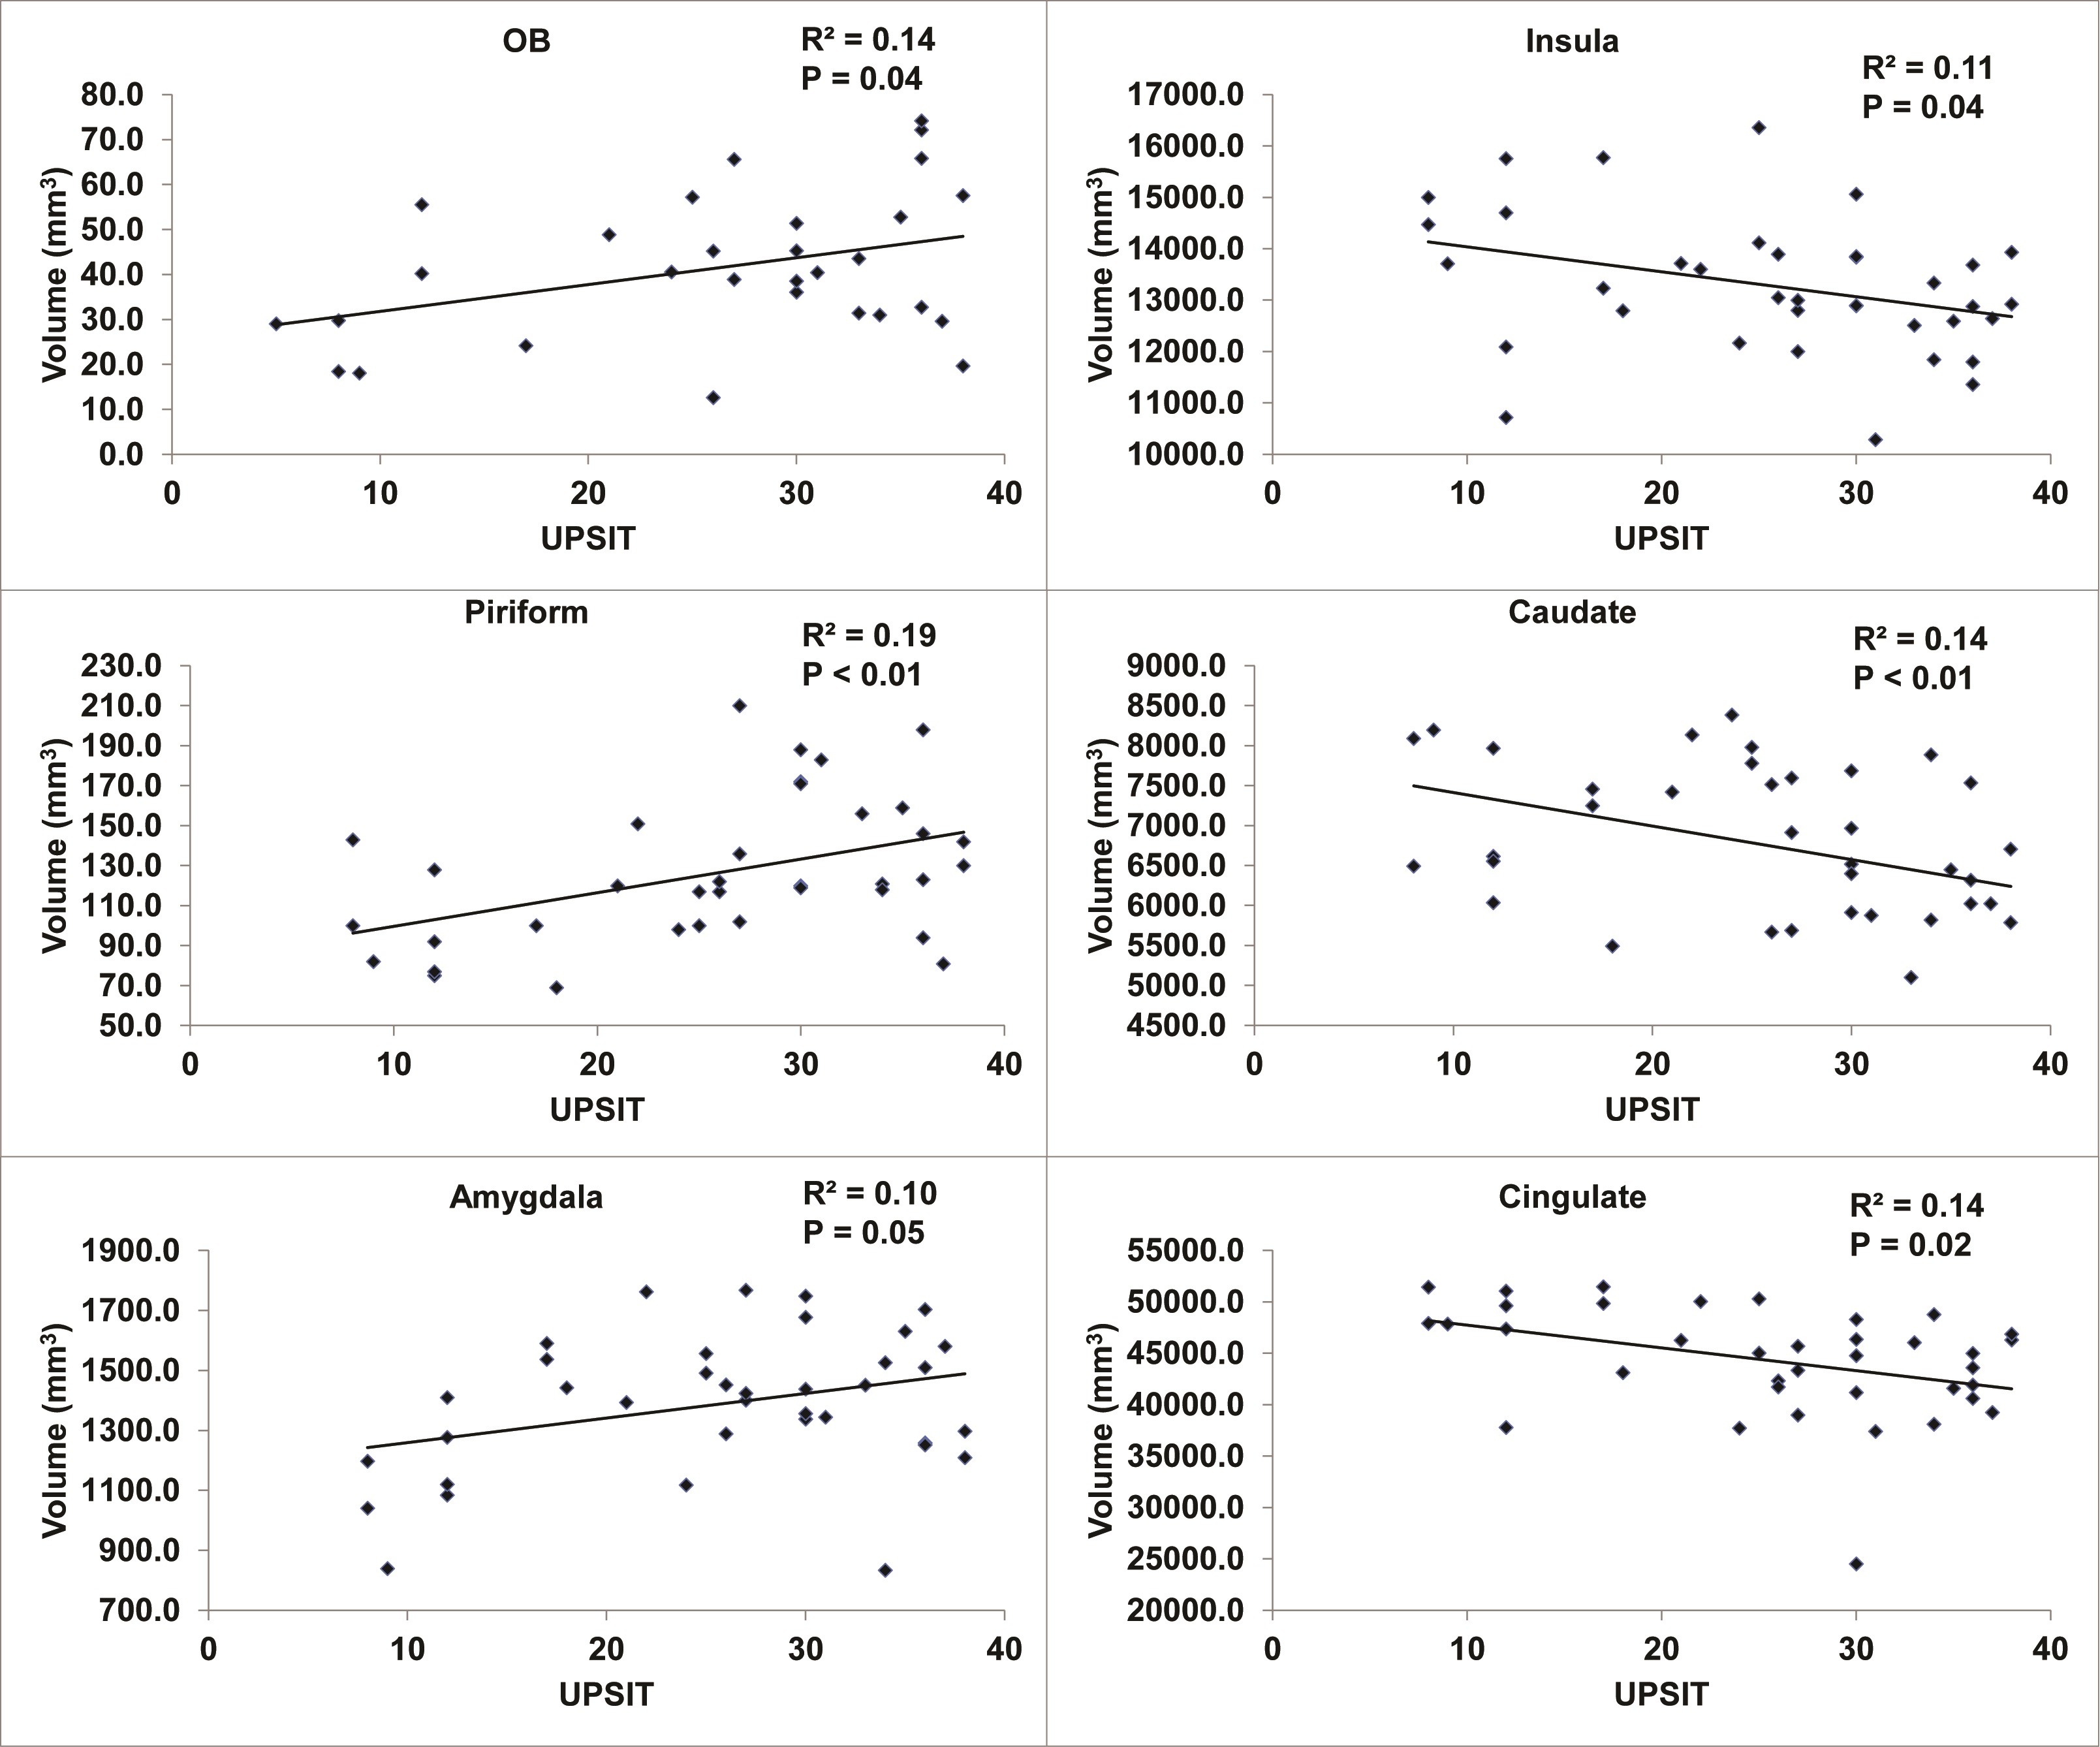
Correlation
between volumes of different brain regions and the behavioral olfactory test
scores (UPSIT) in all participants.
DOI: https://doi.org/10.58530/2022/3347