3345
Multi-Site Normative Modeling and Hierarchical Bayesian Analysis of DKI metrics in Carriers of 16p11.2 Copy Number Variants1Mark and Mary Stevens Neuroimaging and Informatics Institute, University of Southern California, Marina del Rey, CA, United States, 2Institut Pasteur, Université de Paris, Paris, France, 3Simons Foundation, New York, NY, United States, 4Service des Troubles du Spectre de l’Autisme et apparentés, Département de psychiatrie, Lausanne University Hospital, Lausanne, Switzerland, 5Laboratoire de Recherche en Neuroimagerie, Université de Lausanne, Lausanne, Switzerland, 6Psychology Department, University of Montreal, Montreal, QC, Canada, 7Departments of Psychiatry and Biobehavioral Sciences and Psychology, Semel Institute for Neuroscience and Human Behavior, University of California, Los Angeles, Los Angeles, CA, United States, 8University of Montreal, Montreal, QC, Canada
Synopsis
We used Hierarchical Bayesian Regression (HBR) to create a normative model of age-effects on Diffusion Kurtosis Imaging (DKI) measures of the white matter. DKI maps from more than 1,300 healthy subjects (3-78 years) from six sites and eight scanners were used to estimate the normative model across the lifespan enabling the multi-site data integration with HBR. 16p11.2 deletions and duplications showed “mirror effects” on diffusion kurtosis metrics.
Introduction
Diffusion Kurtosis Imaging (DKI) quantifies non-Gaussian water diffusion and offers sensitive metrics of brain microstructure in health and disease1. Even so, differences in image acquisition parameters cause non-trivial differences in diffusion MRI and its derived metrics2–4. Efforts to harmonize diffusion MRI have been developed5, and these facilitate data integration in multi-site initiatives that aim to increase statistical power by pooling scans from different centers. Here we computed DKI metrics from a multi-site dataset to examine brain microstructure in carriers of copy number variants (CNVs) at the 16p11.2 chromosomal locus6, which encompasses 28 genes. Deletion of these genes (16pDel) is associated with autism spectrum disorder and language delay. Their duplication (16pDup) is associated with schizophrenia and autism. 16pDel and 16pDup are both rare genetic variants with a prevalence of 1:~2,000 live births. Thus, we pooled five small 16p11.2 CNV datasets. Importantly, each dataset comprised different age ranges covering the lifespan; to merge them we used a recently proposed method called Normative Modeling (NM) that uses Hierarchical Bayesian Regression (HBR) to model site-dependent variability in the data7,8. NM is a statistical tool that estimates the centiles of variation of a brain metric as a function of specific covariates, e.g., age. As a Bayesian method, it infers a posterior distribution (rather than a single maximum likelihood estimate) for each brain metric, conditional on the values of the known covariates. Our goal was to: 1) establish normative values for DKI metrics across the lifespan, based on data from 1,377 controls across six datasets using NM with HBR and 2) characterize the main effect and age-dependent effects of 16pDel and 16pDup on DKI metrics, in the largest multi-site sample of these CNVs to date.Methods
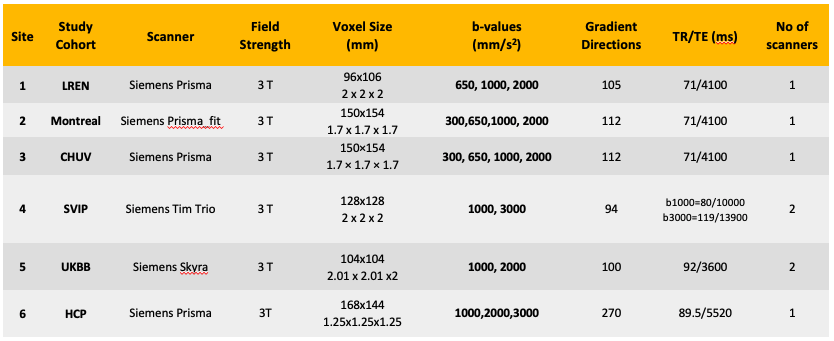
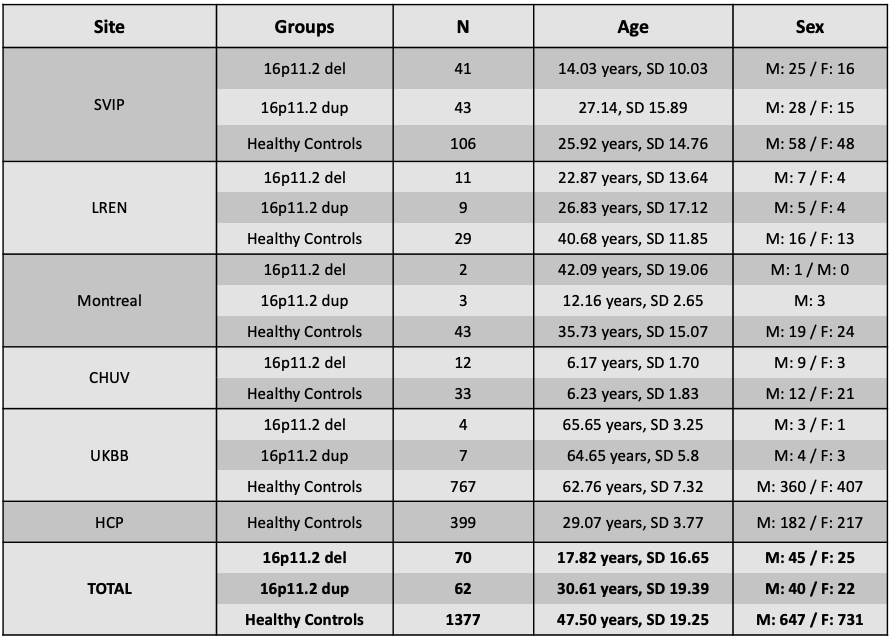
Image acquisition parameters are shown in Table 1. All images were identically preprocessed (DIPY9 and FSL10). DTI-based fractional anisotropy (FA) and DKI metrics were all computed with DIPY11. To estimate normative distributions of the metrics across all ages we included, in addition to the control subjects from the main sites with CNV carriers (3-70 years), 767 subjects with no CNVs from the UKBB (>46 years) and 399 from the WU-Minn HCP (22-37 years). Demographics for each dataset are summarized in Table 2. All subjects’ FA maps were registered to match the ENIGMA-FA template with ANTs12; these deformations were applied to the DKI metrics. 21 bilateral regions of interest (ROIs) from the JHU white matter atlas (JHU-WM)1 were extracted using the ENIGMA-DTI protocol14. For the HBR, we used age and sex as covariates, with each DKI metric per ROI as the dependent variable and the scanner ID (8 total) to model the batch effect. We modeled the effect of age with a cubic b-spline. In the NM framework, deviations from the norm are quantified as Z-scores for each subject across all ROIs. Data from 80% of the 1,377 control participants were used as the training sample to estimate the norms. The remaining control subjects were used as a test set and Z-scores were calculated, measuring their deviations from the reference distribution. Z-scores for the 16pDel and 16pDup samples were calculated separately. Probabilities of abnormality (p-values) were derived from all Z-scores. ROI-wise areas under the ROC curves (AUCs) were calculated to determine the classification accuracy of the computed deviations, for each 16p11.2 CNV. We performed 1,000 permutation tests for each DKI metric per ROI, and ran the false discovery rate (FDR) on each metric across all ROIs to identify those showing significant group differences. For the significant ROIs, we calculated the average of extreme deviations (Z>|2|) for each 16p11.2 CNV15.Results
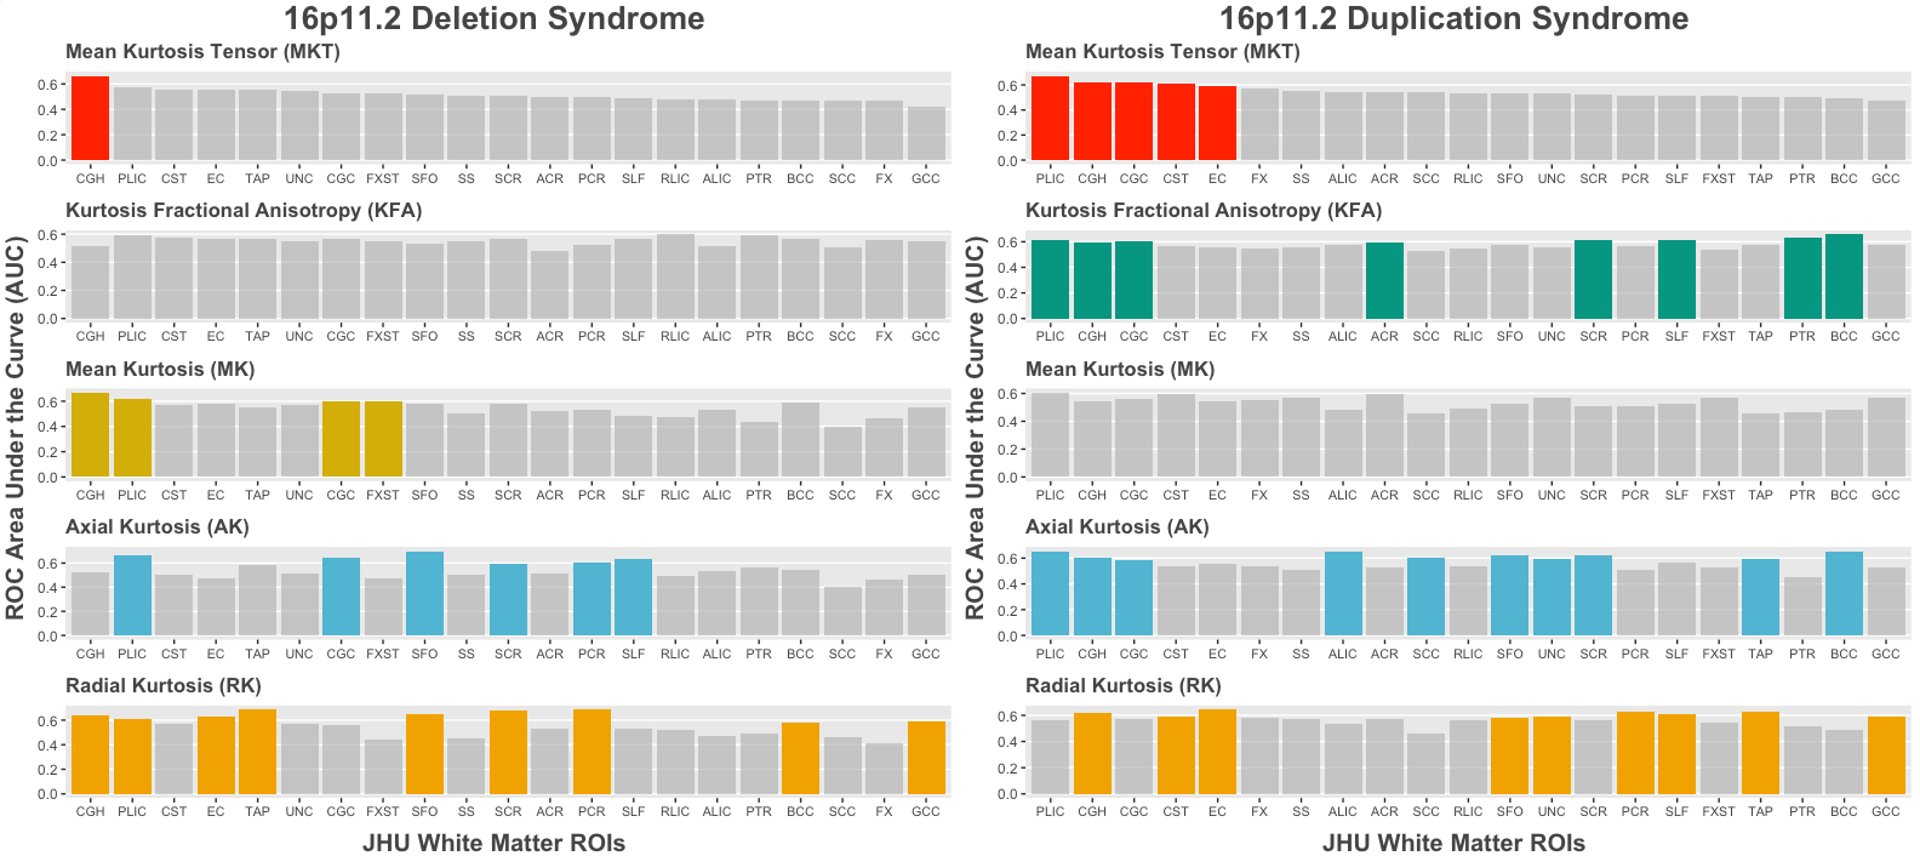
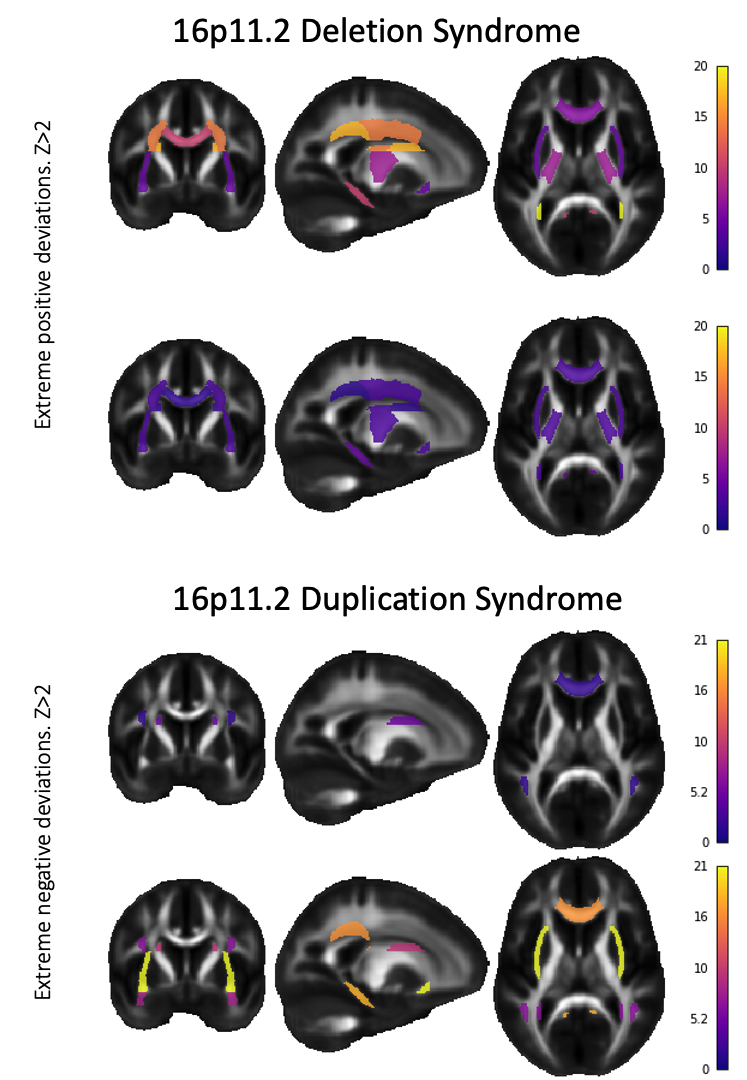
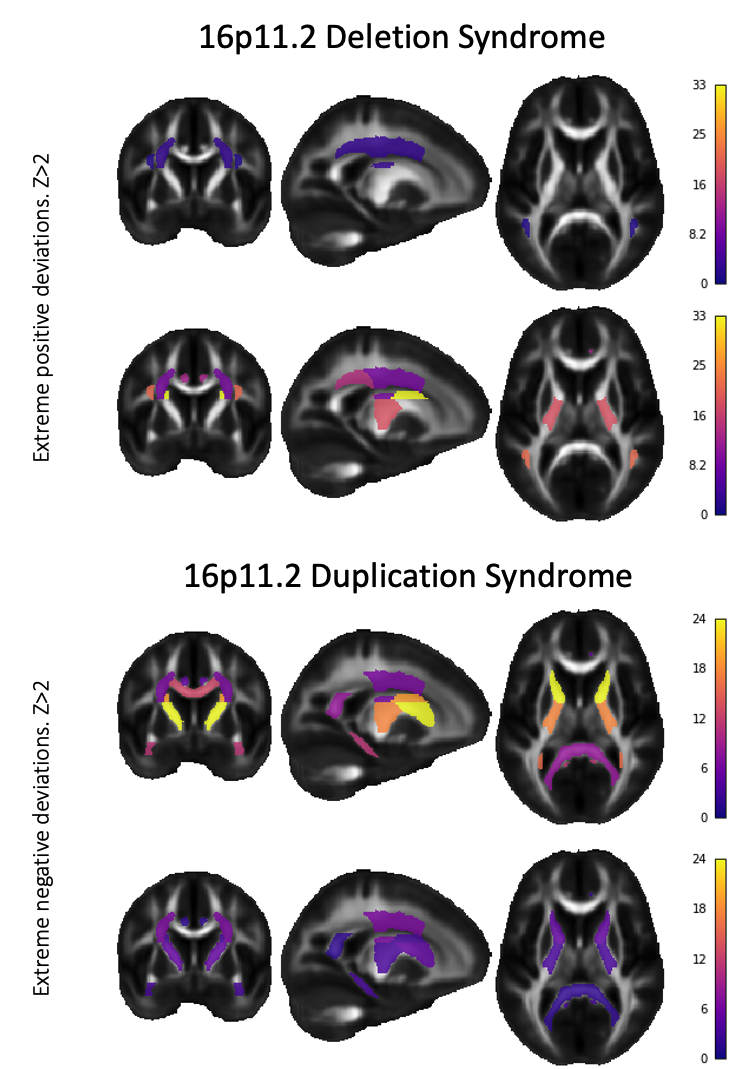
Among the five DKI metrics - mean, radial and axial kurtosis (MK, RK, AK), kurtosis mean tensor and fractional anisotropy (KMT, KFA)16–18 - AK and RK showed greatest group separation in terms of the AUC and the number of significant ROIs (Figure 1): 6 and 9 ROIs for AK and RK, respectively for 16pDel; and 10 and 9 ROIs for AK and RK, respectively for 16pDup. All significant ROIs had AUC>0.58. Deletions and duplications were associated with opposing effects (i.e., a “mirror-effect”) on RK and AK (Figures 2 and 3). MK only yielded significant effects for 16pDel and effects on KFA were only observed for 16pDup. By contrast, MKT was significant for only one ROI in 16pDel, whereas it was significant for 5 ROIs in 16pDup.Discussion
The "mirror-effect" observed for RK (16pDel and 16pDup) may be due to non-Gaussian diffusion caused by higher axonal density in 16pDel and lower axonal density in 16pDup. This interpretation may be corroborated by the negative deviations from the norm of MKT and KFA in 16pDup in the PLIC, CGH, CGC, and, conversely, by positive deviations from the norm in the MKT and MK in these same ROIs in 16pDel.Conclusion
Using HBR-based NM, we modeled the heterogeneity of brain disease effects caused by 16p11.2 CNVs across a large age range that is not readily captured by case-control studies from restricted age ranges. We computed a nonlinear model of age effects for DKI metrics in the WM. This technique may be useful in the future to study additional brain dMRI metrics in multi-site studies of psychiatric disorders and other neurogenetic syndromes.Acknowledgements
Funding sources:
- Canada Research Chair in Neurodevelopmental Disorders, CFREF (Institute For Data Valorization - IVADO), Brain Canada Multi-Investigator Research Initiative (MIRI).
- Simons Foundation Grant Nos. SFARI219193 and SFARI274424
- Funded in part by NIH grant U54 EB020403.
- Swiss National Science Foundation (SNSF) Marie Heim Vögtlin Grant (PMPDP3_171331)
References
1. Jensen JH, Helpern JA, Ramani A, Lu H, Kaczynski K. Diffusional kurtosis imaging: the quantification of non-gaussian water diffusion by means of magnetic resonance imaging. Magn Reson Med. 2005;53(6):1432-1440.
2. Zhan L, Leow AD, Jahanshad N, et al. How does angular resolution affect diffusion imaging measures? Neuroimage. 2010;49(2):1357-1371.
3. Landman BA, Farrell JAD, Jones CK, Smith SA, Prince JL, Mori S. Effects of diffusion weighting schemes on the reproducibility of DTI-derived fractional anisotropy, mean diffusivity, and principal eigenvector measurements at 1.5T. Neuroimage. 2007;36(4):1123-1138.
4. Tax CM, Grussu F, Kaden E, et al. Cross-scanner and cross-protocol diffusion MRI data harmonisation: A benchmark database and evaluation of algorithms. Neuroimage. 2019;195:285-299.
5. Fortin J-P, Parker D, Tunç B, et al. Harmonization of multi-site diffusion tensor imaging data. Neuroimage. 2017;161:149-170.
6. Jacquemont S, Reymond A, Zufferey F, et al. Mirror extreme BMI phenotypes associated with gene dosage at the chromosome 16p11.2 locus. Nature. 2011;478(7367):97-102.
7. Marquand AF, Rezek I, Buitelaar J, Beckmann CF. Understanding Heterogeneity in Clinical Cohorts Using Normative Models: Beyond Case-Control Studies. Biol Psychiatry. 2016;80(7):552-561.
8. Kia SM, Huijsdens H, Dinga R, et al. Hierarchical Bayesian regression for multi-site normative modeling of neuroimaging data. In: Medical Image Computing and Computer Assisted Intervention – MICCAI 2020. Lecture notes in computer science. Cham: Springer International Publishing; 2020:699-709.
9. Garyfallidis E, Brett M, Amirbekian B, et al. Dipy, a library for the analysis of diffusion MRI data. Front Neuroinform. 2014;8:8.
10. Andersson JLR, Graham MS, Drobnjak I, Zhang H, Filippini N, Bastiani M. Towards a comprehensive framework for movement and distortion correction of diffusion MR images: Within volume movement. Neuroimage. 2017;152:450-466.
11. Henriques RN, Correia MM, Marrale M, et al. Diffusional Kurtosis Imaging in the Diffusion Imaging in Python Project. Front Hum Neurosci. 2021;15:675433.
12. Avants BB, Tustison NJ, Song G, Cook PA, Klein A, Gee JC. A reproducible evaluation of ANTs similarity metric performance in brain image registration. Neuroimage. 2011;54(3):2033-2044.
13. Mori S, Oishi K, Jiang H, et al. Stereotaxic white matter atlas based on diffusion tensor imaging in an ICBM template. Neuroimage. 2008;40(2):570-582.
14. Jahanshad N, Kochunov PV, Sprooten E, et al. Multi-site genetic analysis of diffusion images and voxelwise heritability analysis: a pilot project of the ENIGMA-DTI working group. Neuroimage. 2013;81:455-469.
15. Wolfers T, Rokicki J, Alnaes D, et al. Replicating extensive brain structural heterogeneity in individuals with schizophrenia and bipolar disorder. Hum Brain Mapp. 2021;42(8):2546-2555.
16. Jensen JH, Helpern JA. MRI quantification of non-Gaussian water diffusion by kurtosis analysis. NMR Biomed. 2010;23(7):698-710.
17. Glenn GR, Helpern JA, Tabesh A, Jensen JH. Quantitative assessment of diffusional kurtosis anisotropy. NMR Biomed. 2015;28(4):448-459.
18. Hansen B, Lund TE, Sangill R, Jespersen SN. Experimentally and computationally fast method for estimation of a mean kurtosis. Magn Reson Med. 2013;69(6):1754-1760.
Figures