3343
Brain Functional Segregation Predicts Symptom Severity and Treatment Response in Psychotic Disorders1Harvard Medical School, BELMONT, MA, United States
Synopsis
Functional segregation, i.e., anticorrelated neural activities, has not been well-explored in fMRI studies. We introduced the Negative Degree Centrality (NDC) method to quantify functional segregation. We found decreased NDC in psychotic disorder patients compared to controls. Positive, negative, and general psychotic symptoms were associated with impaired NDC in three different brain networks respectively. Using NDC and a machine learning approach, we identified two subgroups of patients with distinct recovery trajectories after one-year treatment. Our findings suggested impaired functional segregation in different brain circuits might be the neurobiological mechanisms associated with various psychotic symptoms and outcome heterogeneity in psychotic disorders.
Introduction
Functional segregation is characterized by uncorrelated or anticorrelated neural activities in different functionally specialized brain regions. Most resting-state functional MRI (fMRI) studies have focused on functional integration or positive functional connectivity. The functional significance of functional segregation or anticorrelation in neuropsychiatric disorders has gained attention in recent years as more and more studies found impaired anticorrelation between the default mode network (DMN) and the executive control/ frontal-parietal network in neuropsychiatric disorders[1-3]. However, the lack of a data-driven method to quantify functional segregation prevented detailed examination of the exact relationship between functional segregation and various symptoms as well as treatment response heterogeneity in psychotic patients. To address these issues, we introduced the Negative Degree Centrality (NDC) method to quantify functional segregation.Methods
We recruited 123 schizophrenia, 156 bipolar disorder, and 139 healthy subjects. Of those, 87 patients (31 schizophrenia and 56 bipolar disorder) completed a one-year follow-up visit. The Positive and Negative Syndrome Scale (PANSS) was collected for the patients. T1 images were acquired using MPRAGE (TR=2100ms; TE=2.25ms; FA=12°; FOV=256×256mm2; matrix=256×256; voxel =1×1×1.3mm3). BOLD-fMRI were acquired with EPI sequence (TR=3000ms; TE=30ms; FA=85°; FOV=1344×1344mm2; matrix=448×448; voxel =3×3×3mm3; volumes=124). After preprocessing, NDC map was generated for each subject using the following voxel-wise procedure (Fig.6). The Pearson correlation coefficients (CC) between the BOLD-fMRI time series of a specific voxel and all the other voxels of grey matter were calculated. The sum of the number of voxels with CC values lower than a negative threshold r was calculated and weighted by the absolute value of the correlation coefficients. A range of r from -0.95 to -0.1 with a step length of 0.025 were used, and the area under the curve of the weighted sum of CC across different thresholds r was calculated to give the NDC value for that specific voxel. We examined the difference of NDC between patients and controls at baseline using ANCOVA (age, sex, medication as covariates), as well as the NDC changes in patients after one-year (paired t-tests). Partial correlations between NDC and different psychotic symptoms (positive, negative, and general symptoms) were evaluated with age and sex as covariates across all the patients, as well as across schizophrenia and bipolar disorder groups separately. We then used an unsupervised k-means clustering approach to classify patients into subgroups based only on their distinct NDC patterns and compared their one-year outcomes after classification.Results
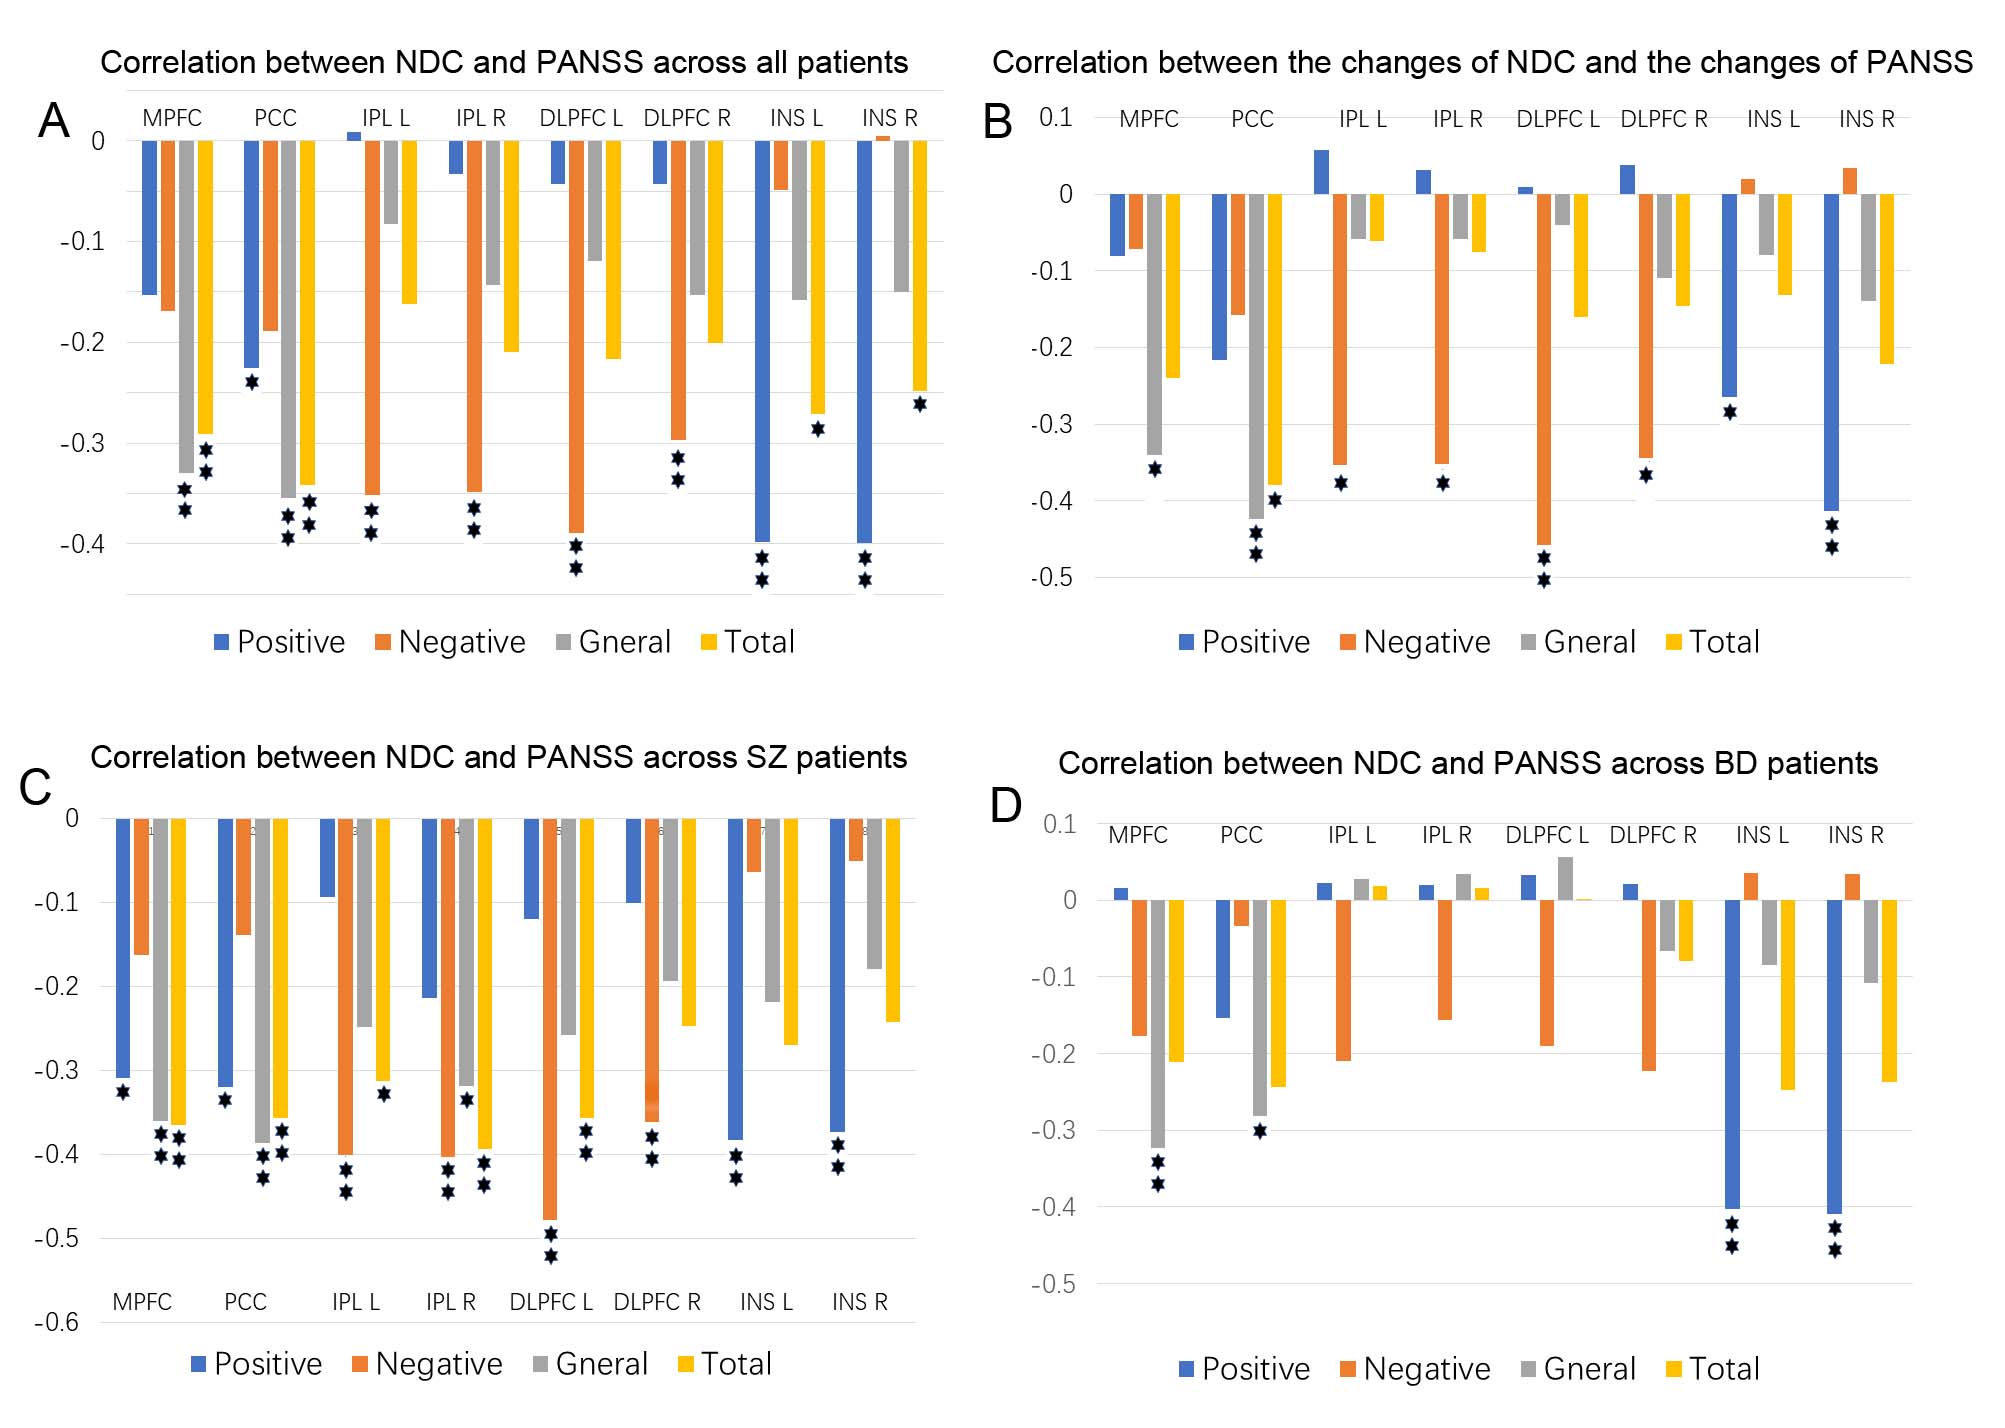
Compared to controls, both schizophrenia and bipolar disorder groups showed significantly decreased NDC at baseline in 8 brain regions: the medial prefrontal cortex (MPFC), posterior cingulate cortex (PCC), bilateral insular cortices (INS), bilateral dorsal lateral prefrontal cortices (DLPFC), and bilateral inferior parietal lobules (IPL) (Fig. 1A-C). The NDC impairment was more severe in schizophrenia compared to bipolar disorder (Fig. 1D). The mean NDC values in these 8 regions at baseline and one-year were used as features for later k-means clustering and correlation analysis. Correlation analysis showed these regions fell into three categories or networks and were linked to different symptoms (Fig 2 and 3): the MPFC and PCC fell into the DMN and showed the strongest correlation with general psychopathological symptoms; the bilateral DLPFC and IPL belong to the frontal-parietal network and showed the strongest correlation with negative symptoms; while the bilateral insula cortices belong to the salience network and were associated with positive symptoms. Paired t-tests across the 87 patients didn’t show significant increased NDC after one-year treatment compared to baseline except for two small clusters in the MPFC and right insula (Fig 4A). The k-means classifier identified two subgroups, with 43 patients in subgroup 1 and 44 patients in subgroup 2. Paired t-tests performed separately for the two subgroups showed that, for subgroup 1, only a small region in the right insula showed increased NDC (Fig 4B), but for subgroup 2, more widespread and significant increase of NDC were seen in the MPFC, right DLPFC, right IPL, and bilateral insula (Fig 4C) at one-year compared to baseline. Interestingly, the subgroup 2 showed more NDC impairments at baseline, after one-year treatment both the NDC and psychotic symptoms improved significantly. However, the subgroup 1 (with less NDC impairments at baseline) showed slightly improved NDC and symptom enhancement at one-year (Fig 5).Discussion
Our results suggested that positive, negative, and general symptoms associated with NDC impairments in the salience, frontal-parietal, and default-mode networks respectively. Because of the large variability in recovery trajectories and functional outcomes among psychiatric patients, traditional analysis that treating the patients as a homogeneous group couldn’t detect the brain functional connectivity changes after one-year treatment. Our approach combining NDC and k-means clustering successfully identified subgroups of patients with distinct recovery trajectories.Conclusions
Our findings demonstrated various psychotic symptoms were linked to impaired functional segregation in different brain circuits. The combined NDC and machine learning method may help to clarify the neurobiological mechanisms underlying heterogeneity of treatment outcome in psychotic disorders.Acknowledgements
This research work was supported by National Institutes of Health (NIH) grants: R21MH114020, R01MH114982, P50MH115846, K24MH104449, R01AG066670.References
- Williamson P. Are anticorrelated networks in the brain relevant to schizophrenia? Schizophrenia bulletin 2007; 33(4): 994-1003.
- Whitfield-Gabrieli S, Thermenos HW, Milanovic S, Tsuang MT, Faraone SV, McCarley RW et al. Hyperactivity and hyperconnectivity of the default network in schizophrenia and in first-degree relatives of persons with schizophrenia. Proceedings of the National Academy of Sciences 2009; 106(4): 1279-1284.
- Song X, Chen X, Yuksel C, Yuan J, Pizzagalli DA, Forester B et al. Bioenergetics and abnormal functional connectivity in psychotic disorders. Molecular psychiatry 2021: 1-10.
Figures