3342
Brain Structure-Function Network Hierarchy Abnormalities in Major Depressive Disorder1Icahn School of Medicine at Mount Sinai, New York, NY, United States
Synopsis
Major depressive disorder (MDD) diagnosis, research, and treatment is especially challenging given that current diagnosis entirely depends on clinical symptoms, whereas the underlying brain pathology remains largely unclear. Applying a novel multilayer network analysis, considering communication within functional and structural networks as well as the interactions between them, we found aberrant centrality measures of various brain regions in MDD compared to controls that were not detected using single structural or functional connectomes. In addition, using multilayer network features as predictors in a machine learning algorithm resulted in higher predictive values compared to classification models based on single layer.
INTRODUCTION
Major depressive disorder (MDD) is one of the world’s largest health problems1. Currently, the diagnosis entirely depends on clinical symptoms, whereas the underlying brain pathology remains largely unclear. Accumulating evidence from the last decade suggests that complex etiology of psychiatric disorders such as MDD are not localized to single brain regions, but rather are manifested as aberrant communication between and within large-scale functional networks2-4. The mathematical field of graph theory emerged as a tool for characterizing the brain connectome (comprehensive map of neural connections) that have been previously shown to distinguish between healthy individuals and psychiatric patients5-7. Impaired network communication can be caused by gray matter or white matter deficits8. Accordingly, different neuroimaging modalities such as functional MRI (fMRI) and diffusion weighted imaging (DWI) provide different assessments of the same brain network. Therefore, each modality on its own is only partially explanatory. However, most studies examine either structural or functional networks, lacking a comprehensive model of structure-function interactions. As a multimodal network approach, we harnessed recent developments in graph theory by utilizing a multilayer network analysis9-11 for the integration of both functional and structural brain networks. Applying this novel analysis on ultra-high field 7T MRI data, we tested whether the multilayer network features can distinguish between MDD patients and healthy controls (HC), and if these can be used as predictors in a machine learning algorithm.METHODS
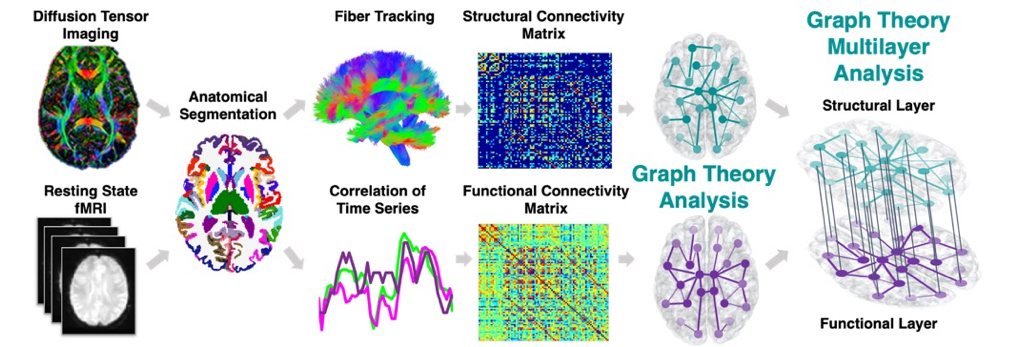
Data were acquired on a Siemens Magnetom 7T MRI scanner (Erlangen, Germany). 21 MDD patients and 21 HC underwent resting state fMRI and DWI. Functional images were preprocessed using the multi-echo independent component analysis implemented in AFNI12 and diffusion images using MRtrix3. Each subject’s anatomical T1-weighted image was segmented into Desikan-Killiany Atlas13 using FreeSurfer v.6.0 and co-registered into the DWI or fMRI space to construct the structural and functional connectomes respectively. Each of the segmented 84 regions of interest (ROIs) represents a node in the graph. The structural connectome edges (links) are defined by the streamline count between any pairwise ROIs derived from diffusion probabilistic tractography. The functional connectome edges are defined by the correlation between the mean time-series of all pairwise ROIs and normalized using Fisher r-to-Z transformation14 (Figure 1). Next, we applied a multilayer analysis, using R package ‘mplex’ (www.github.com/Achab94/mplex) where the structural and functional connectomes are the layers. The regional multilayer degree centrality coefficients (number of connections) were calculated using a tensorial approach15. A between-group t-test was conducted for each region's multilayer degree. We also conducted linear regression to assess the association between each region's multilayer degree and depression symptoms16 among the MDD patients, controlling for age and gender. Support vector machine (SVM)17 with fivefold cross-validation was used for group classification (MDD vs. HC) using Matlab (The MathWorks Inc., Natick, MA), where the multilayer centrality measures were used as the model inputs. For statistical significance permutation tests were performed conducting 1,000 repetitions on shuffled datasets. The overall accuracy, sensitivity, specificity, and ROC curve area under the curve (AUC) were computed for each classifier. The same procedure was conducted on the single structural or functional layers, where the centrality measures (number of connections within the single layer) were used as predictors. Differences in predictive values of the multilayer versus single layer classification was tested using Wilcoxon paired signed rank test.RESULTS
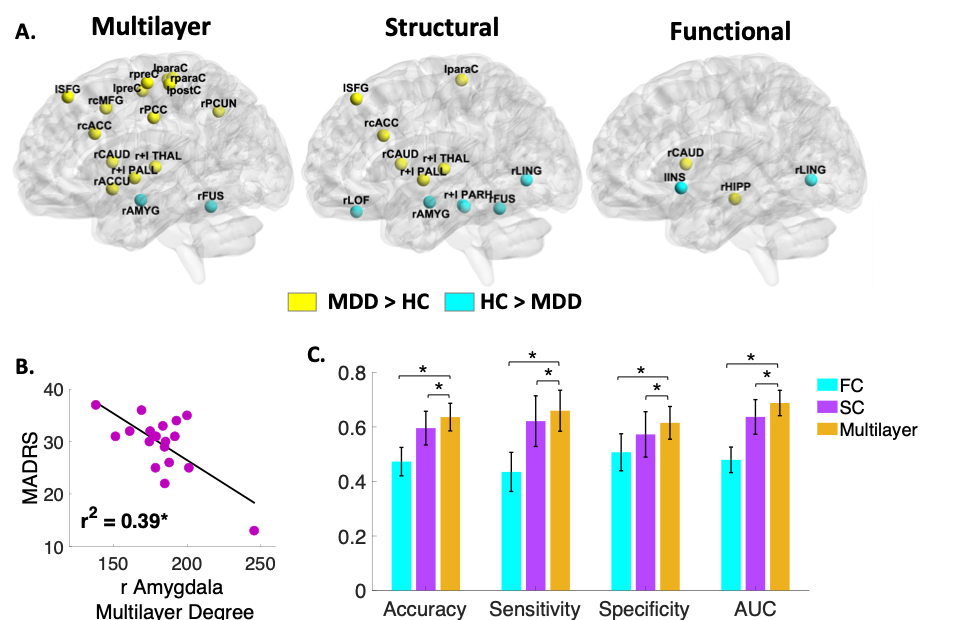
The multilayer analysis showed aberrant centrality measures of various regions in MDD compared to HC that were not detected using single structural or functional connectomes (Figure 2A). In addition, few regions were only detectable using single layer. The hippocampus, for example, exhibited higher centrality only within the functional network (t(38)=2.47, p<0.02, Cohen’s d=0.78). The amygdala, on the other hand, exhibited decreased centrality in MDD patients both within the structural layer (t(38)=3.77, p<0.001, Cohen’s d=1.2) and the combined multilayer network (t(38)=2.53, p<0.02, Cohen’s d=0.8). Further exploration found that lower amygdala multilayer centrality was associated with higher depression symptoms (r=-0.63, p<0.01) (Figure 2B). Preliminary SVM classification analysis resulted in an overall accuracy of 63%, sensitivity of 66%, specificity of 61% and AUC of 68%. The multilayer based classification model resulted in higher predictive values compared to classification models based on single layer of structural (Z=13.04, p<0.001) or functional (Z=27.22, p<0.001) connectomes (Figure 2C).DISCUSSION
The multilayer analysis revealed several aberrant centrality measures among MDD patients compared to HC. Specifically, MDD patients exhibited lower amygdala centrality measures both in the multilayer and single layer structural connectome analyses as well as association to higher depression symptoms, suggesting a main anatomical connectivity impairment related to disorder severity. The hippocampus however showed decreased centrality only in the functional connectome suggesting its dysfunction is related to its synchronization rather than anatomical connections. The multilayer based classification model resulted in higher predictive values compared to classification models based on single layer of only structural or functional connectomes. By using the same number of input features as the single modality network (84 ROIs’ centrality measures) the multilayer network model achieved a much-improved classification.CONCLUSION
Our results demonstrate the advantage of multilayer network features to capture critical regions and provide improved biomarkers for the diagnostics of MDD. Further research is needed to improve the generalization and predictive capacity for robust clinical translation.Acknowledgements
Funding was provided by NIH R01 MH109544.References
1. Collins, P. Y. et al. Grand challenges in global mental health. Nature 475, 27-30, doi:10.1038/475027a (2011)
2. Etkin, A., Büchel, C. & Gross, J. J. The neural bases of emotion regulation. Nat Rev Neurosci 16, 693-700, doi:10.1038/nrn4044 (2015).
3. Menon, V. Large-scale brain networks and psychopathology: a unifying triple network model. Trends in cognitive sciences 15, 483-506 (2011).
4. Sylvester, C. et al. Functional network dysfunction in anxiety and anxiety disorders. Trends Neurosci 35, 527-535 (2012).
5. Bullmore, E. & Sporns, O. Complex brain networks: graph theoretical analysis of structural and functional systems. Nature Reviews Neuroscience 10, 186-198 (2009).
6. Sporns, O. Networks of the Brain. (MIT press, 2011).
7. Bassett, D. S. et al. Hierarchical organization of human cortical networks in health and schizophrenia. J Neurosci 28, 9239-9248, doi:28/37/9239 [pii]10.1523/JNEUROSCI.1929-08.2008 [doi] (2008).
8. Drevets, W. C., Price, J. L. & Furey, M. L. Brain structural and functional abnormalities in mood disorders: implications for neurocircuitry models of depression. Brain structure and function 213, 93-118 (2008).
9. Muldoon, S. F. & Bassett, D. S. Network and Multilayer Network Approaches to Understanding Human Brain Dynamics. Philosophy of Science 83, 710-720, doi:10.1086/687857 (2016).
10. Vaiana, M. & Muldoon, S. F. Multilayer Brain Networks. Journal of Nonlinear Science, doi:10.1007/s00332-017-9436-8 (2018).
11. De Domenico, M. Multilayer modeling and analysis of human brain networks. GigaScience 6, 1-8, doi:10.1093/gigascience/gix004 (2017).
12. Kundu, P., Inati, S. J., Evans, J. W., Luh, W. M. & Bandettini, P. A. Differentiating BOLD and non-BOLD signals in fMRI time series using multi-echo EPI. Neuroimage 60, 1759-1770, doi:10.1016/j.neuroimage.2011.12.028 (2012).
13. Desikan, R. S. et al. An automated labeling system for subdividing the human cerebral cortex on MRI scans into gyral based regions of interest. Neuroimage 31, 968-980, doi:10.1016/j.neuroimage.2006.01.021 (2006).
14. Jacob, Y. et al. Neural correlates of rumination in major depressive disorder: A brain network analysis. NeuroImage: Clinical 25, 102142, doi:https://doi.org/10.1016/j.nicl.2019.102142 (2020).
15. De Domenico, M. et al. Mathematical Formulation of Multilayer Networks. Physical Review X 3, 041022, doi:10.1103/PhysRevX.3.041022 (2013).
16. Montgomery, S. A. & Asberg, M. A new depression scale designed to be sensitive to change. Br J Psychiatry 134, 382-389 (1979).
17. LaConte, S., Strother, S., Cherkassky, V., Anderson, J. & Hu, X. Support vector machines for temporal classification of block design fMRI data. NeuroImage 26, 317-329 (2005).
Figures