3341
Multiparametric Characterization of Focal Cortical Dysplasia using MR Fingerprinting1Epilepsy Center, Neurological Institute, Cleveland Clinic, Cleveland, OH, United States, 2Biomedical Engineering, Case Western Reserve University, Cleveland, OH, United States, 3Neuropathology, University of Erlangen, Erlangen, Germany, 4Imaging Institute, Cleveland Clinic, Cleveland, OH, United States
Synopsis
Focal cortical dysplasia (FCD) is a common pathology underlying medically intractable focal epilepsies. Conventional MRI can be limited in characterizing subtle FCD, due to the lack of quantitative measurements for tissue properties. Here, we proposed a multiparametric machine learning (ML) approach based on high-resolution 3D MR fingerprinting (MRF) to characterize FCD lesions. The ML model showed robust accuracy of 96%, 89%, and 79% to separate FCD from normal cortex, FCD type I from type II, and FCD type IIa from type IIb, respectively. Our findings suggest the usefulness of the multiparametric MRF ML approach to improve noninvasive epilepsy presurgical evaluation.
Introduction
Focal cortical dysplasia (FCD) is a common pathology for medically intractable focal epilepsies.1 FCDs are frequently missed by visual analysis of the conventional MRI, which lacks the sensitivity and specificity to differentiate subtle characteristics of FCDs from normal cortex. FCDs encompass a broad spectrum of histopathological abnormalities, e.g., FCD type I has abnormal radial and/or tangential cortical lamination, and FCD type II has dysmorphic neurons (IIb with balloon cells and IIa without).2 Many radiological features are shared by different FCD subtypes; therefore, visual determination of FCD subtypes on conventional MRI is often inconclusive.3 Non-invasive FCD subtyping is important, because different FCD subtypes have varying post-operative seizure outcomes, with type I and type IIa having poorer outcomes than type IIb.4,5 To tackle the challenges for noninvasive characterization of FCD, we utilized high-resolution 3D MR fingerprinting (MRF), which allows for fast acquisition of multiparametric tissue property maps simultaneously.6,7 MRF T1 and T2 tissue property maps were reported to have high sensitivity to epileptic lesions in prior studies.7,8 In the current study, we developed a multiparametric MRF machine learning (ML) approach, aiming to classify FCD lesions from normal cortex, and further characterize FCD subtypes.Methods
Subject recruitment: We included patients with medically intractable focal epilepsy, underwent resective surgery and had pathologically confirmed FCD. Healthy controls (HCs) were also included for comparison.MRI acquisition: A 3D whole-brain MRF scan was acquired at 3T (FOV=300x300x144 mm3, 1.0 mm3 isotropic voxel, scan time=10.4 minutes).7 MRF T1 map, T2 map, GM probability map, WM probability map and synthetic T1 weighted (T1w) images were reconstructed based on a predefined dictionary (Figure 1).6
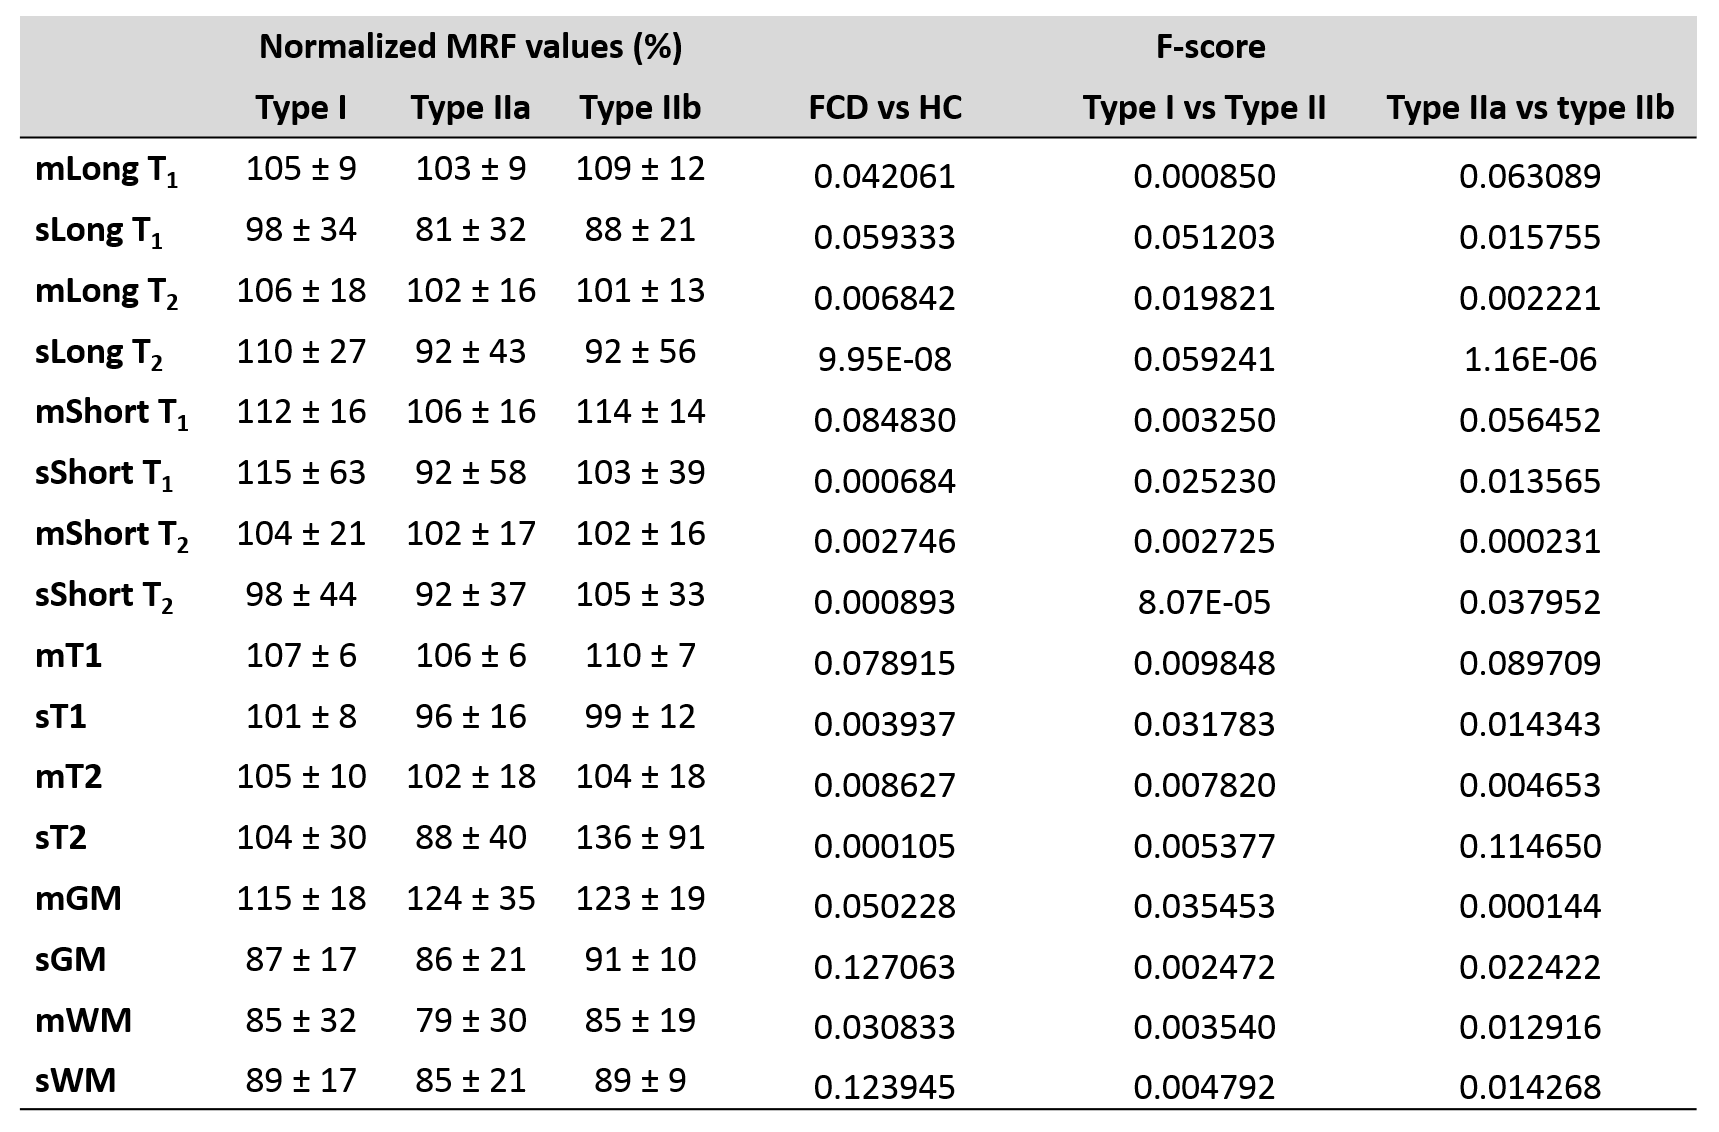
Data processing: A 3D ROI was created for each lesion on MRF T1w by expert review. MRF T1w images were registered to the MNI space using SyN9; the warping information was applied to T1, T2, GM, and WM maps, as well as the lesion ROIs to transform them into the MNI space. CSF voxels were excluded on the registered MRF T1, T2, GM, and WM maps using FSL.10 Mean and standard deviation (SD) of MRF values in each ROI were used as the input to ML models. Additionally, based on Gaussian fitting of histogram of voxels in the lesion ROI, long and short components of the fitting, which represented the GM and WM components of the lesion, were calculated, and used as input to the ML models. The same process was performed for HCs to extract MRF values at each ROI to represent normal cortex. To compensate for regional differences, the mean MRF values of all HCs at each ROI were calculated, and used to normalize the MRF values for each individual patient or HC. A total of 16 normalized MRF values were used as features for the input data of ML models (Figure 2).
Multiparametric MRF ML models: Three ML models were generated: FCD vs HC, type II vs type I, and type IIa vs type IIb. To achieve the optimal performance and select the most important features for the models, we performed backward elimination based on Fisher’s score (F-score) between groups using the following equation:
$$$F(i) = \frac{{(\overline{x}_i^{(+)}-\overline{x}_{i})}^{2}+{(\overline{x}_i^{(-)}-\overline{x}_{i})}^{2}}{{\frac{1}{n^{+}-1}\sum_{k=1}^{n^{+}}}{(x_{k,i}^{(+)}-\overline{x}_i^{(+)})}^{2}+{\frac{1}{n^{-}-1}\sum_{k=1}^{n^{-}}}{(x_{k,i}^{(-)}-\overline{x}_i^{(-)})}^{2}}$$$
In this equation, $$$\overline{x_{i}}$$$, $$$\overline{x}_i^{(+)}$$$, and $$$\overline{x}_i^{(-)}$$$ are the average MRF values of the ith feature of the whole, positive, and negative datasets, respectively. $$$\overline{x}_{k,i}^{(+)}$$$ and $$$\overline{x}_{k,i}^{(-)}$$$ are the kth MRF value of ith feature for the positive and negative subjects, respectively. $$$n^{+}$$$ and $$$n^{-}$$$ represent the numbers of positive and negative subjects, respectively. Conventional logistic regression (LR) and support vector machine (SVM) models were generated with 7-fold or 8-fold cross validation for classification between groups using MATLAB. Bootstrapping was used to improve the reliability of the models. Model performance with the highest accuracy was reported.
Results
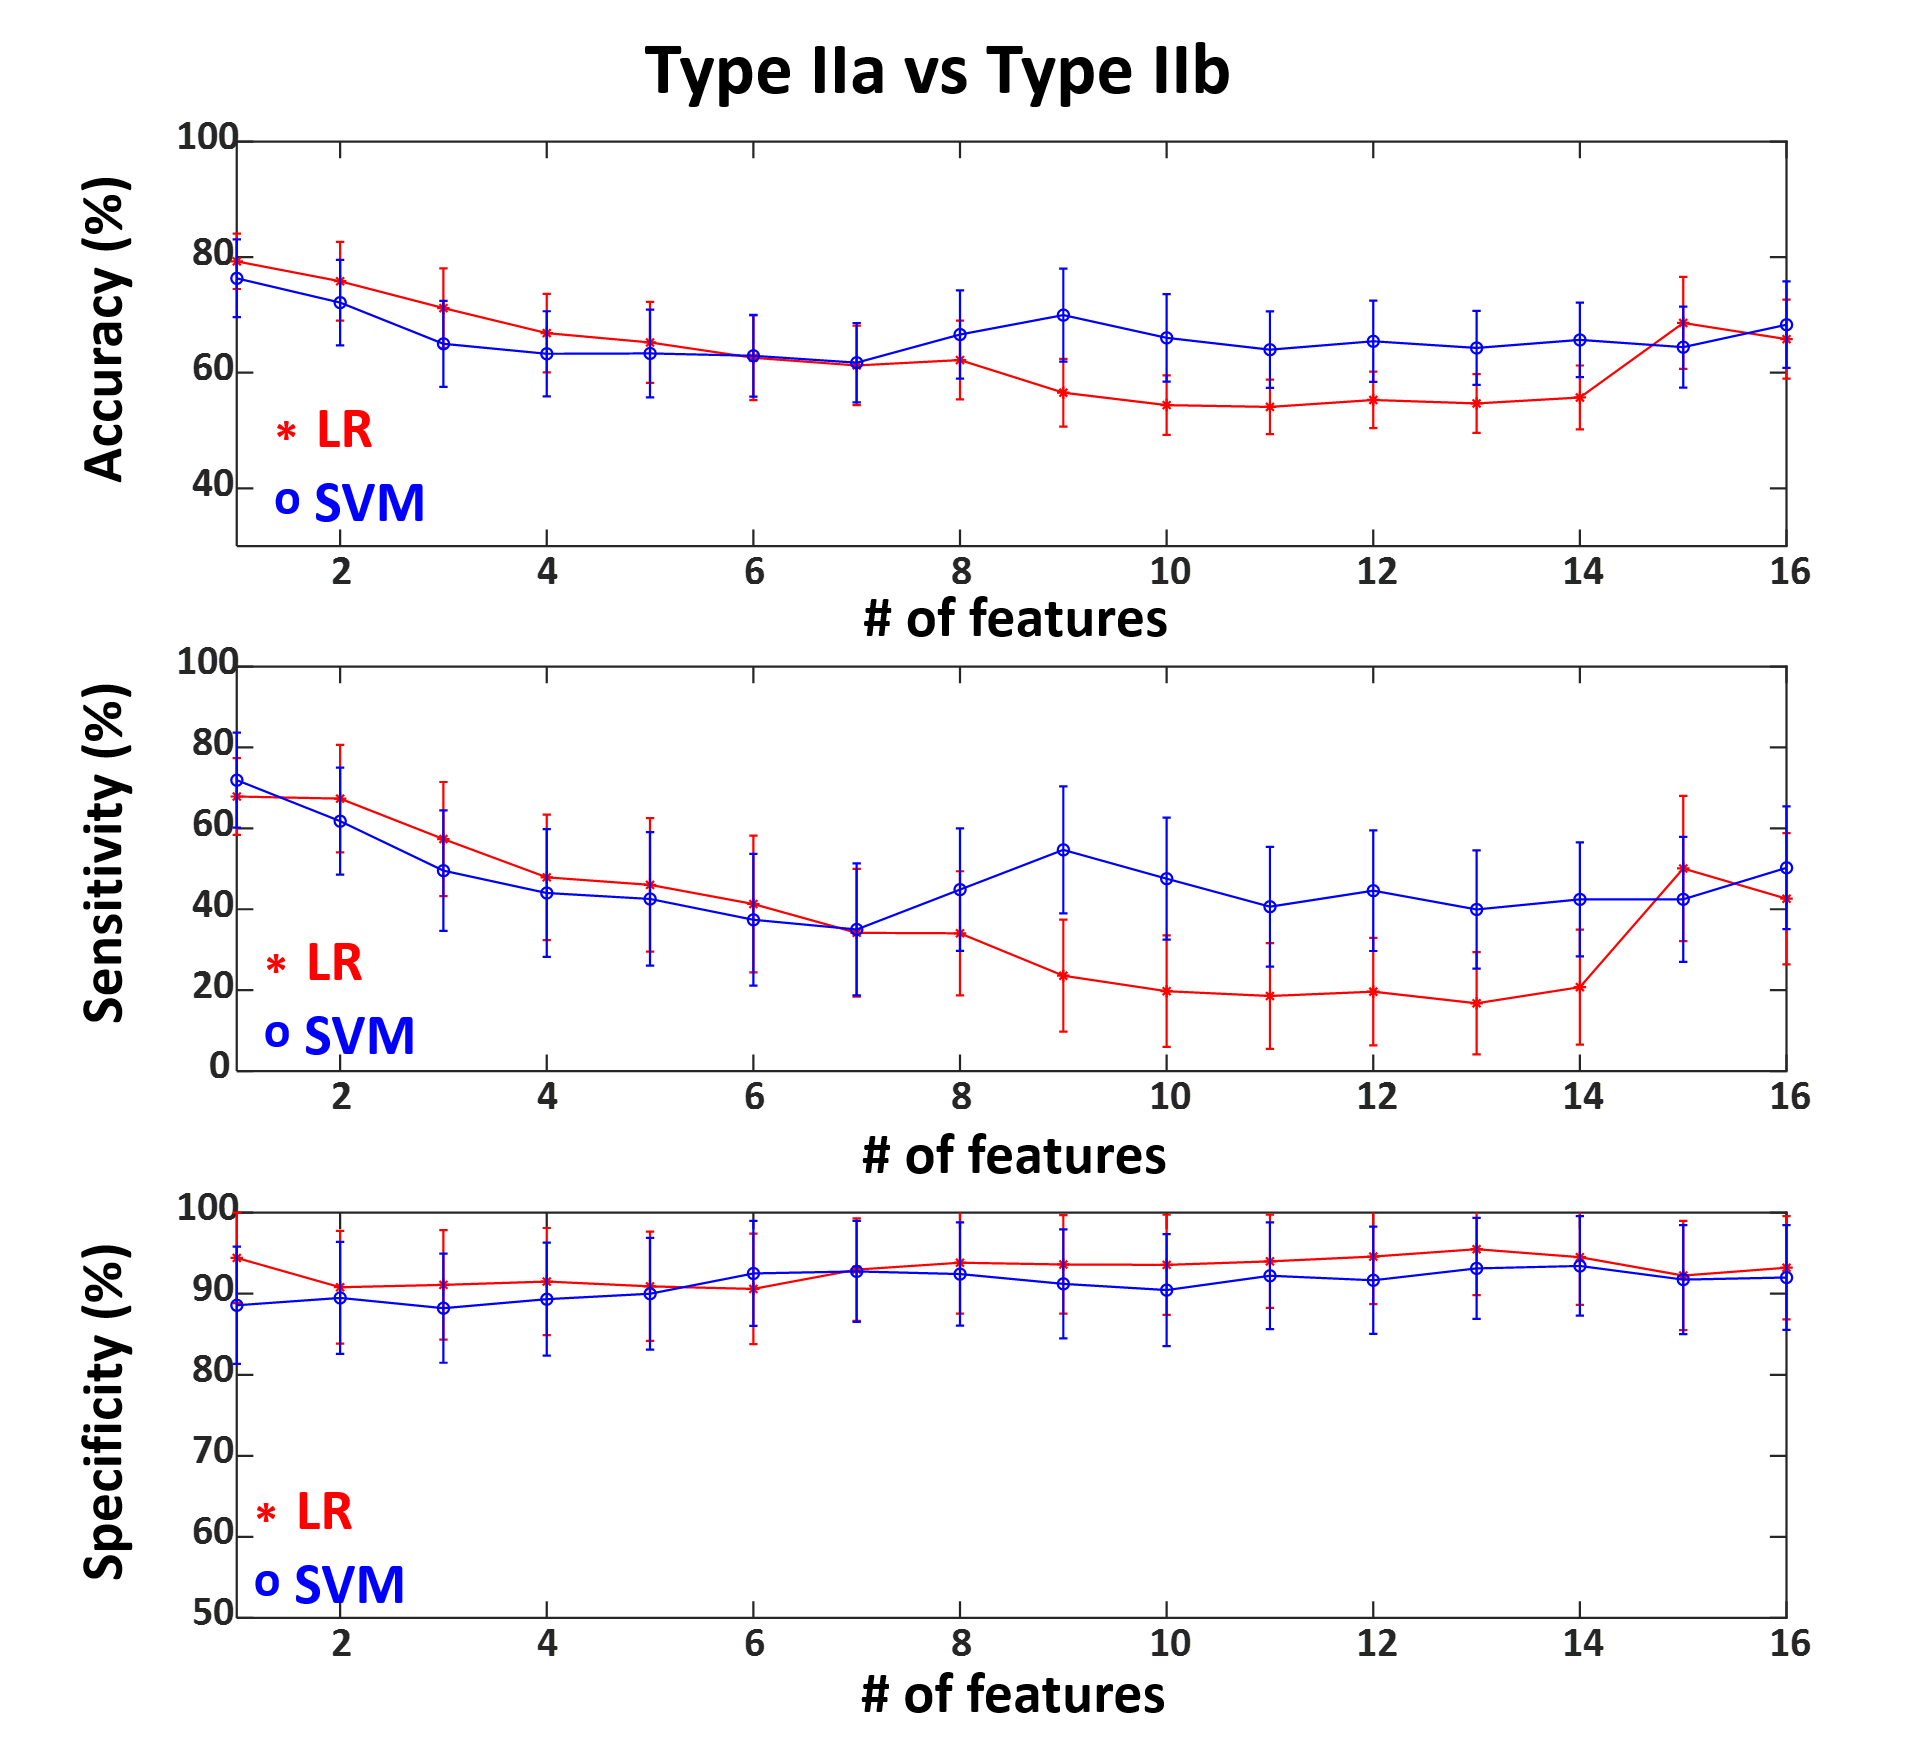
We included 29 patients with pathologically confirmed FCD (type IIa=9, type IIb=9, type I=11), and 49 age-and-gender-matched HCs. Figure 1 shows representative MRF images for FCD type IIb, type IIa and type I. Normalized multiparametric MRF values and F-scores for different classification tasks are summarized in Figure 2. To classify FCD from HC, the LR model with all features showed accuracy, sensitivity and specificity of 96±2%, 93±4% and 100±1%, respectively. The SVM model with 15 features showed 87±3%, 93±5% and 83±4% for the respective values (Figure 3). To classify type I and type II, the LR model with 3 optimal features showed accuracy, sensitivity and specificity of 80±5%, 75±9% and 94±5%, respectively. The SVM model with 5 optimal features showed 90±4%, 91±7% and 92±6% for the respective values (Figure 4). To classify type IIa and type IIb, the LR model with one optimal feature showed accuracy, sensitivity and specificity of 79±5%, 68±10% and 94±6%, respectively. The SVM model with the same feature revealed 76±7%, 72±12% and 89±7% for the respective values (Figure 5).Conclusion
Our study for the first time generated multiparametric MRF-based ML models for FCD subtype characterization. Our data showed stable and high accuracies to classify FCD from normal cortex, FCD type II from type I, and FCD type IIa from type IIb. These findings suggest the usefulness of the multiparametric MRF-based ML approach to contribute to the noninvasive presurgical evaluation for individuals with epilepsy.Acknowledgements
This study is supported by NIH R01 NS109439, R21 EB026764.References
1. Blumcke I, Spreafico R, Haaker G, et al. Histopathological Findings in Brain Tissue Obtained during Epilepsy Surgery. N Engl J Med. 2017;377(17):1648-1656.
2. Blümcke I, Thom M, Aronica E, et al. The clinicopathologic spectrum of focal cortical dysplasias: A consensus classification proposed by an ad hoc Task Force of the ILAE Diagnostic Methods Commission. Epilepsia. 2011;52(1):158-174.
3. Kim DW, Kim S, Park S-H, Chung C-K, Lee SK. Comparison of MRI features and surgical outcome among the subtypes of focal cortical dysplasia. Seizure. 2012;21(10):789-794.
4. Mühlebner A, Coras R, Kobow K, et al. Neuropathologic measurements in focal cortical dysplasias: Validation of the ILAE 2011 classification system and diagnostic implications for MRI. Acta Neuropathol. 2012;123(2):259-272.
5. Hong S-J, Bernhardt BC, Schrader D, Caldairou B, Bernasconi N, Bernasconi A. MRI-Based Lesion Profiling of Epileptogenic Cortical Malformations. In: Navab N, Hornegger J, Wells WM, Frangi A, eds. Medical Image Computing and Computer-Assisted Intervention -- MICCAI 2015. Springer International Publishing; 2015:501-509.
6. Ma D, Gulani V, Seiberlich N, et al. Magnetic resonance fingerprinting. Nature. 2013;495(7440):187-192.
7. Ma D, Jones SE, Deshmane A, et al. Development of high-resolution 3D MR fingerprinting for detection and characterization of epileptic lesions. J Magn Reson Imaging. 2019;49(5):1333-1346.
8. Liao C, Wang K, Cao X, et al. Detection of Lesions in Mesial Temporal Lobe Epilepsy by Using MR Fingerprinting. Radiology. 2018;288(3):804-812.
9. Avants B, Gee JC. Geodesic estimation for large deformation anatomical shape averaging and interpolation. Neuroimage. 2004;23(SUPPL. 1):Suppl 1:S139-150.
10. Zhang Y, Brady M, Smith S. Segmentation of brain MR images through a hidden Markov random field model and the expectation-maximization algorithm. IEEE Trans Med Imaging. 2001;20(1):45-57.
Figures