3340
A global spatially-adaptive method for task fMRI activation analysis with the advantage of alleviated spatial blurring1Cleveland Clinic Lou Ruvo Center for Brain Health, Las Vegas, NV, United States, 2University of Nevada Las Vegas, Las Vegas, NV, United States, 3Cleveland Clinic, Cleveland, OH, United States, 4University of Colorado, Boulder, CO, United States
Synopsis
Accurately localizing brain activation is of great importance for promoting basic science and clinical application of task fMRI data. In this study, we proposed a global and time-efficient way to conduct brain activation analysis, with the property of spatially-adaptive smoothing and determining individual voxel’s activation status with wholebrain fMRI data considered simultaneously. We have demonstrated its advantage over traditional methods in alleviating spatial blurring artifacts.
INTRODUCTION
General linear model (GLM) is a commonly used univariate method in task fMRI analysis to detect brain activation map, which was repeatedly and independently carried out at individual voxels to determine their activation status. Prior to conducting GLM analysis, isotropic Gaussian smoothing (GS) is usually applied to improve the signal-to-noise ratio (SNR) of fMRI time series, with the cost of blurring gray matter activation patterns into white matter regions. To alleviate the spatial blurring, multivariate approaches, such as canonical correlation analysis (CCA) [1], were introduced as a replacement of the traditional univariate approach. A set of spatially oriented filters were used in these multivariate approaches to estimate the optimal spatial smoothing either locally (repeated for individual voxel) [2-4] or globally (estimate spatial smoothing for all voxels in a single run) [4], the activation status was determined for each voxel separately with only neighboring time series considered. In this study, we proposed a global kernel CCA (KCCA) method with steerable filters to estimate oriented spatial smoothing and activation status for all voxels in the brain in a single run, which had whole brain time series considered simultaneously and avoided repetitive individual-voxel activation analysis, which could potentially reduce false active voxels resulting from multiple tests.METHODS
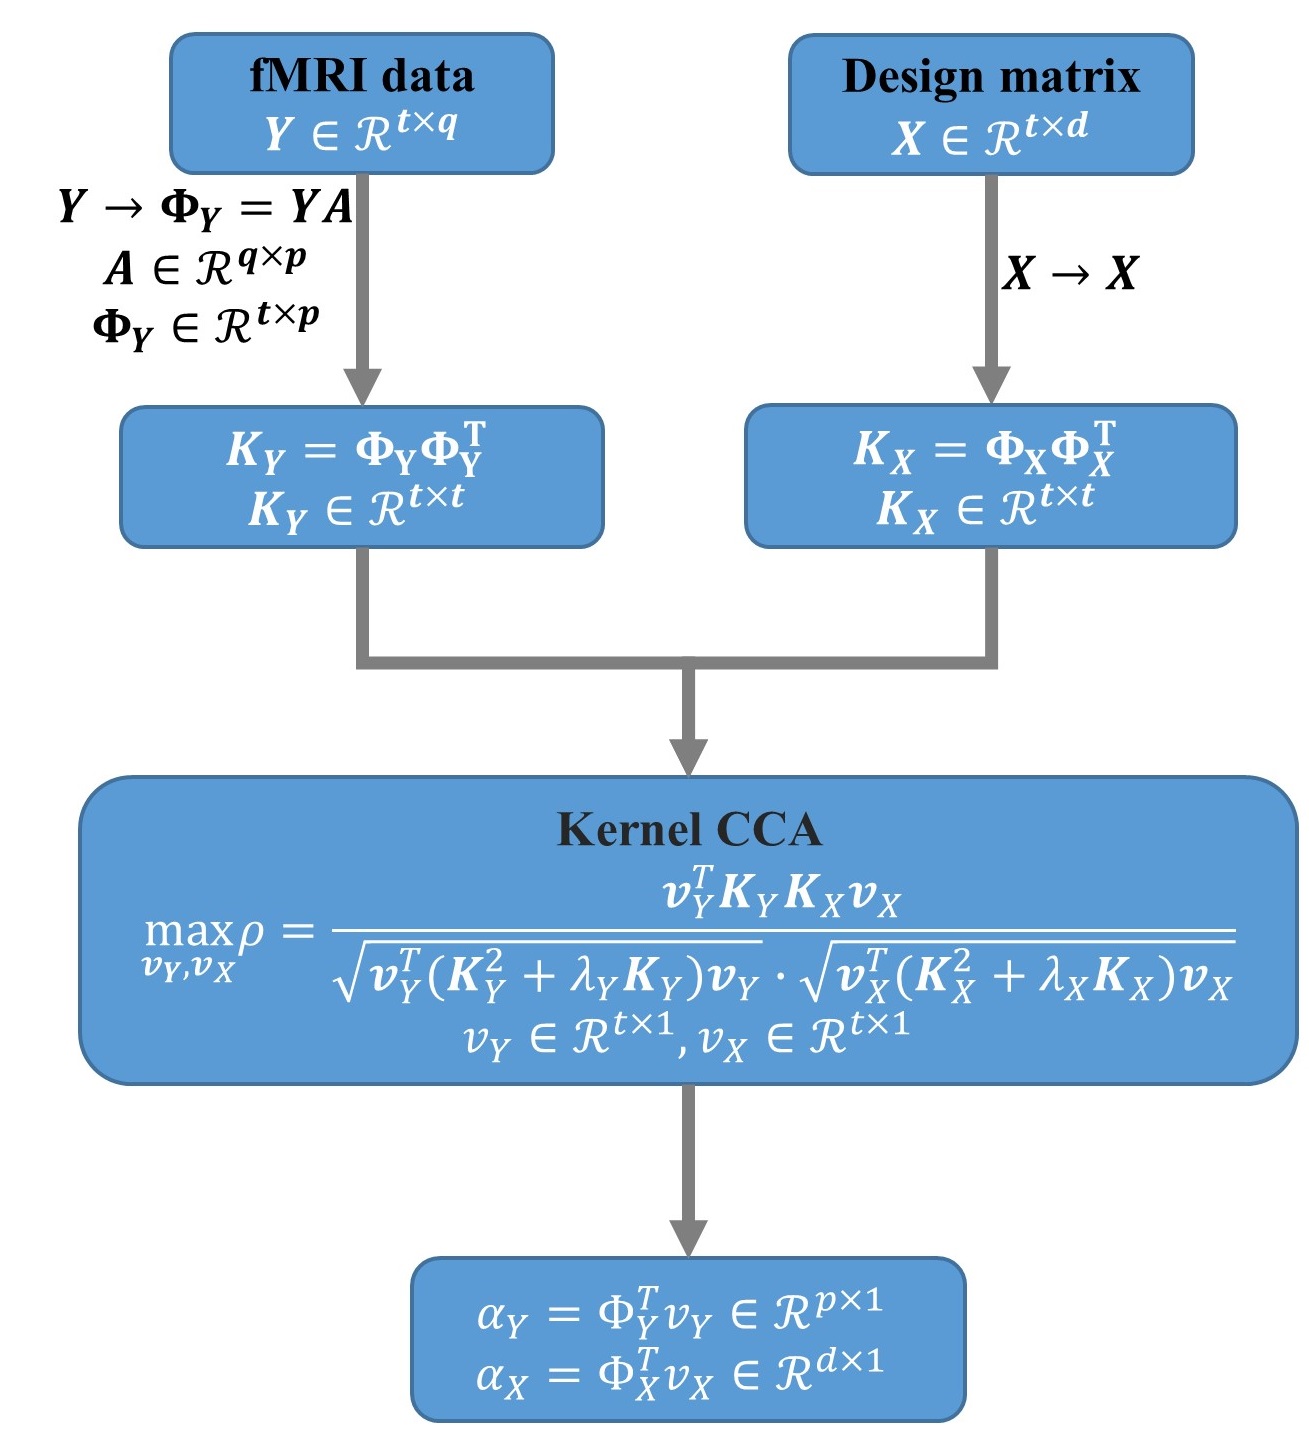
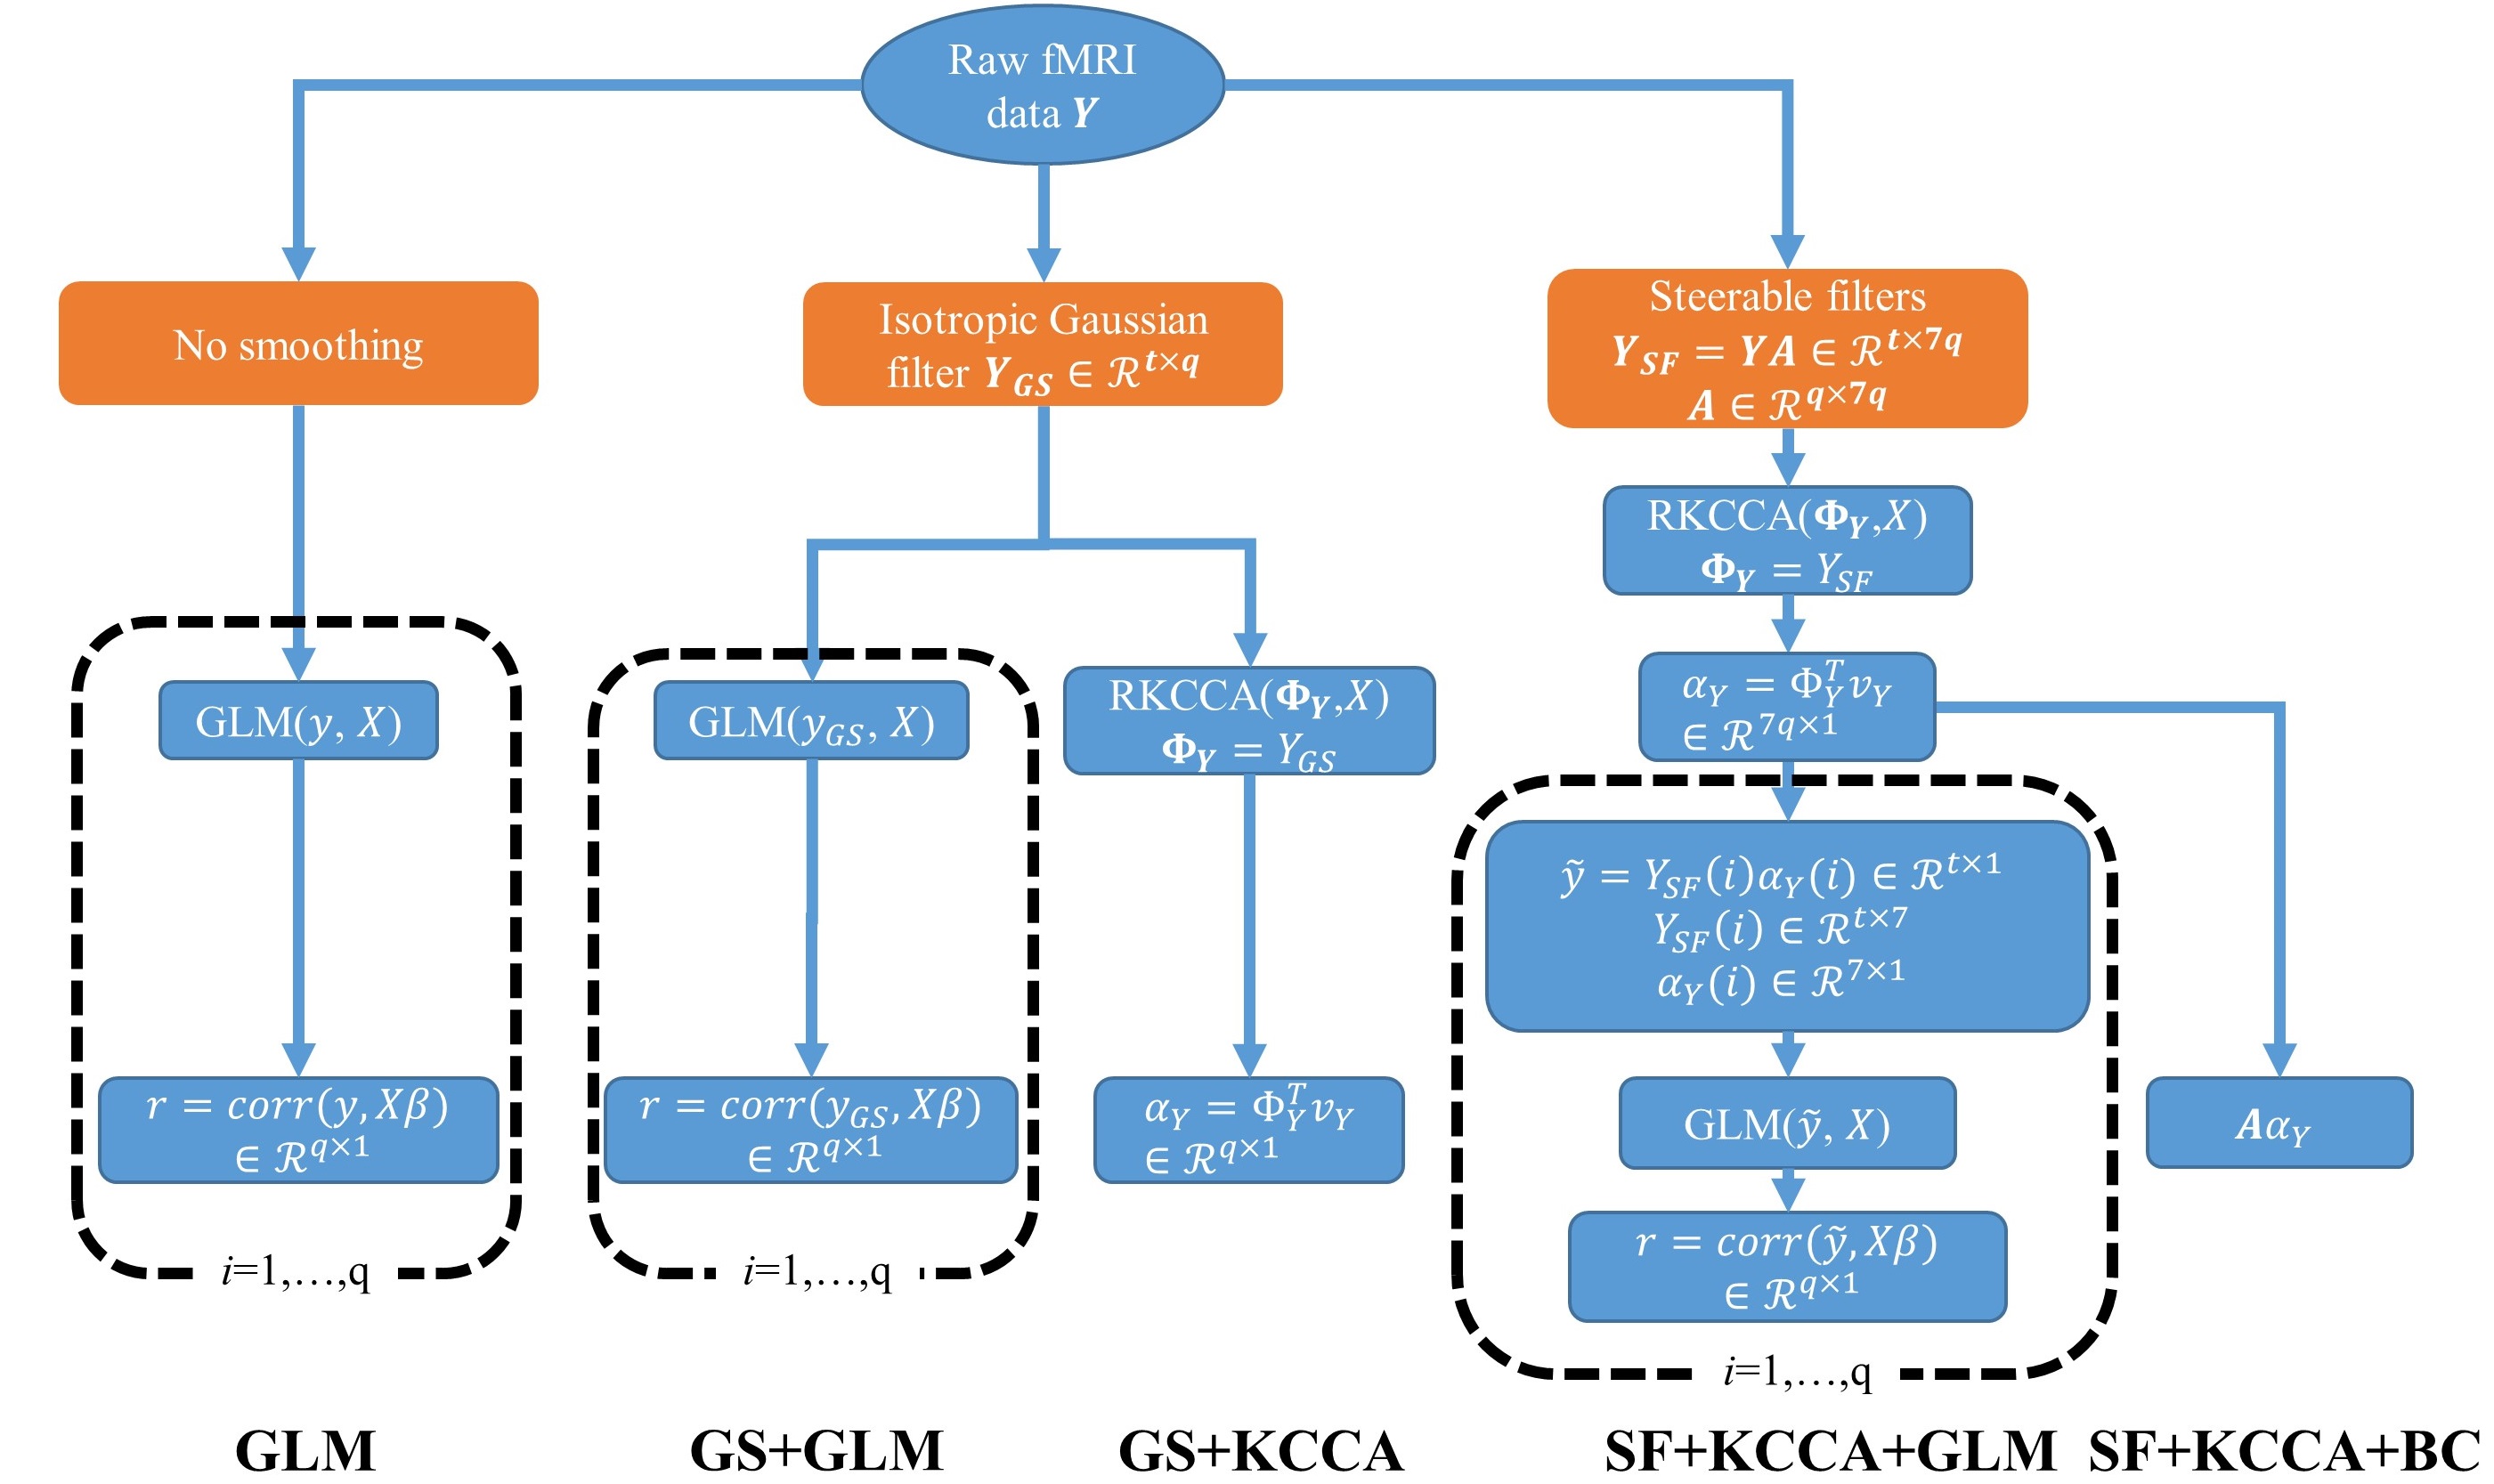
The working memory task fMRI data used in this study were obtained from the Human Connectome Project (https://www.humanconnectome.org/) [5]. 87 male participants with age 26-30y were included. fMRI data were acquired with 405 time frames from a gradient-echo fast EPI sequence with parameters: multiband factor 8, TR/TE=720/33.1 ms; flip angle=52 degrees; 72 slices; spatial resolution=2 mm x 2 mm x 2 mm and imaging matrix=104 x 90. The task represents an event-related design consisting of targets, non-targets, and lures contrasts. The minimally preprocessed fMRI data (in standard MNI space) after additional linear detrending step were treated as raw fMRI data (denoted as $$$Y\in\Re^{t\times q}$$$) in our analysis. Different from CCA directly associating two variables, KCCA was proposed to associate two variables after transforming original variables to a different feature space. Both GS and SF of raw fMRI data can be treated as a linear transformation of original data to a new feature space ($$$\Phi_Y=YA\in\Re^{t\times p}, A\in\Re^{q\times p}$$$), although the output dimensions are different because there is one spatial filter in GS (p=q) but there are seven oriented filters in SF (p=7q) [1]. FWHM=8mm was applied for both GS and SF. In our case, the two inputs to KCCA are the spatially-filtered whole brain fMRI data ($$$\Phi_Y$$$) and the task design matrix (X), which output $$$v_Y, v_X\in\Re^{t\times 1}$$$ to maximize the correlation (see Figure 1). Regularization terms $$$\lambda_X$$$ and $$$\lambda_Y$$$ were introduced to avoid overfitting and optimized with a permutation analysis. When GS was applied with KCCA (GS+KCCA), $$$\alpha_Y\equiv\Phi_Yv_Y$$$ was of dimension $$$q\times 1$$$ and could be treated as the activation map. However, $$$\alpha_Y$$$ was of dimension $$$7q\times 1$$$ in SF+KCCA and could not assign a single scalar to indicate individual voxel’s activation status. One way to overcome the issue is to treat $$$\alpha_Y$$$ as the weight of filtered time series and then conduct GLM analysis to get activation map with the weighted summation at filtered time series (SF+KCCA+GLM). Alternatively, considering that each row in $$$A$$$ indicates the weights of one voxel contributing to the wholebrain filtered time series, thus $$$A\alpha_Y$$$ could be treated as a more comprehensive way to assess brain activation (SF+KCCA+BC). Five different approaches were used to generate activation maps (see Figure 2). Each activation map were ranked and converted to percentile with sign ignored in the comparison.RESULTS
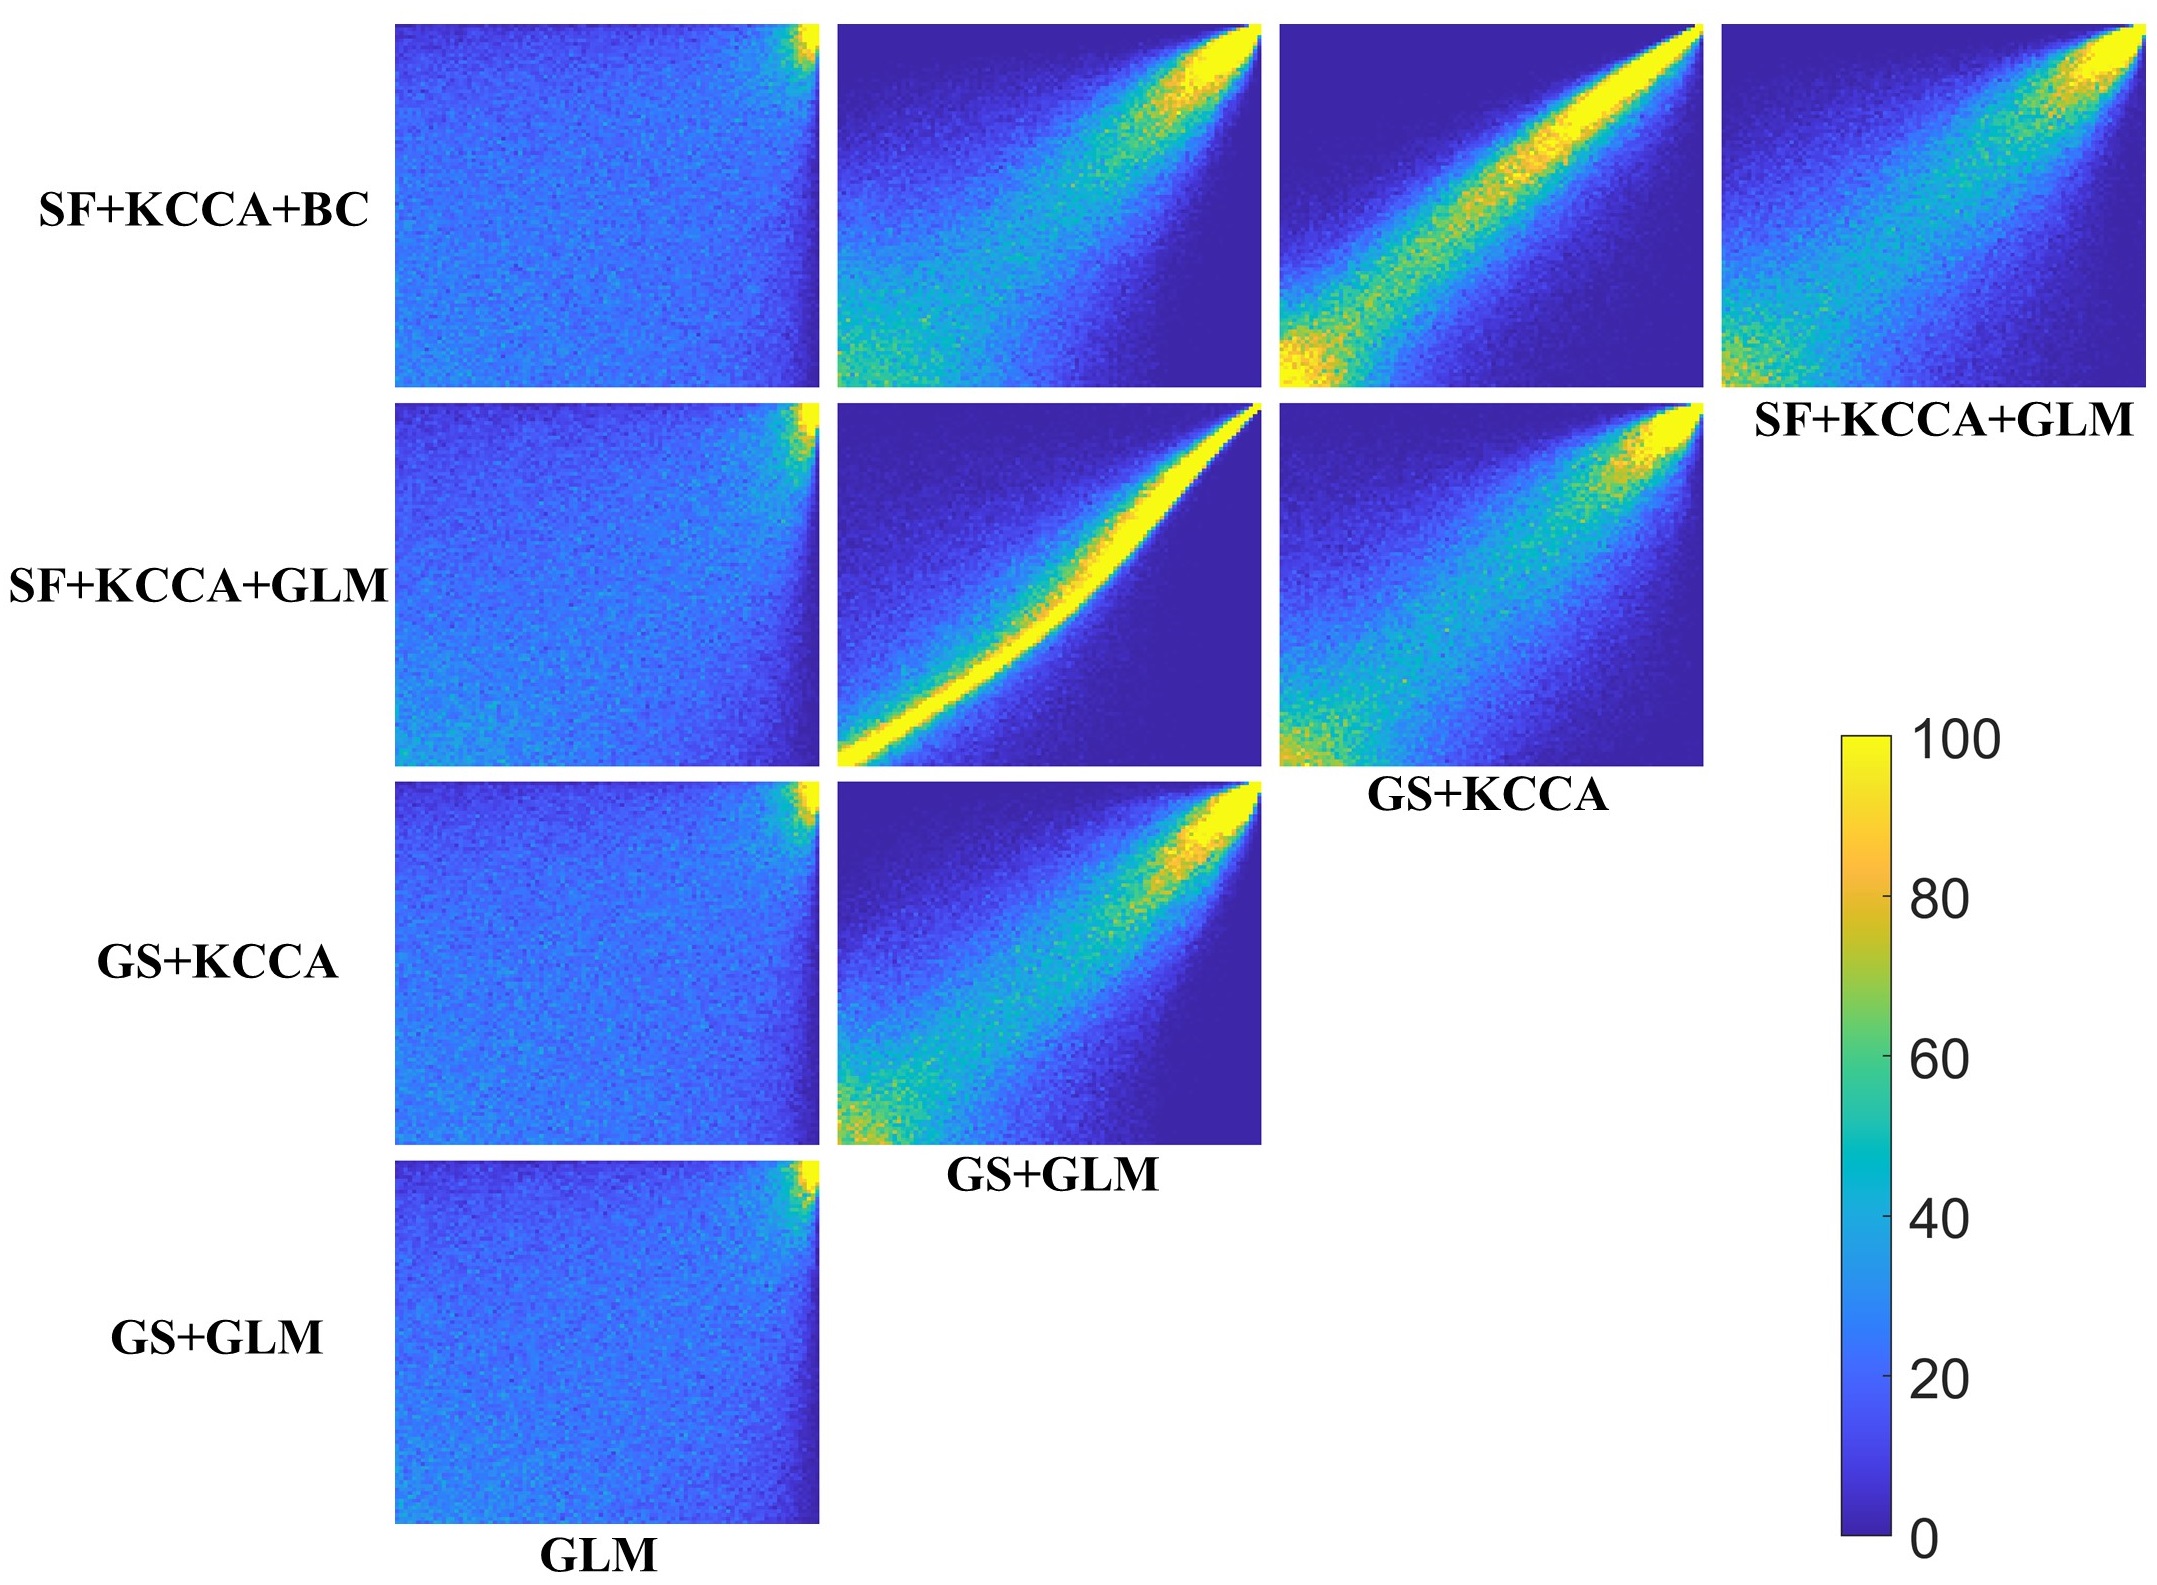
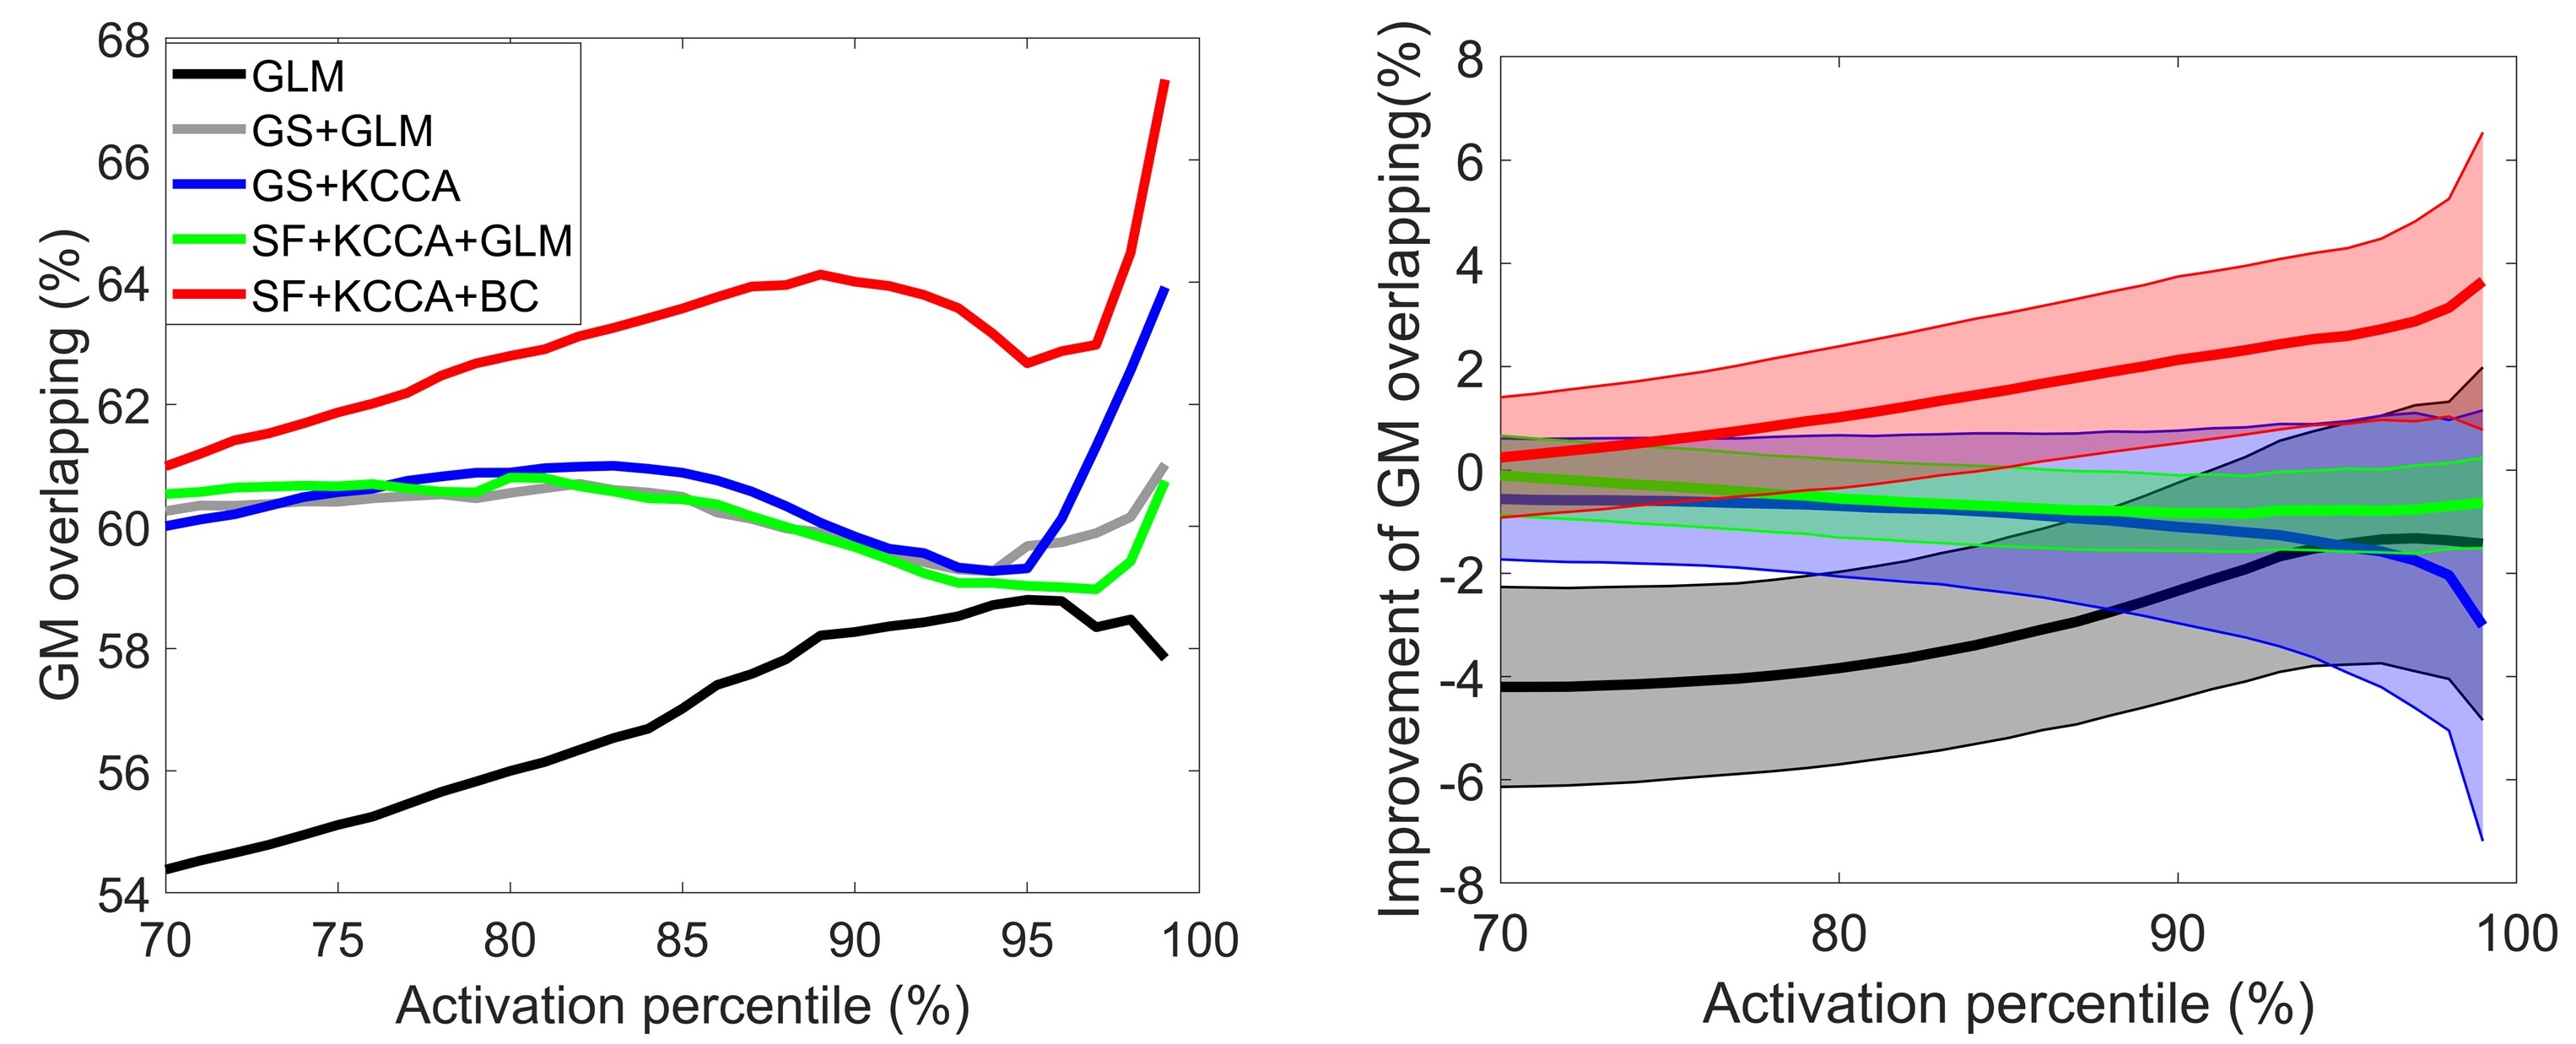
2D histogram of the activation maps were shown in Figure 3, majority of the highly active voxels were consistently determined as highly active across different analysis methods (bright top right corner), with discrepancy mainly observed at less active voxels. We then further assessed the percentage of voxels within gray matter mask thresholded at different activation percentile levels ranging from 70 to 99 percentile. Figure 4a showed the result from an individual subject, demonstrating the highest gray matter overlapping achieved by SF+KCCA+BC. Figure 4b showed the group mean improvement of gray matter overlapping over most commonly used GS+GLM method, with 95% confidence interval marked in shaded area, which indicated that SF+KCCA+BC consistently had highest gray matter overlapping.DISCUSSION
Accurately localizing brain activation is of great importance for promoting basic science and clinical application of task fMRI. The proposed SF+KCCA+BC method provided a global and time-efficient way to conduct brain activation analysis, with the property of spatially-adaptive smoothing and determining individual voxel’s activation status with wholebrain fMRI data considered simultaneously. We demonstrated that a global analysis approach without adaptive spatial smoothing (GS+KCCA) or a spatially-adaptive but local activation analysis approach (SF+KCCA+GLM) is not sufficient to alleviate the spatial blurring artifact. This finding justified the necessity of implementing spatial constraints in local activation analysis methods to reduce spatial blurring [3, 4] and demonstrated a novel spatially-adaptive global method for task fMRI activation analysis without requiring spatial constraints.CONCLUSION
We proposed a global spatially-adaptive method for fMRI activation analysis and demonstrated its advantage in alleviating spatial blurring artifact.Acknowledgements
This research project was supported by the NIH (Grant No. 1RF1AG071566, COBRE 5P20GM109025 and NeVADRC; P20-AG068053), Cleveland Clinic Keep Memory Alive Young Investigator Award, a private grant from Stacie and Chuck Matthewson, a private grant from Peter and Angela Dal Pezzo, and a private grant from Lynn and William Weidner. HCP funding was provided by the National Institute of Dental and Craniofacial Research (NIDCR), the National Institute of Mental Health (NIMH), and the National Institute of Neurological Disorders and Stroke (NINDS). HCP data are disseminated by the Laboratory of Neuro Imaging at the University of Southern California.References
1. Friman, O., et al., Detection of neural activity in functional MRI using canonical correlation analysis. Magnetic Resonance in Medicine: An Official Journal of the International Society for Magnetic Resonance in Medicine, 2001. 45(2): p. 323-330.
2. Cordes, D., et al., Optimizing the performance of local canonical correlation analysis in fMRI using spatial constraints. Human brain mapping, 2012. 33(11): p. 2611-2626.
3. Zhuang, X., et al., A family of locally constrained CCA models for detecting activation patterns in fMRI. NeuroImage, 2017. 149: p. 63-84.
4. Yang, Z., et al., 3D spatially-adaptive canonical correlation analysis: Local and global methods. Neuroimage, 2018. 169: p. 240-255.
5. Barch, D.M., et al., Function in the human connectome: task-fMRI and individual differences in behavior. Neuroimage, 2013. 80: p. 169-189.
Figures