3339
BOLD response in squirrel monkey brains evoked by green light without exogenous opsin1Department of Biomedical Engineering, Vanderbilt University, Nashville, TN, United States, 2Vanderbilt University Institute of Imaging Science, Vanderbilt University Medical Center, Nashville, TN, United States, 3Department of Radiology and Radiological Sciences, Vanderbilt University Medical Center, Nashville, TN, United States, 4Department of Physics and Astronomy, Vanderbilt University, Nashville, TN, United States, 5Department of Molecular Physiology and Biophysics, Vanderbilt University, Nashville, TN, United States
Synopsis
Optogenetic stimulation combined with MRI detection of blood oxygenation level dependent (BOLD) effects has been developed as a powerful tool to delineate brain circuits. Opsin targeting specific cell types induce neural activity when irradiated with light at a specific wavelength. We detected robust BOLD effects in secondary somatosensory cortex (S2) and downstream interconnected caudate putamen (CPu) of monkey brains from irradiation with low-intensity green light without exogenous green light specific opsin, suggesting hemodynamic changes can be stimulated without any associated neural activity.
Introduction
Optogenetic studies of brain circuits rely on the selective excitation of cells that have been targeted by a virus that introduces a wavelength-specific opsin1. The opsin may respond only to blue laser light, so a control condition is typically to irradiate with green light that is not expected to elicit any effects on BOLD images. Previous studies2–4 have shown that low-energy laser therapy (LELT) or light-emitting diodes (LED) can cause or enhance vasodilation5, increasing the level of oxygen content of tissue . We report our detection of robust BOLD signal changes in monkey brains produced by green light without exogenous green light specific opsin. These results suggest caution should be shown in the interpretation of optogenetic studies.Materials and Methods
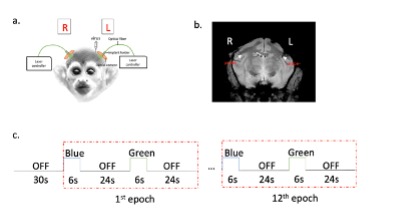
a. Virus injection, optical insertion:Two squirrel monkeys were transfected using AAV5/9-CaMKIIa-ChR2 in the secondary somatosensory cortex (S2) of the left side brain to allow blue light stimulation of neural cells engaged in the network between S2 and other regions. Optical fibers were then inserted into both left (virus) and right (control) sides (Fig. 1a and b). The wavelengths of blue light and green light in this study are 473nm and 561nm respectively.
b. Animal Setup and Data Acquisition:
Functional BOLD-sensitive and higher resolution (in plan resolution 0.11×0.11 mm2) T1-weighted anatomic MR images were acquired with a 9.4T MRI spectrometer (Varian/Agilent Inc.) using a quadrature head coil. BOLD images were obtained using a 4 shots T2*-weighted 2D GE-EPI sequence (TR = 750ms, TE = 10.8 ms, in plan resolution 0.43×0.43 mm2, FOV 55×55 mm2,24 slices, thickness 1 mm, 250 volumes). Laser stimulation via the optical fibers was delivered as shown in Fig.1c: a 30s baseline was followed by 12 epochs of 6s ON and 24s OFF light stimuli. Blue and green light stimuli were interleaved and both the left and right side were treated separately. At least two runs for different power of left-side stimulus and right-side stimulus. To minimize any possible influence of thermal heating of the brain, MRI thermometry7-9 was used to measure the temperature around the optical probe for different power levels of the laser.
c. Data processing:
The standard pre-processing of fMRI images was performed using spm12 in MATLAB (The MathWorks Inc., USA) similar to our previous study10. Slice timing correction was first applied, followed by a 2D motion correction slice by slice. For each run the “nuisance” signals from white matter and muscle were regressed out in a general linear model (GLM). RETROICOR11 was then used to correct for physiological noise. The GLM was carried out using FEAT (FMRI Expert Analysis Tool), part of the FSL toolbox12. A bandpass filter of 0.01-0.25 Hz was applied to the time series data. For each run, activated voxels were defined as those showing stimulus‐related signal changes at a statistically significant level of p < 0.05 with cluster correction using gaussian random field (GRF) theory (FSL). Second group level analysis was also performed using FSL.
Results
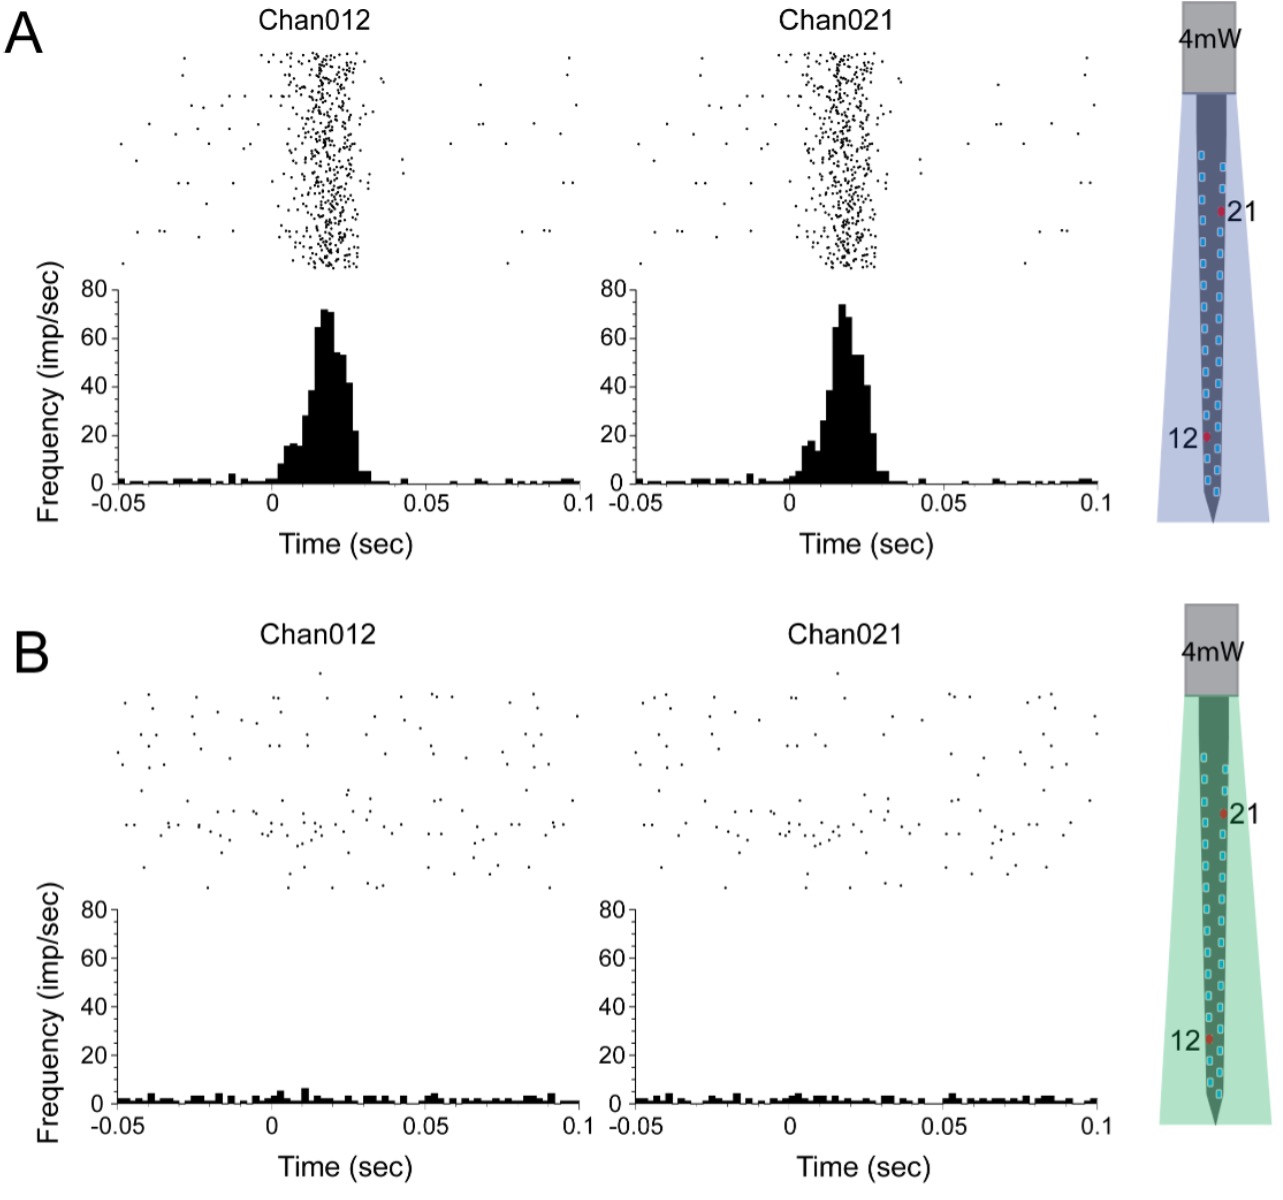
Thermometry measured temperature increases < ~0.02℃ around the probe at a power setting of 20mW. No temperature increase is detected in the power settings of 1mW (31.8 mW/mm2), 2mW (63.69 mW/mm2) and 4mW (129 mW/mm2).These low power settings were then used in the study.The selectivity to blue light on the left side at 4mW power setting was established using electrophysiological recordings of neural activity evoked by blue (but not green) light stimulation (Fig. 2).
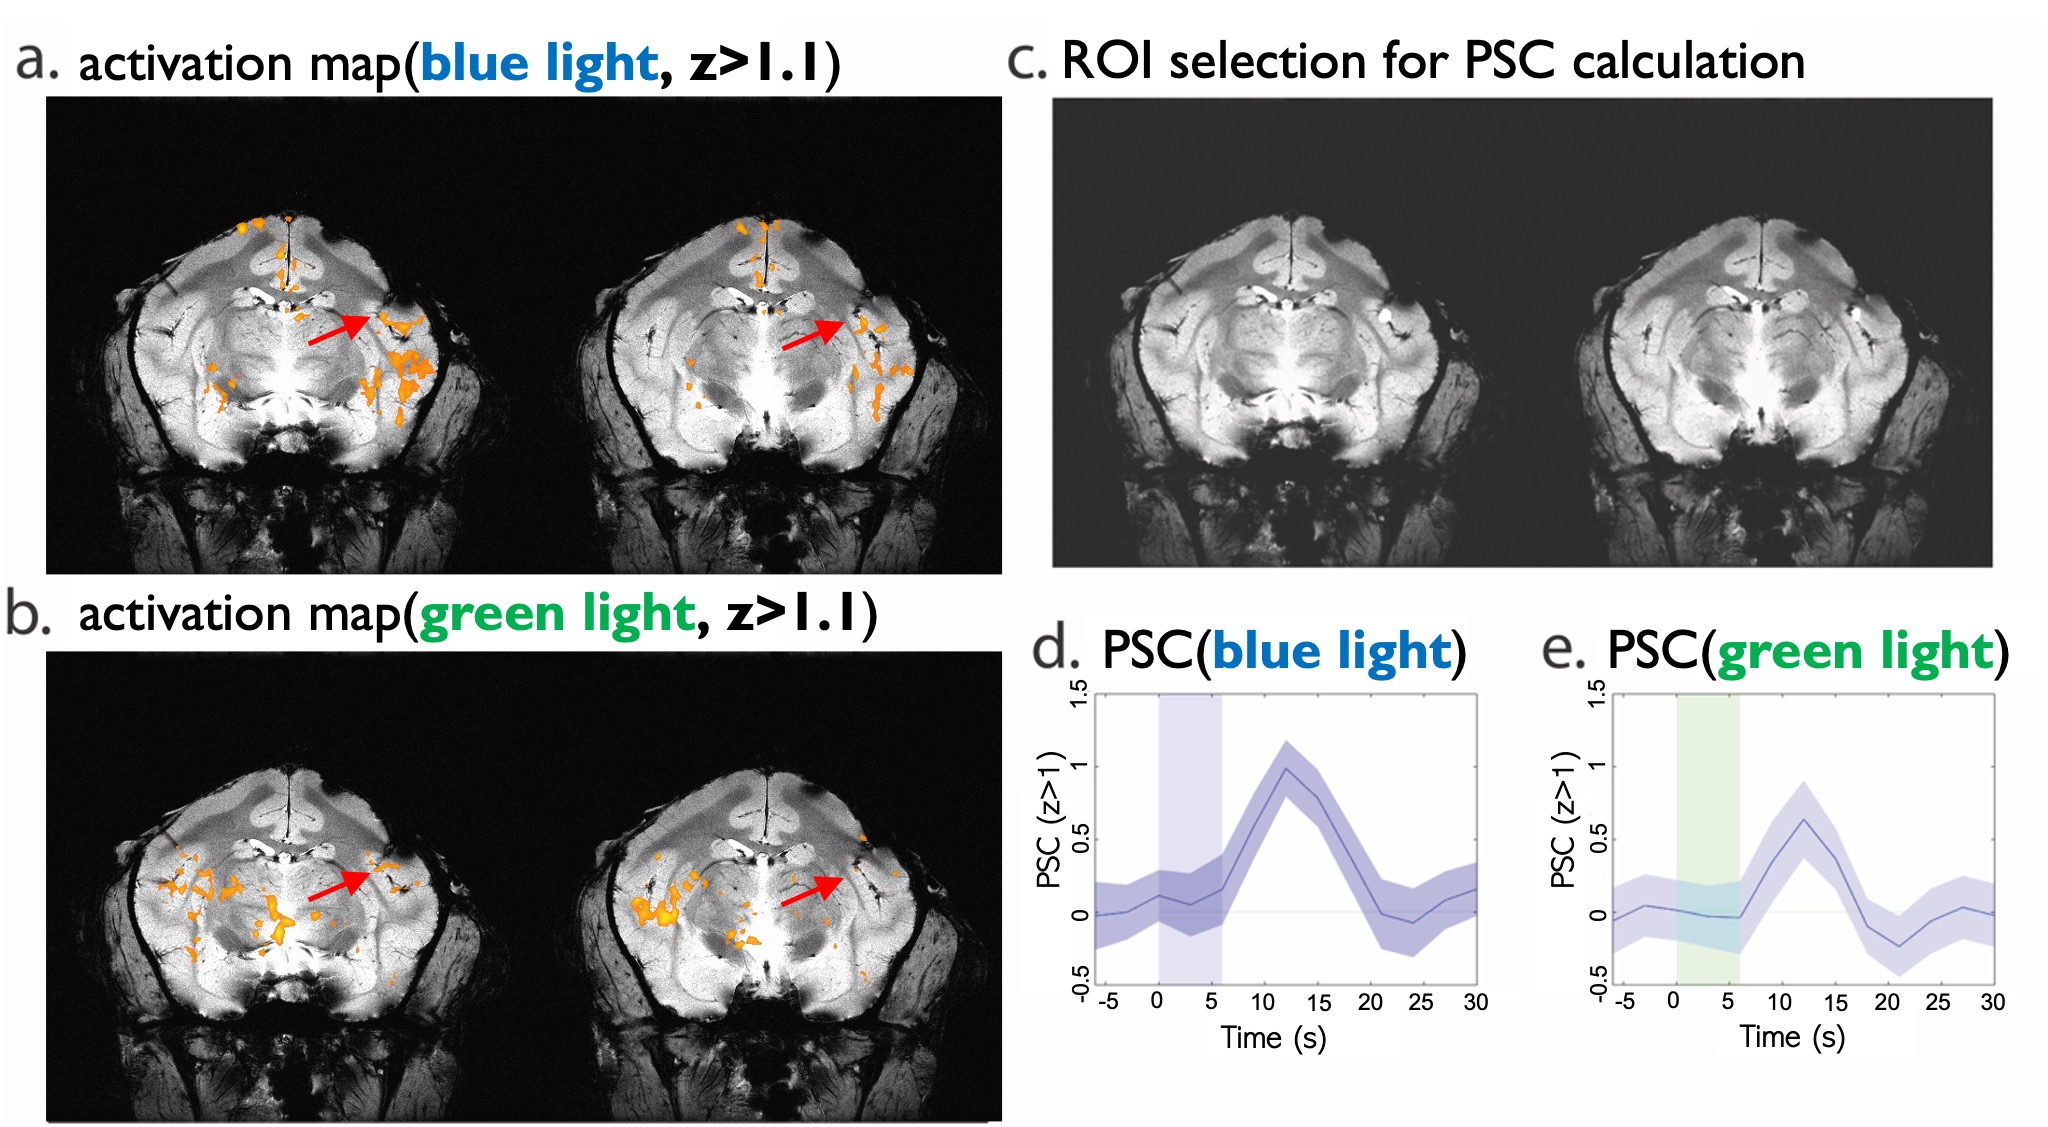
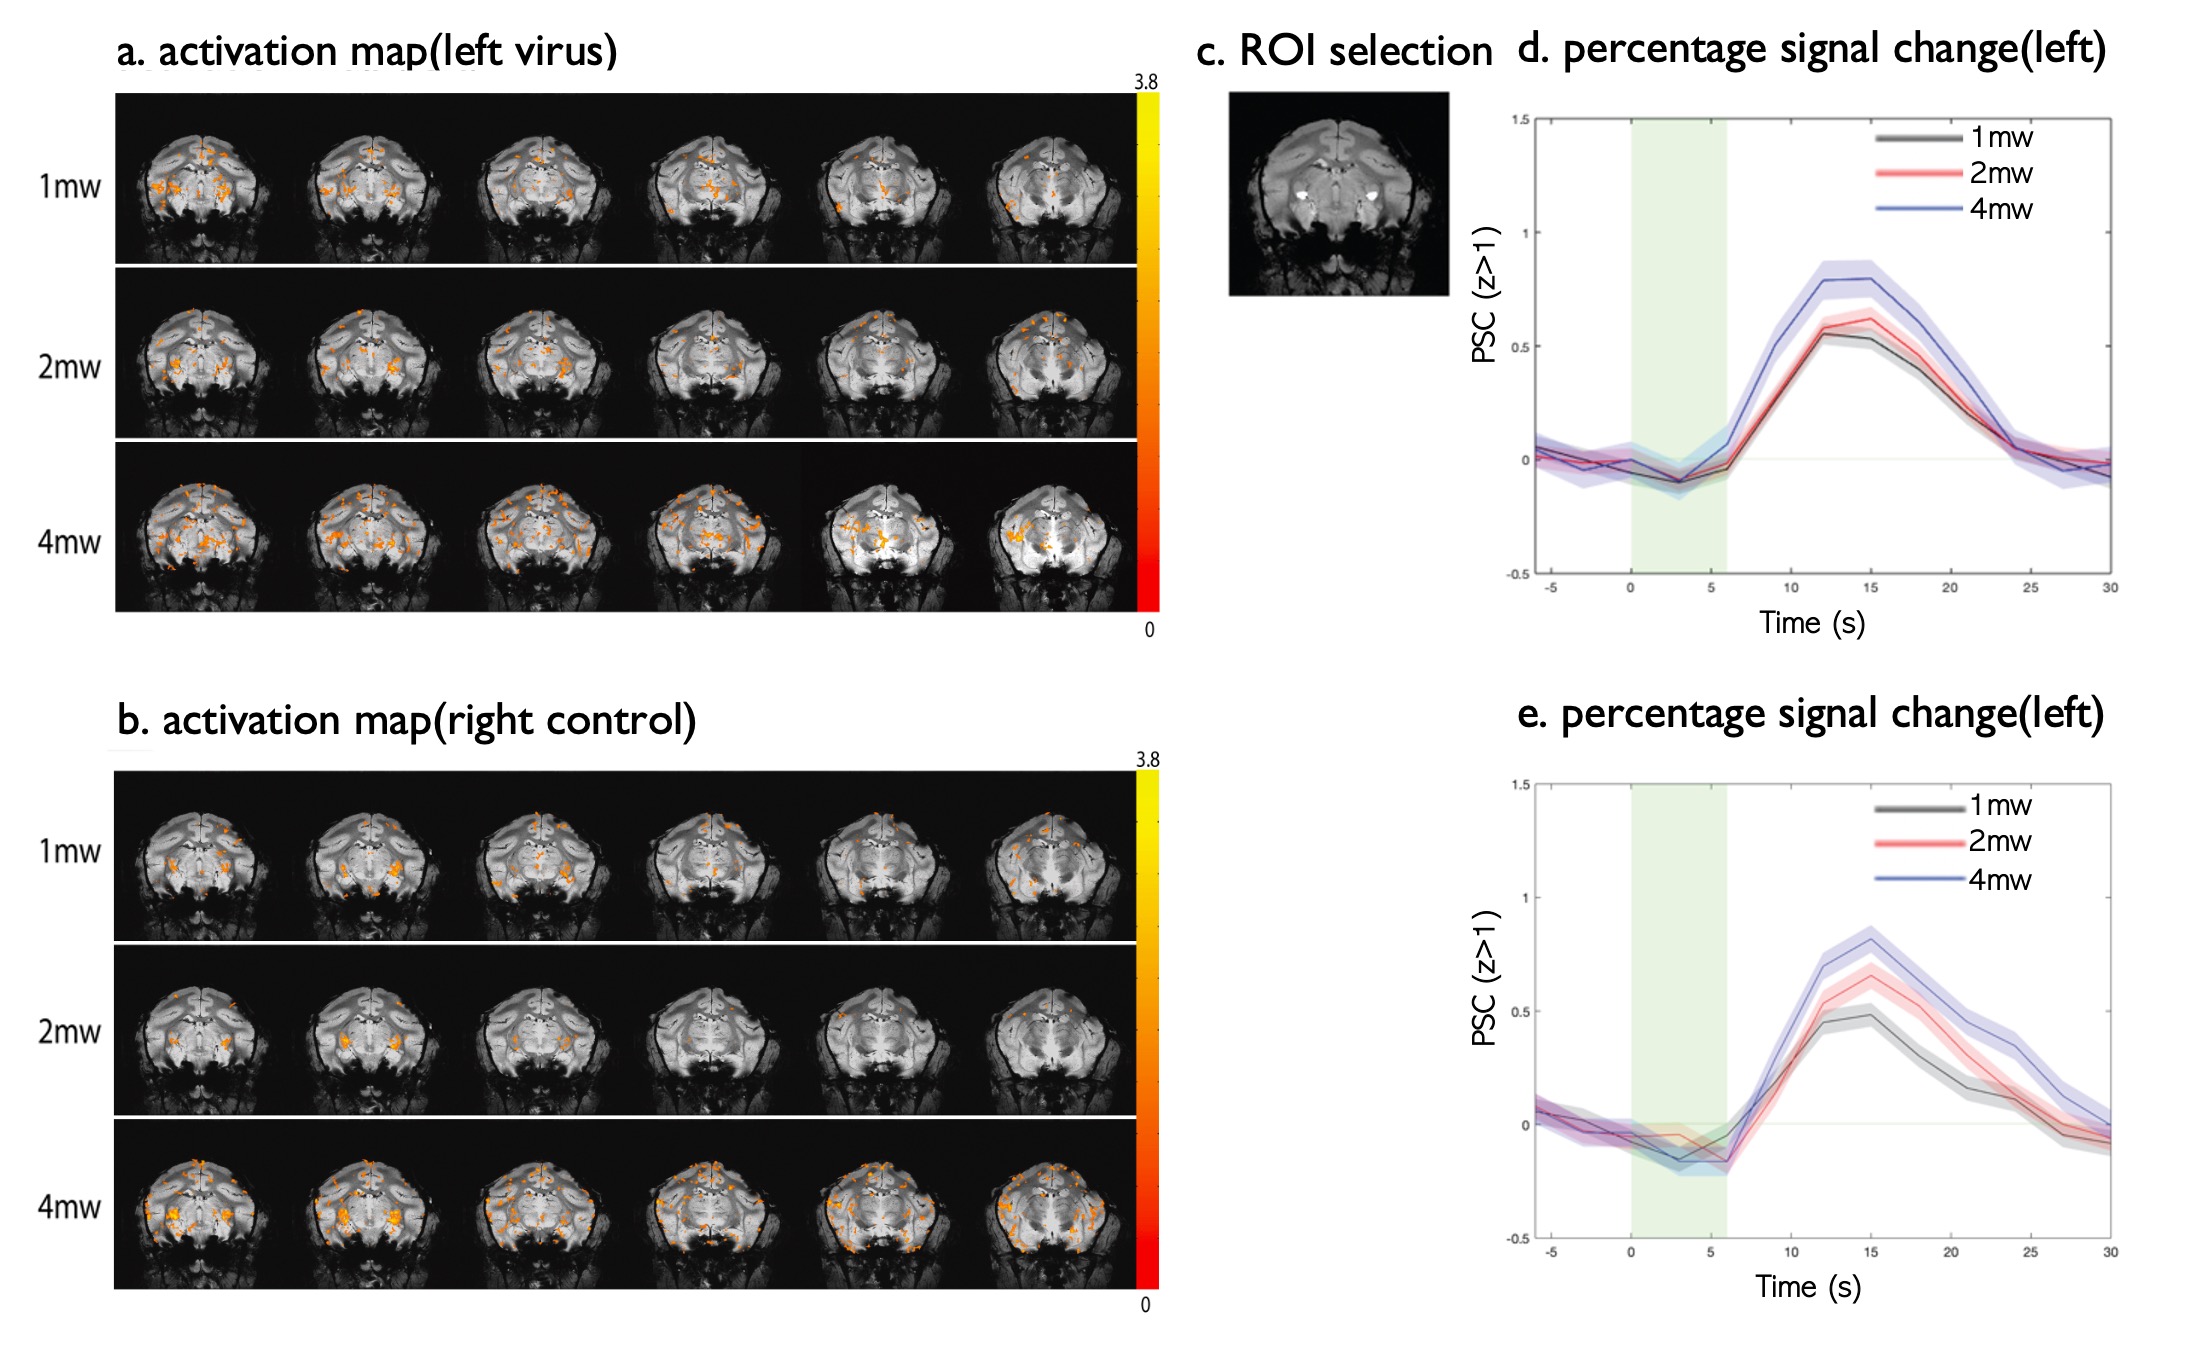
Activation maps (converted to z scores, threshold z > 1, p < 0.05 with multiple comparison correction) overlayed onto structural images are shown in Fig. 3 (a and b) and Fig. 4 (a and b). There is BOLD response in S2 region under green light (Fig. 3c) at 4mW power setting when there is no neuron spiking activity evoked by green light (Fig. 2B). Robust BOLD signal increases were also detected around the caudate putamen (CPu) region. Based on these activation maps, an ROI was selected around the S2 region (Fig.3 c) and CPu region (Fig.4c). The percentage changes (PSC, %S) of BOLD signals relative to the baseline signal of the ROI were then calculated for S2 region (4mW, blue and green light, Fig.3d and 3e) and CPu region (1mW, 2mW and 4mW, green light, left and right, Fig. 4d and 4e). The shaded area around the mean signal represents the standard deviation. In S2 region, there is ~1% PSC under blue light and ~0.7% under green light. And there is clearly a variation in response in CPu to different powers (1mW, 2mW and 4mW) of green light in both left and right sides. The PSC for 4mW gave the strongest BOLD response.
Conclusions
We detected robust BOLD signal in S2 region and CPu region of squirrel monkey in response to green light at low power settings in which thermal effects were negligible. The factors that cause a large artery to develop into a more or less constant shape are not completely understood. This effect occurred in regions without any exogenous opsin and under conditions that elicited no electrophysiological (spiking) response. This suggests that optical stimulation of brain can produce BOLD effects without changing levels of neural activity.Acknowledgements
We acknowledge the support of NIH grants R01 NS07868, U18 EB 029351, and R01 EB 028773. Special thanks to Dr. Arabinda Mishra for his help with fMRI data pre-processing.References
1. Carter, M. E. & de Lecea, L. Optogenetic investigation of neural circuits in vivo. Trends Mol. Med. 17, 197 (2011).
2. Ihsan, F. R. M. Low-level laser therapy accelerates collateral circulation and enhances microcirculation. Photomed. Laser Surg. 23, 289–294 (2005).
3. Schindl, A., Merwald, H., Schindl, L., Kaun, C. & Wojta, J. Direct stimulatory effect of low-intensity 670 nm laser irradiation on human endothelial cell proliferation. Br. J. Dermatol. 148, 334–336 (2003).
4. M, S. et al. Effects of 780 nm diode laser irradiation on blood microcirculation: preliminary findings on time-dependent T1-weighted contrast-enhanced magnetic resonance imaging (MRI). J. Photochem. Photobiol. B. 54, 55–60 (2000).
5. Maegawa, Y., Itoh, T., Hosokawa, T., Yaegashi, K. & Nishi, M. Effects of near-infrared low-level laser irradiation on microcirculation. Lasers Surg. Med. 27, 427–437 (2000).
6. VP Zuev, G. R. The use of laser irradia-tion in complex treatment of patients with maxillofacial odonto-genic inflammatory diseases. First Clinical and ScientificConference of Russian State Medical University. 28–30 (1992).
7. Rieke, V. et al. Comparison of temperature processing methods for monitoring focused ultrasound ablation in the brain. J. Magn. Reson. Imaging 38, 1462–1471 (2013).8. WA, G. et al. Hybrid referenceless and multibaseline subtraction MR thermometry for monitoring thermal therapies in moving organs. Med. Phys. 37, 5014–5026 (2010).
9. Huiwen Luo, Zhangyan Yang, Pai-feng Yang, Feng Wang, Jamie L Reed, Li Min Chen, John C. Gore, W. A. G. Detection of laser-associated heating in the brain during simultaneous BOLD-fMRI and optogenetic stimulation. ISMRM. submitted, (2022).
10. Mishra, A. et al. Functional connectivity with cortical depth assessed by resting state fMRI of subregions of S1 in squirrel monkeys. Hum. Brain Mapp. 40, 329 (2019).
11. Glover, G. H., Li, T. Q. & Ress, D. Image-based method for retrospective correction of physiological motion effects in fMRI: RETROICOR. Magn. Reson. Med. 44, 162–167 (2000).
12. SM, S. et al. Advances in functional and structural MR image analysis and implementation as FSL. Neuroimage 23 Suppl 1, (2004).
Figures