3337
Temporal evolution of the cortical-depth profiles of BOLD fMRI response1Athinoula A. Martinos Center for Biomedical Imaging, Massachusetts General Hospital, Charlestown, MA, United States, 2Department of Radiology, Harvard Medical School, Charlestown, MA, United States, 3Department of Biomedical Engineering, Boston University, Boston, MA, United States, 4Division of Health Sciences and Technology, Massachusetts Institute of Technology, Cambridge, MA, United States
Synopsis
The gradient-echo BOLD fMRI signal demonstrates greatest changes with activation near large draining veins which results in cortical-depth activation profiles that increase linearly with depth from the white to pial surface. However, due to the sparsity of pial vessels these profiles are likely to vary across cortical locations depending on proximity to vessels. We investigated the temporal evolution and spatial variability of the cortical-depth profiles of the BOLD response within human visual cortex and demonstrated that the response is initially strongest in the mid-cortical depths and in time becomes dominated by the large veins at the pial-surface.
Introduction
The gradient-echo BOLD fMRI signal is strongly biased by the venous vasculature with the greatest signal changes with activation near large draining veins. This results in spatial displacement of the signal away from the site of neural activity1–3 and a roughly linear activation profile across the cortical depth increasing from white matter (WM) interface towards the pial-surface, as reported previously1,4–6. However, the hemodynamic response initiates within the tissue parenchyma microvasculature and spreads as oxygenated blood travels to the cortical surface in time on the order of 0.5s, which is observable in human fMRI and has been reported in high-resolution small animal studies7. Furthermore, the temporal properties of the hemodynamic response vary with cortical depth in humans and small animals alike8,9. Considering the sparseness of pial vessels on the cortical surface10,11, this trend likely varies across cortical locations: it is presumably steep near the vessels and shallow away from them12. Understanding and accounting for these venous effects on BOLD signal can potentially help improve spatial specificity of fMRI13. Here we investigated the temporal evolution and spatial variability of the cortical-depth profiles of the BOLD fMRI response within human visual cortex.Methods
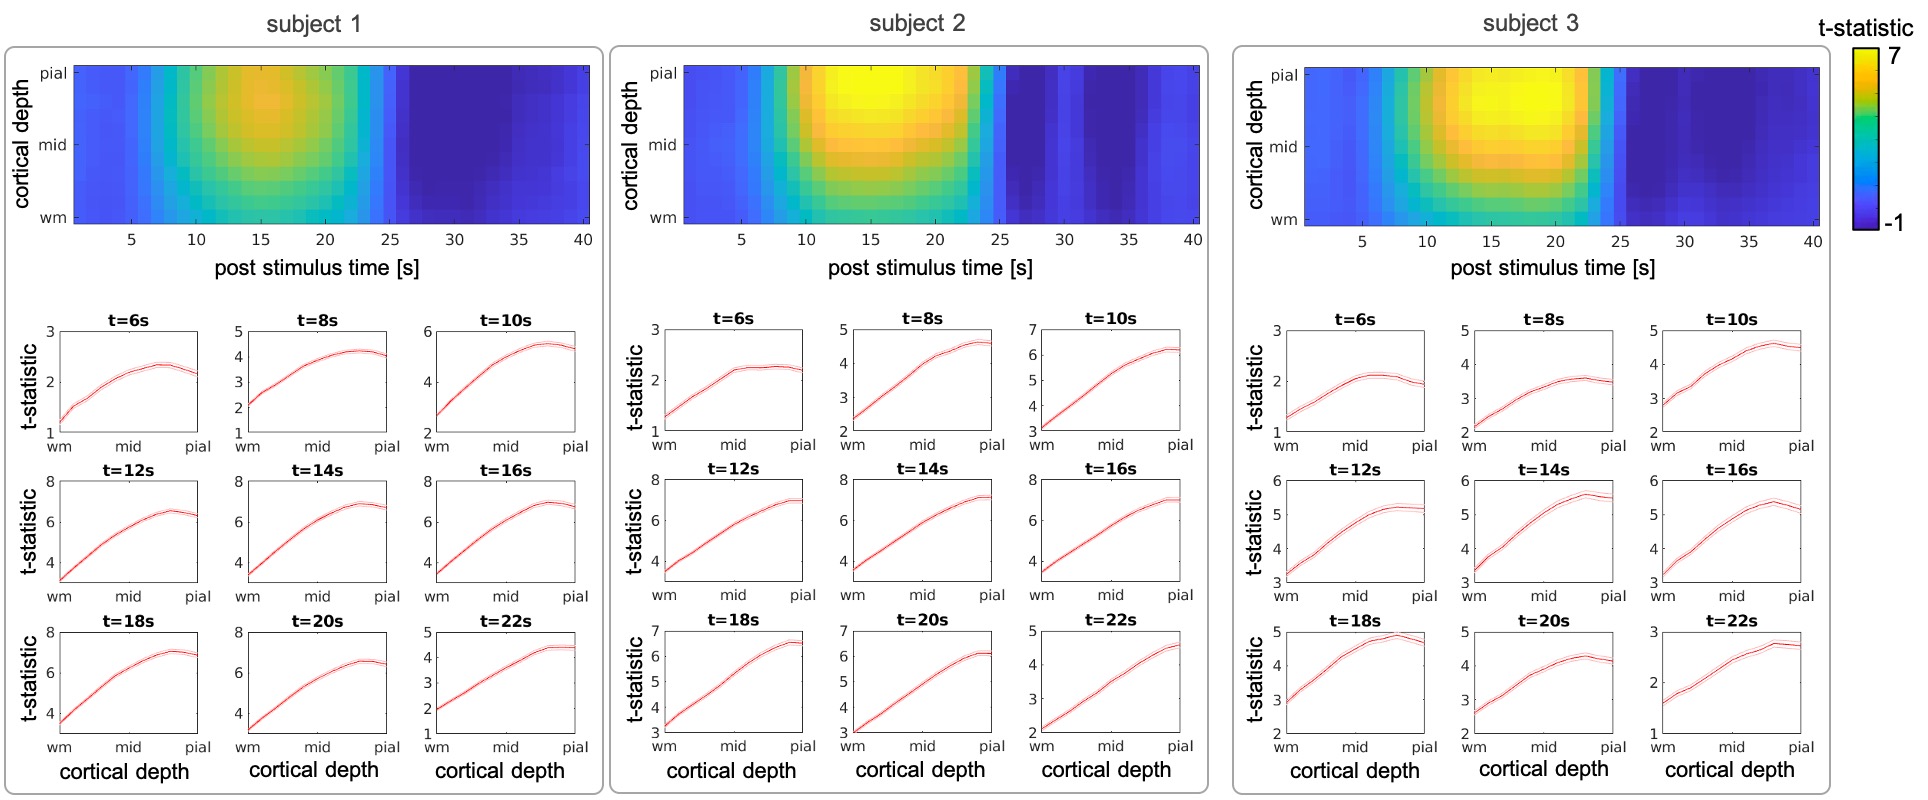
Three healthy volunteers (1M/2F, 24±1y.o.) were imaged on a whole-body 7T scanner (Terra, Siemens Healthineers, Erlangen, Germany) equipped with a custom built 64-channel receive-coil-array14, using 2D-gradient-echo EPI protocols with 0.8-mm isotropic resolution (see Table 1). 10-12 functional coronal scans were acquired per session and during each scan subjects were presented with a visual stimulus: a full-field-of-view black-and-white ’scaled-noise’ pattern counter-phase flickering at 8Hz, in four randomly jittered blocks of 16-s duration and 40–49s inter-stimulus-intervals. Same-session 0.75-mm isotropic resolution FOCI-MEMPRAGE data15,16 were acquired and employed for automatic cortical surface reconstruction using FreeSurfer. The T1 data were bias-field corrected (SPM) and surface-meshes were reconstructed for the cortical depths every 10% between WM and pial-surface17. EPI data were motion corrected (AFNI), detrended an GLM analyses were performed in volume space (FSL) to create dSPM maps consisting of t-statistic values calculated in every time-point, similar to our previous study3, which were then averaged across runs. Average dSPM maps were projected onto the surface-meshes using transformations of the single EPI frames to T1 data obtained from the boundary-based registration18 initialized with the manual alignment and performed in two steps: within whole brain with masked-out EPI distorted regions, and within the FreeSurfer V1-mask. In order to select regions where the fMRI response was strong across all cortical depths, a region-of-interest (ROI) was defined by thresholding, then dilating, a z-statistic map averaged across all runs and projecting it onto the WM cortical surface-mesh. The resulting labels, one per each hemisphere were further intersected with the FreeSurfer V1-labels to limit the analysis to the locations within the visual cortex. The dSPM values averaged inside the ROIs combined across both hemispheres were plotted across cortical depth for selected time-points corresponding to different phases of BOLD response 6-22s post-stimulus. K-means clustering (k=3) was applied to all vertices within the ROI to identify different shapes of the cortical-depth dSPM profile for selected post-stimulus time-points.Results
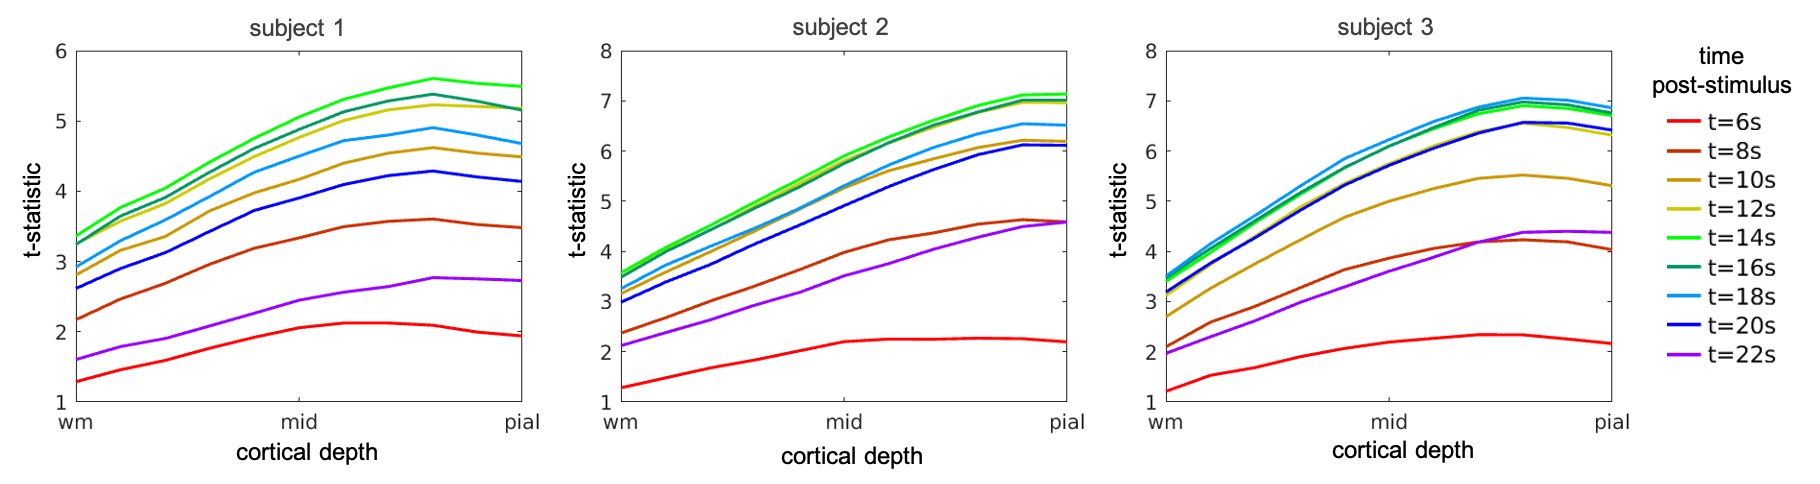
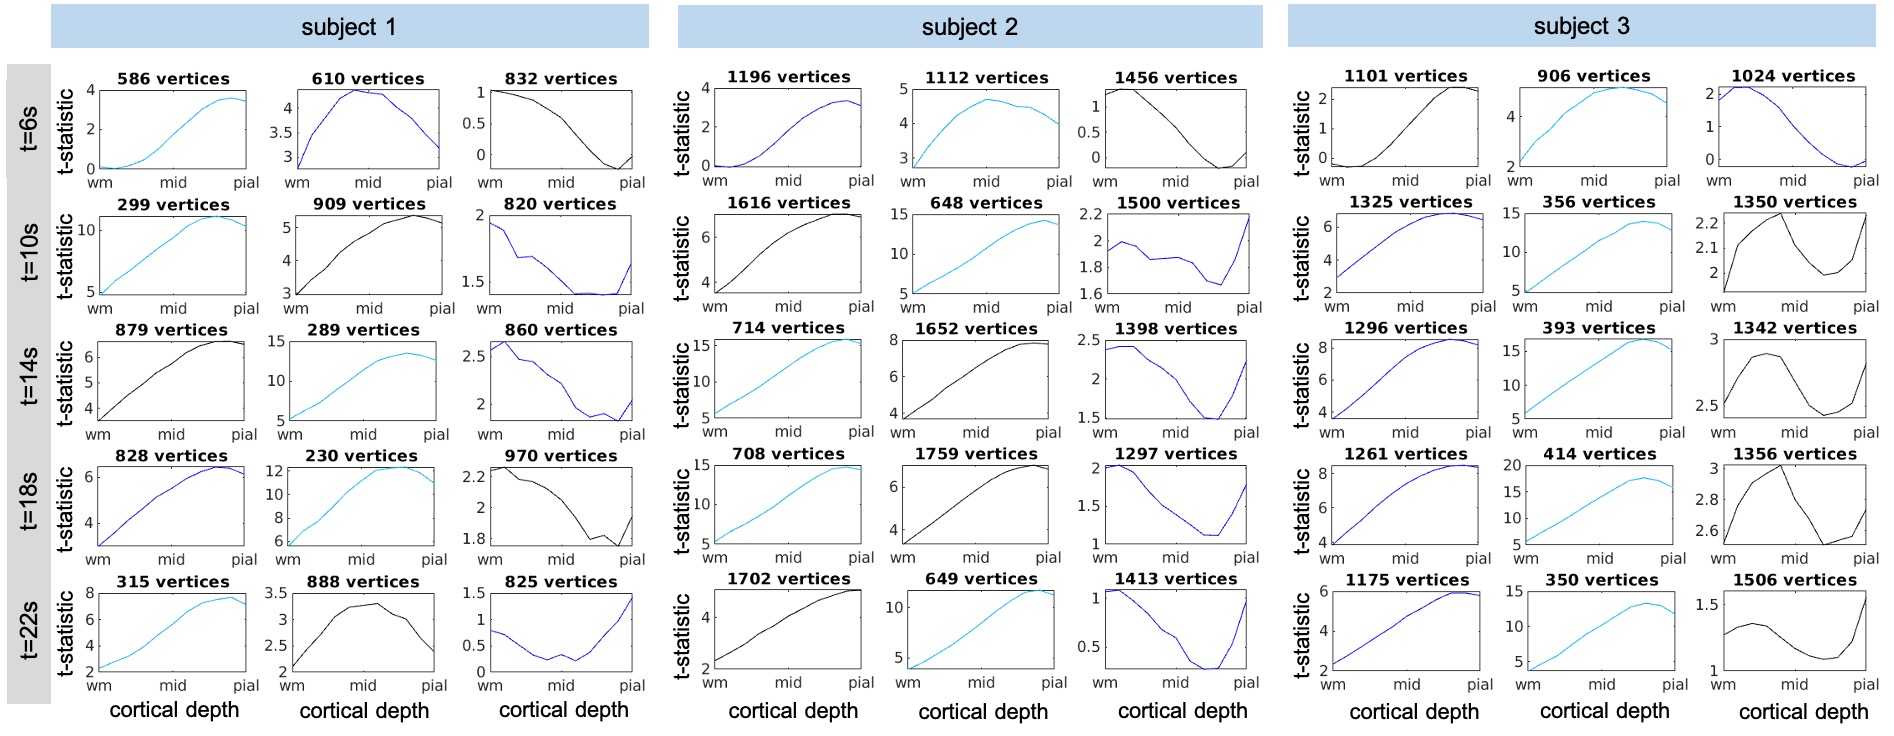
Figure 2 and 3 summarize the evolution of t-statistic values representing BOLD fMRI response in time and across cortical depth, with cortical-depth profiles plotted for selected time points 6-22s post-stimulus onset. As predicted, the BOLD response at early time points is maximal within the parenchyma, and only becomes maximal at the pial-surface at later time points. This effect can be seen in individual subjects and is consistent across subjects. The results of k-means clustering of the t-statistic cortical-depth profiles measured in the individual activated vertices are presented in Figure 4. Five different time points were selected ranging from the early response (6s) via peak (14s) towards the late response (22s). For each subject, three cortical-depth profiles were identified: a linear profile (Figure 4, left-column), a profile with largest values in mid-depth (Figure 4, mid-column) and a profile representing noise (Figure 4, right-column). Profiles were color-coded according to the cluster sizes (black/blue/cyan: largest–smallest). This suggests that there are a variety of depth profiles, and the average cortical depth profile obscures these regional differences.Discussion
We found that early BOLD response is strongest in mid-depth (Figure 2, 6s) but by the time it reaches the peak it becomes more linear with the largest contribution from the depths near the pial-surface (Figure 2, >12s). Clustering of the cortical-depth BOLD fMRI response profiles revealed a substantial subset of the activated vertices with the highest activation localized in mid-cortex. This was especially pronounced on early and late stages of the response temporal evolution (Figure 4, 6 & 22s), with this type of response exhibiting, in most cases, an amplitude higher than that seen in responses exhibiting a linear cortical-depth profile. Closer to the BOLD response peak (Figure 4, 14s) this cluster was more difficult to distinguish.Conclusions
In this work we have demonstrated that fMRI BOLD response is initially strongest in the mid-cortical depths and with time becomes dominated by the large veins at the pial-surface. This is consistent with previous studies in small animals7, and suggests that the cortical depth profile of the gradient-echo BOLD signal may be more complex and varied than previously understood.Acknowledgements
This work was supported by the BRAIN Initiative (NIH NIMH grants K99-MH120054 and R01-MH111419), NIH NIBIB (grant R01-EB019437) and by the MGH/HST Athinoula A. Martinos Center for Biomedical Imaging; and was made possible by the resources provided by NIH Shared Instrumentation Grant S10-OD023637. Thanks to Kyle Droppa for help with volunteer recruitment. We gratefully acknowledge use of the Siemens Works-In-Progress package WIP#1105.References
1. Polimeni, J. R., Fischl, B., Greve, D. N. & Wald, L. L. Laminar analysis of 7T BOLD using an imposed spatial activation pattern in human V1. Neuroimage 52, 1334–1346 (2010).
2. Olman, C. A., Inati, S. & Heeger, D. J. The effect of large veins on spatial localization with GE BOLD at 3T: Displacement, not blurring. Neuroimage 34, 1126–1135 (2007).
3. Blazejewska, A. I., Bernier, M. I., Nasr, S. I. & Polimeni, J. R. Testing temporal dependence of spatial specificity in BOLD fMRI at 7T: comparing short versus long stimulus duration. in ISMRM 19 0536 (2019).
4. Huber, L. et al. Slab-selective, BOLD-corrected VASO at 7 tesla provides measures of cerebral blood volume reactivity with high signal-to-noise ratio. Magn. Reson. Med. 72, 137–148 (2014).
5. De Martino, F. et al. Cortical Depth Dependent Functional Responses in Humans at 7T: Improved Specificity with 3D GRASE. PLoS One 8, 30–32 (2013).
6. Koopmans, P. J., Barth, M. & Norris, D. G. Layer-specific BOLD activation in human V1. Hum. Brain Mapp. 31, 1297–1304 (2010).
7. Yu, X. et al. Direct imaging of macrovascular and microvascular contributions to BOLD fMRI in layers IV-V of the rat whisker-barrel cortex. Neuroimage 59, 1451–1460 (2012).
8. Tian, P. et al. Cortical depth-specific microvascular dilation underlies laminar differences in blood oxygenation level-dependent functional MRI signal. Proc. Natl. Acad. Sci. 107, 15246–15251 (2010).
9. Siero, J. C. W. et al. Cortical depth dependence of the BOLD initial dip and poststimulus undershoot in human visual cortex at 7 Tesla. Magn. Reson. Med. 73, 2283–2295 (2015).
10. Duvernoy, H. M., Delon, S. & Vannson, J. L. Cortical blood vessels of the human brain. Brain Res. Bull. 7, 519–579 (1981).
11. Bollmann, S. et al. Imaging of the pial arterial vasculature of the human brain in vivo using high-resolution 7T time-of-flight angiography. bioRxiv 2021.06.09.447807 (2021).
12. Huber, L. et al. Layer-dependent functional connectivity methods. Prog. Neurobiol. (2020).
13. Bernier, M., Pfannmoeller, J. P., Bollmann, S., Berman, A. J. L. & Polimeni, J. R. Modeling the vascular infuences on BOLD fMRI using in vivo brain vasculature: incorporating vessel diameter, orientation, and susceptibility. in ISMRM 3397 (2021).
14. Mareyam, A., Kirsch, J. E., Chang, Y., Madan, G. & Wald, L. L. A 64-channel 7T array coil for accelerated brain MRI. in ISMRM 0764 (2020).
15. Hurley, A. C. et al. Tailored RF pulse for magnetization inversion at ultrahigh field. Magn. Reson. Med. 63, 51–8 (2010).
16. van der Kouwe, A. J. W., Benner, T., Salat, D. H. & Fischl, B. Brain morphometry with multiecho MPRAGE. Neuroimage 40, 559–569 (2008).
17. Polimeni, J. R., Renvall, V., Zaretskaya, N. & Fischl, B. Analysis strategies for high-resolution UHF-fMRI data. Neuroimage 168, 296–320 (2018).
18. Greve, D. N. & Fischl, B. Accurate and robust brain image alignment using boundary-based registration. Neuroimage 48, 63–72 (2009).
Figures