3335
Hemodynamic responses based on CBV weighted fMRI strongly correlate with single-unit neuronal action potentials across cortical layers1University of Minnesota, Minneapolis, MN, United States
Synopsis
The specificity of hemodynamic signals detected by functional magnetic resonance imaging (fMRI) to neuronal activity is complicated by the neurovascular coupling. To investigate the fidelity of fMRI in differentiating the neuronal activity across cortical layers, we mapped the laminar orientation preference maps in the cat visual cortex by using high-resolution cerebral blood volume weighted (wCBV) fMRI and single-unit neuronal action potential recording, respectively. The strong correlation between wCBV percent change and spike firing rate indicates that wCBV fMRI with sufficient spatial resolution could distinguish the differences of neural activities across layers but with a reduced sharpness.
Introduction
Understanding the relationship between hemodynamic signals detected by functional magnetic resonance imaging (fMRI) and the underlying neural activity is crucial to numerous brain studies. Although fMRI signals have been shown to be correlated with spontaneous brain activities1 and feature selective responses2,3 at a relatively low spatial resolution, it is more critical to test the fidelity of fMRI in differentiating the neuronal activity modulated by thalamic inputs across cortical layers. Taking advantage of the well-known neuronal functional representation of orientation selectivity across cortical layers in cat visual cortex, we can map the laminar hemodynamic signals in response to the orientation selective stimuli in area 18 of cat V1 by using high-resolution (250 microns isotropic) cerebral blood volume weighted (wCBV) fMRI4. The sharpness of orientation tuning across layers detected by wCBV fMRI can be evaluated by comparing it with the single-unit neuronal action potentials recorded after fMRI. The large correlation coefficient between wCBV percent change and spike firing rate indicates that wCBV fMRI with sufficient spatial resolution could distinguish the differences of neural activities across layers but with a reduced sharpness.Methods
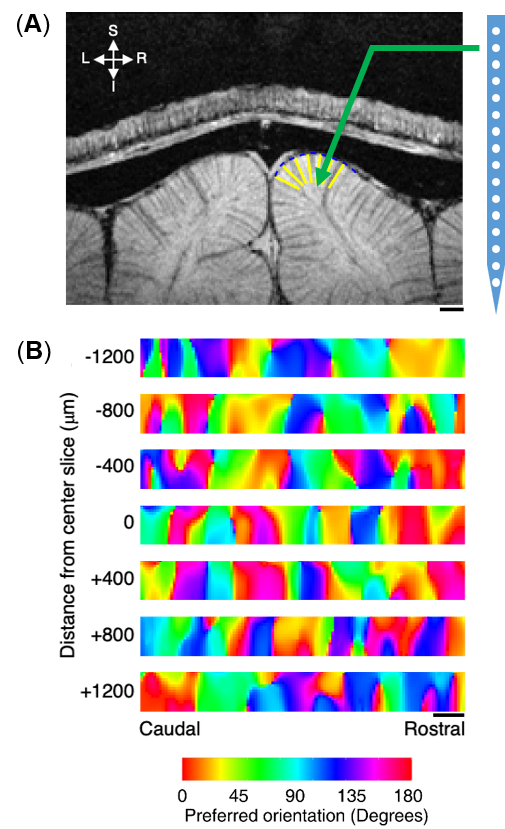
Animal preparation:Seven cats were scanned for fMRI and one cat was used for electrophysiological activity recording with the protocol approved by the Institutional Animal Care and Use Committee at University of Minnesota. All cats were initially inducted with ketamine cocktail (10–20 mg/kg) and mechanically ventilated during measurements under isoflurane anesthesia (1–2% during surgery, 0.5–1.1% during data collection) with stable physiological conditions. For wCBV fMRI, exogenous contrast agent (Feraheme, 10–20 mg/kg) was infused intravenously. For acute single-unit activity recording, a craniotomy was made over the area 18. An electrode (NeuroNexus—1×16, recording site diameter 15 or 30 microns, site spacing 100 microns) was advanced into the cortex perpendicularly to the cortical surface as illustrated in Fig. 1A using a manual mechanical Microdrive. Reference and ground wires were positioned in the exposed tissue around the skull.
Visual stimulation:
Binocular full-field drifting square-wave grating stimuli with 8 orientations were presented.
fMRI experiment at 9.4T:
wCBV fMRI data acquisition and analysis were carried out as described previously4. Essential sequence information: 2D segmented (n=4) gradient echo EPI sequence (matrix=80×80, FOV=20×20 mm, 250 μm isotropic resolution, 6-8 slices for axial and 1-3 slice for sagittal/coronal imaging, TR=2 secs, TE=10 ms).
Electrophysiological activity recording:
Single-unit activities with the presentation of the same orientation selective stimuli were recorded at 30 kHz with a 32-channel TDT neural recording system with 0.25 microvolt/bit resolution. Spike responses were calculated by subtracting the average baseline firing rate from the average stimulus firing rate. Responses were averaged across all stimulus angles and directions for 10 trials. The orientation selectivity index (OSI) 5 was calculated based on the following formula6: OSI = $$$abs[\frac{\Sigma_k r_k e^{i2\theta_k}}{\Sigma_kr_k}]$$$, where $$$\theta_k$$$ is the orientation of each stimulus in degree and $$$r_k$$$ is the mean spike response across trials to $$$\theta_k$$$. Pearson’s correlation coefficient between cortical depth dependent profile of wCBV percent change and that of spike firing rate was calculated.
Results
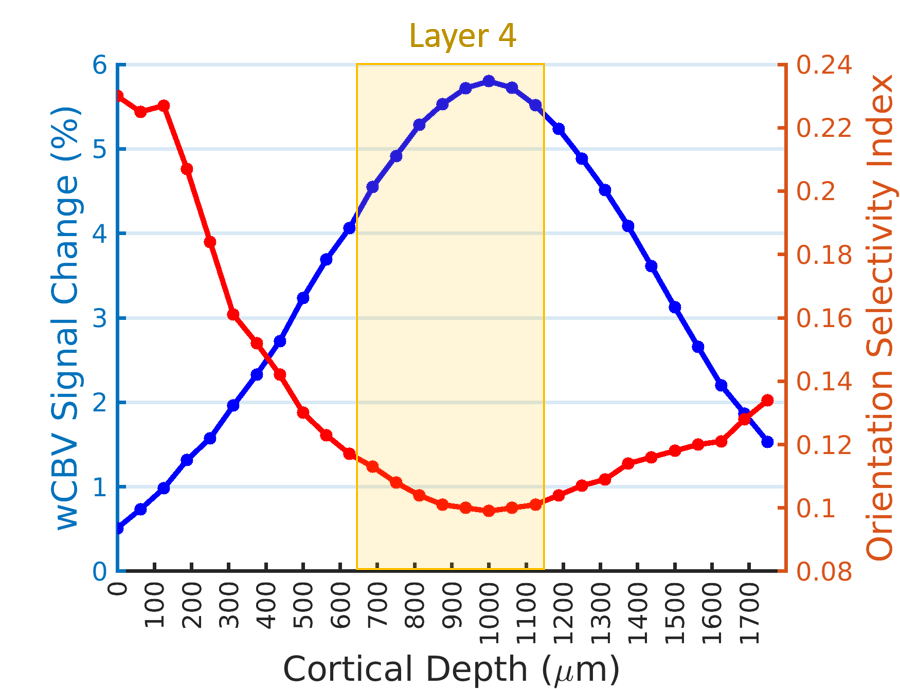
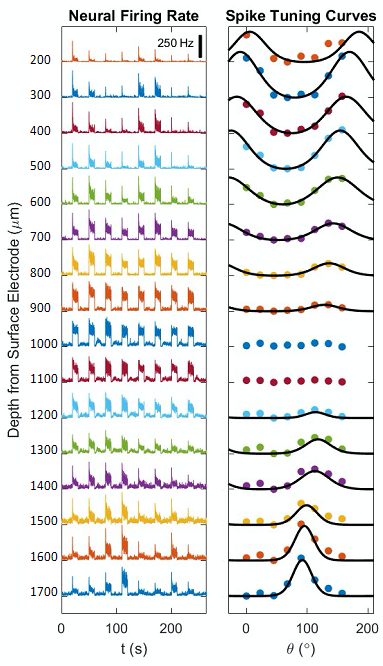
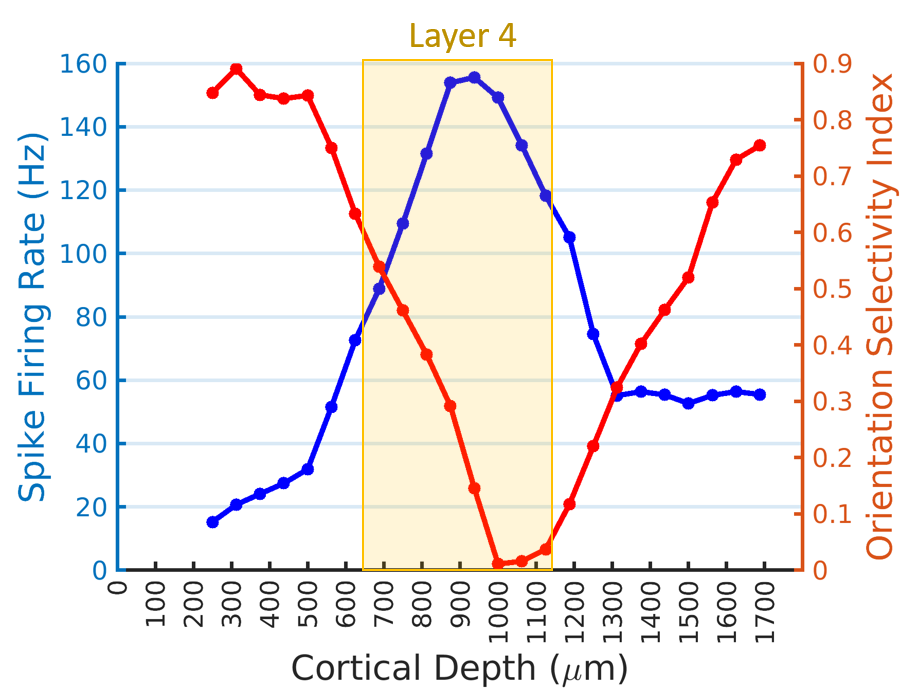
Figure 1A shows a representative image of the cat visual cortex structure (coronal orientation) with a reference direction where the electrode was inserted. Figure 1B is the laminar-dependent orientation preference maps for seven planes of interest that perpendicularly aligned to the cortical surface. Figure 2 shows the averaged profile of wCBV fMRI signal change (blue) from multiple cats with the corresponding OSI curve (red) across cortical depth. The strongest fMRI signal is located at the depth of 1000 microns within Layer 4 where the responses associated with neuronal activities are least selective. Figure 3 shows the averaged neural firing rate for 16 electrode channels across all stimulus angles and directions for 10 trials (Left panel) and the corresponding spike tuning curves (right panel). The central layer is less tuned than the other layers. This becomes more obvious when the profiles of spike firing rate and the corresponding OSI are calculated (Figure 4). Pearson’s correlation coefficients between wCBV percent change and spike firing rate and between the OSIs are 0.89 and 0.81, respectively. However, compared to the sharp tunning curve from the single-unit activity recordings, wCBV signal response is about 80% broader, with the FWHM for the wCBV signal change and that for the spike firing rate of 900 microns and 500 microns, respectively.Discussion and Conclusion
Both the wCBV fMRI data and electrophysiological recordings show the orientation preference maps extend across cortical layers in a columnar fashion. The strong correlation between the wCBV precent change and the single-unit activities indicates that high-resolution wCBV fMRI can differentiate the differences of neuronal activities across layers to some degree in respect to the orientation selective stimuli, though the response of orientation preference could extend more than the neuronal activity site. This could partially attribute to the fact that a single fMRI voxel could include many neurons even with very high resolution, resulting in spatial average and reducing the sharpness of fMRI to detect local neuronal activity change.Acknowledgements
This work was supported in part by NIH grants of R01 MH111413, R01 CA240953,
U01 EB026978, S10 RR025031, P41 EB027061 and P30 NS076408.
References
1. Y. He et al., Ultra-Slow Single-Vessel BOLD and CBV-Based fMRI Spatiotemporal Dynamics and Their Correlation with Neuronal Intracellular Calcium Signals. Neuron 97, 925-939 e925 (2018).
2. A. Shmuel, A. Grinvald, Functional organization for direction of motion and its relationship to orientation maps in cat area 18. J Neurosci 16, 6945-6964 (1996).
3. E. Yacoub, N. Harel, K. Ugurbil, High-field fMRI unveils orientation columns in humans. Proc Natl Acad Sci U S A 105, 10607-10612 (2008).
4. Shinho Cho et al. Layer-specific orientation selectivity in cat visual cortex using 9.4 Tesla fMRI and multi-photon optical imaging. Proceedings of ISMRM 29: ???? (2021).
5. D. L. Ringach, R. M. Shapley, M. J. Hawken, Orientation selectivity in macaque V1: diversity and laminar dependence. Journal of Neuroscience 22, 5639-5651 (2002).
6. P. O’Herron, M. Levy, J. J. Woodward, P. Kara, An Unexpected Dependence of Cortical Depth in Shaping Neural Responsiveness and Selectivity in Mouse Visual Cortex. Eneuro 7 (2020).
Figures