3332
Mapping cortical-depth dependent responses in human motor cortex using Spin-echo Echo Planar Time-resolved Imaging (SE-EPTI)1Athinoula A. Martinos Center for Biomedical Imaging, Massachusetts General Hospital, Charlestown, MA, United States, 2Department of Radiology, Harvard Medical School, Boston, MA, United States, 3Department of Radiology, Stanford University, Stanford, CA, United States, 4Department of Electrical Engineering, Stanford University, Stanford, CA, United States
Synopsis
This work utilizes our recently developed spin-echo EPTI technique with minimal T2’-contamination and high specificity to map the layer-dependent responses in primary motor cortex at 7T and further investigate the impact of large vessel bias from T2’ contamination. EPTI resolves multi-contrast images across the readout that are free from distortion and blurring, and simultaneously obtains a SE image with pure T2-weighting and multiple asymmetric SE images with various T2’-weightings. The activation of finger-tapping task was studied using SE-EPTI at 0.9-mm isotropic resolution. Improved specificity of layer-dependent responses was observed using pure SE images.
Introduction
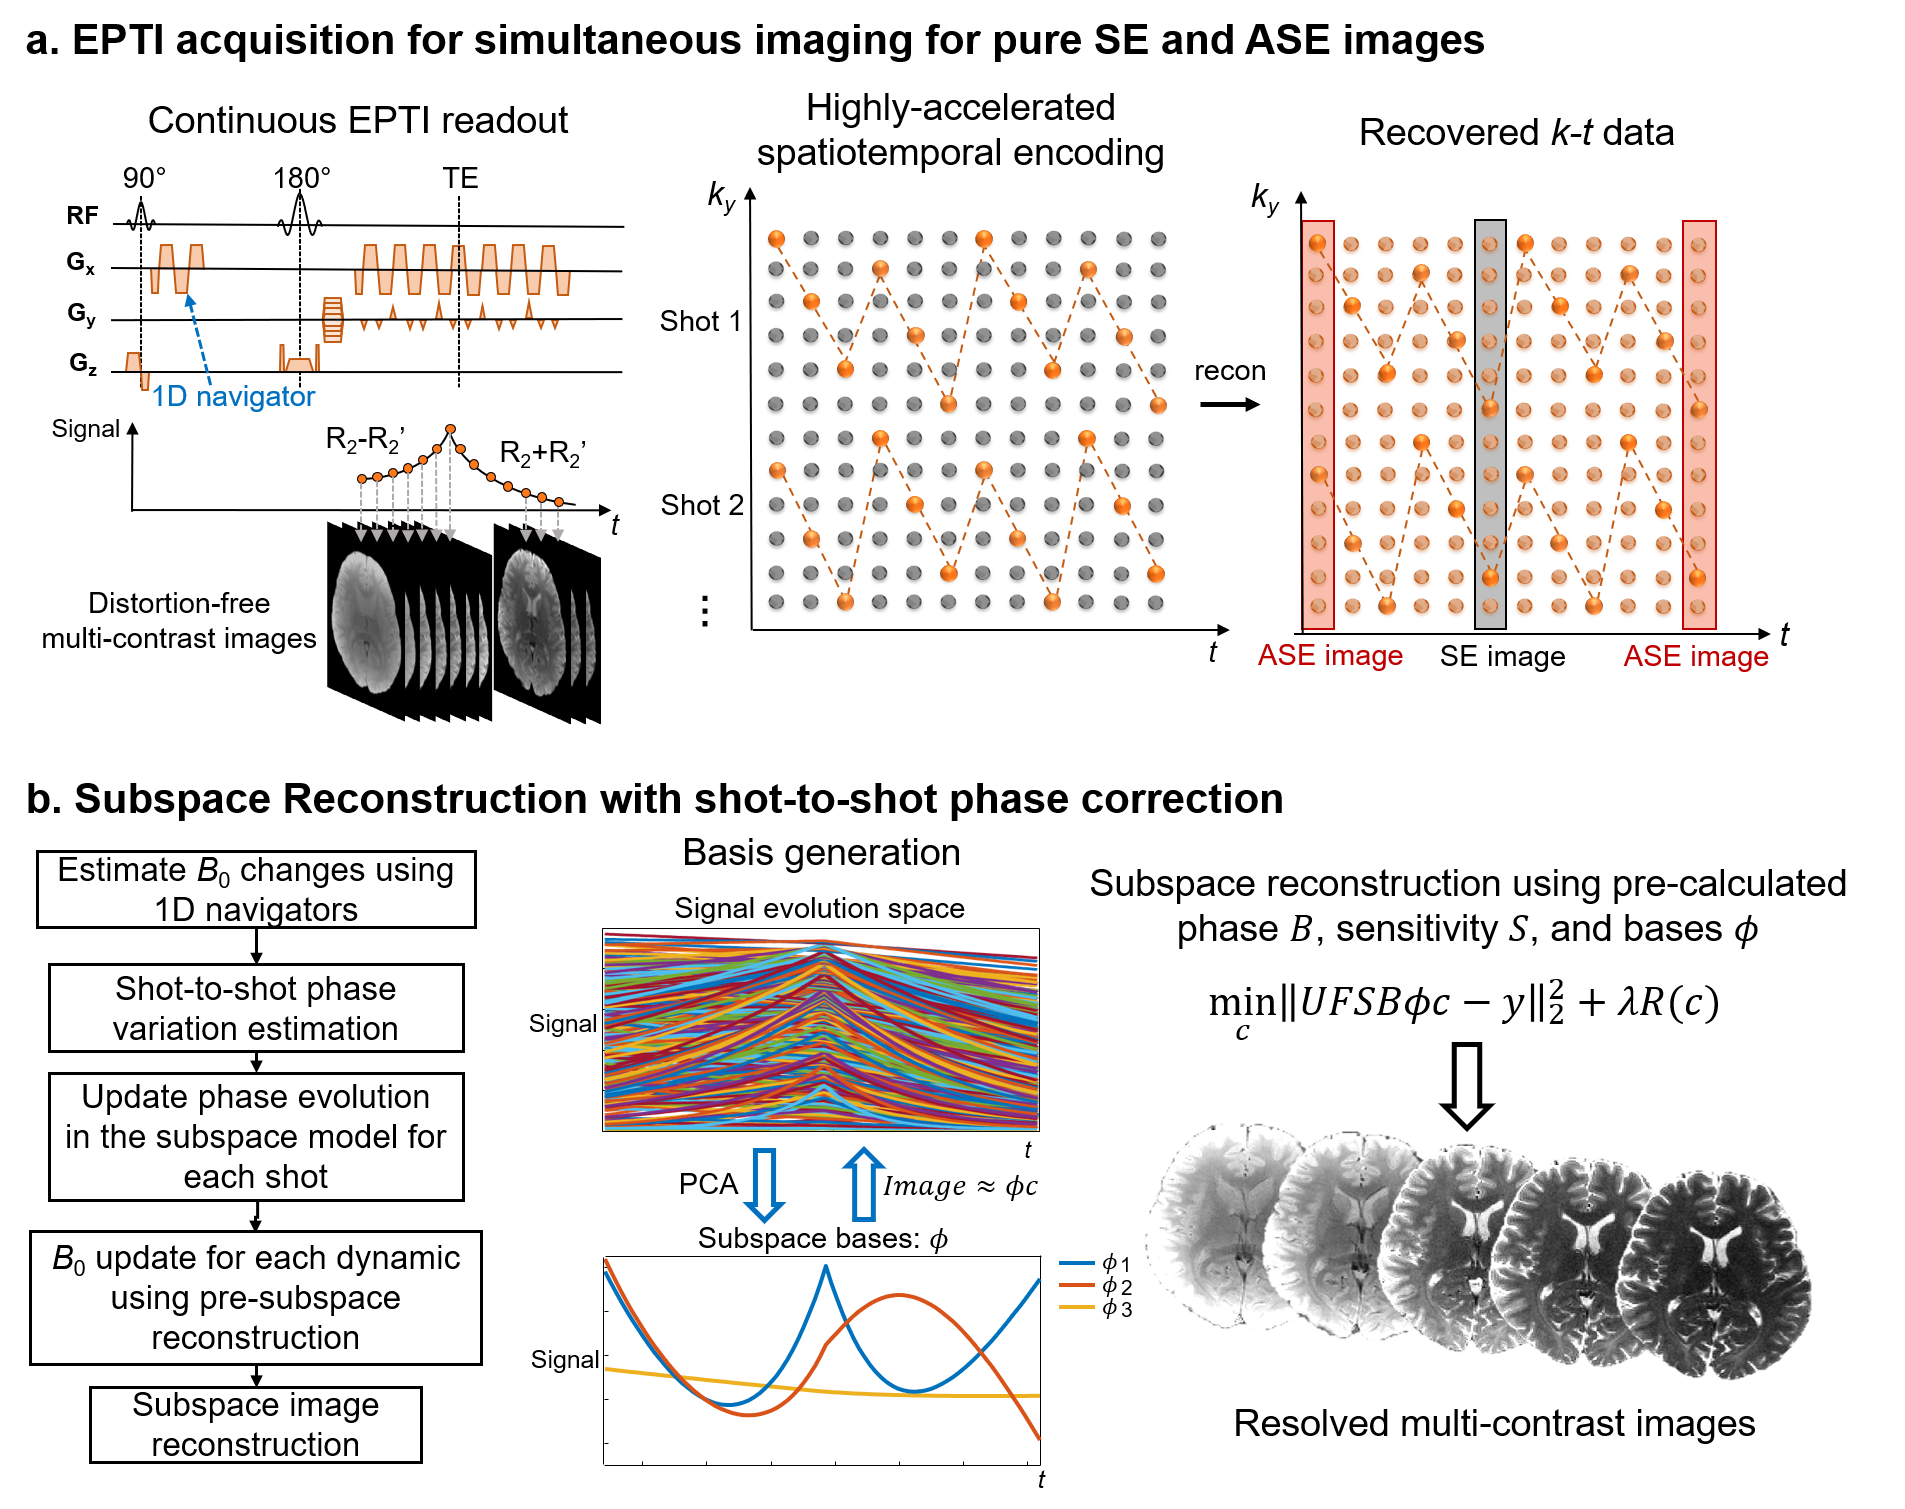
Spin-echo (SE) BOLD fMRI provides more specific localization of neuronal activity than GE-BOLD due to its high microvascular specificity1-9. The most commonly used acquisition, SE-EPI, is known to suffer from T2′ contrast contamination resulted from the long EPI readout, and therefore induces undesired draining vein bias6,7,10-12. The previous study10 has been able to show in anesthetized monkeys, that by using a highly segmented EPI acquisition with up to 16 shots, a shorter ETL can significantly reduce signal contamination and improve the microvascular specificity. To address this, recent studies have also investigated the benefit of alternative acquisition methods such as T2-prep13 and 3D-GRASE14-19 to improve the microvascular specificity. Acquisition methods for non-BOLD contrast such as CBV have also been developed that showed promising results20-26.We recently developed a novel imaging approach, echo-planar time-resolved imaging (EPTI)27, which changes the way of image formation of EPI from generating a single distorted image, to recovering the full k-t space and producing multiple distortion- and blurring-free multi-contrast images across the readout window, spaced at a TE increment of an echo-spacing (~1ms) (Fig.1a). By using a spin-echo EPTI acquisition28, we can simultaneously obtain: a pure SE image with minimal T2’-contamination and multiple asymmetric-SE (ASE) images with various T2’ weightings to investigate the BOLD response. All these images are concurrently acquired in a SE-EPTI acquisition without any geometric and dynamic distortion for reliable analysis.
We have preliminarily studied the use of EPTI for high-resolution fMRI at 7T with visual-task experiments28, and have shown the reduced draining vein bias using the obtained pure SE image with minimal T2’ contamination. In this work, we further investigate the use of SE-EPTI for mapping layer-dependent responses in the motor cortex (M1) area at 7T. The activation of finger tapping task26 was studied using the simultaneously acquired pure SE and ASE images at 0.9-mm isotropic resolution to evaluate the effect of large vessel bias on the cortical-depth dependent responses.
Methods
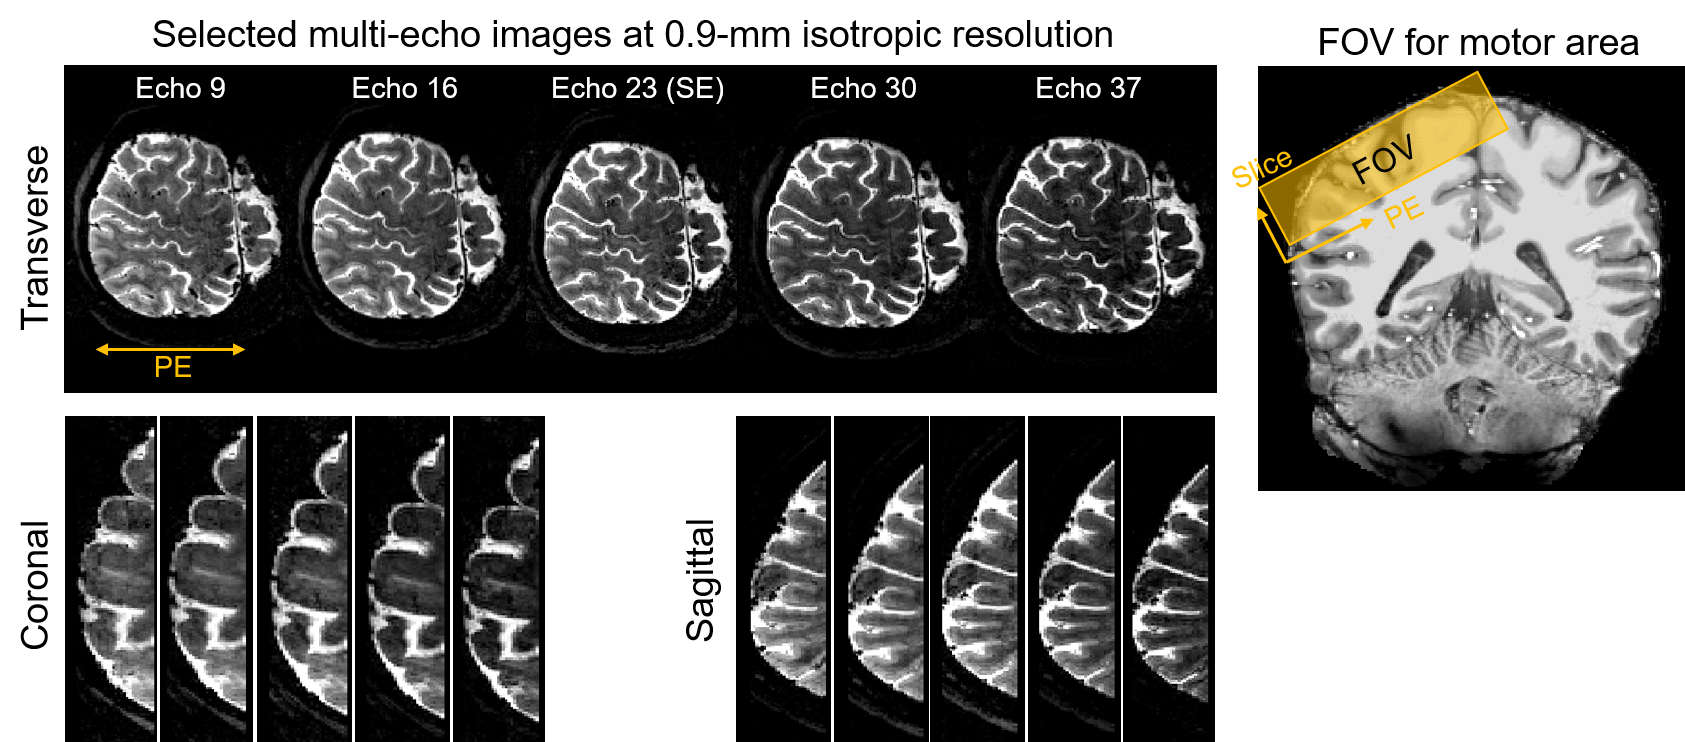
Fig.1a illustrates the SE-EPTI acquisition used in this study, which utilizes a continuous readout with designed spatiotemporal CAIPI encoding pattern to sample the k-t space with high acceleration. The EPTI sampling pattern provides strong spatiotemporal correlation to recover the full k-t data using only a few EPTI-shots (3 shots were used in this study), and after multi-echo image reconstruction, the desired pure T2-weighted SE image can be obtained as well as ASE images with varying T2’ weightings. Figure 1b shows the image reconstruction framework for SE-EPTI based on the subspace approach with dynamic B0 updating and shot-to-shot phase variation correction28-30, to recover distortion-free multi-contrast images from the highly-accelerated EPTI data.Data were acquired on a healthy volunteer with finger tapping task (with touching)26 on Siemens Terra 7T scanner using a 32-channel Nova coil. 3-shot SE-EPTI acquisition was used to obtain the pure SE and ASE images at 0.9-mm isotropic resolution. Other parameters: FOV=218×130mm2, 28 slices, 45 echoes, TErange=43–96ms, TE-increment (echo-spacing)=1.2ms, volume-TR=3.25s×3=9.75s, 35 dynamics, acquisition time/run=5min42s, total 10 runs. The FOV for motor cortex was prescribed based on a low-resolution GE-EPI fMRI localizer scan. After reconstruction, pure SE (23th-echo, TE=69ms) and ASE images were generated. Motion correction was performed using AFNI31 followed by GLM analysis using FSL-Feat32. Cortical-depth analysis was performed using Freesurfer33,34, and 9 equi-volume35,36 layers were reconstructed for the motor cortex using the MPRAGE images. A 2-mm Gaussian surface-smoothing was performed for each surface.
Results
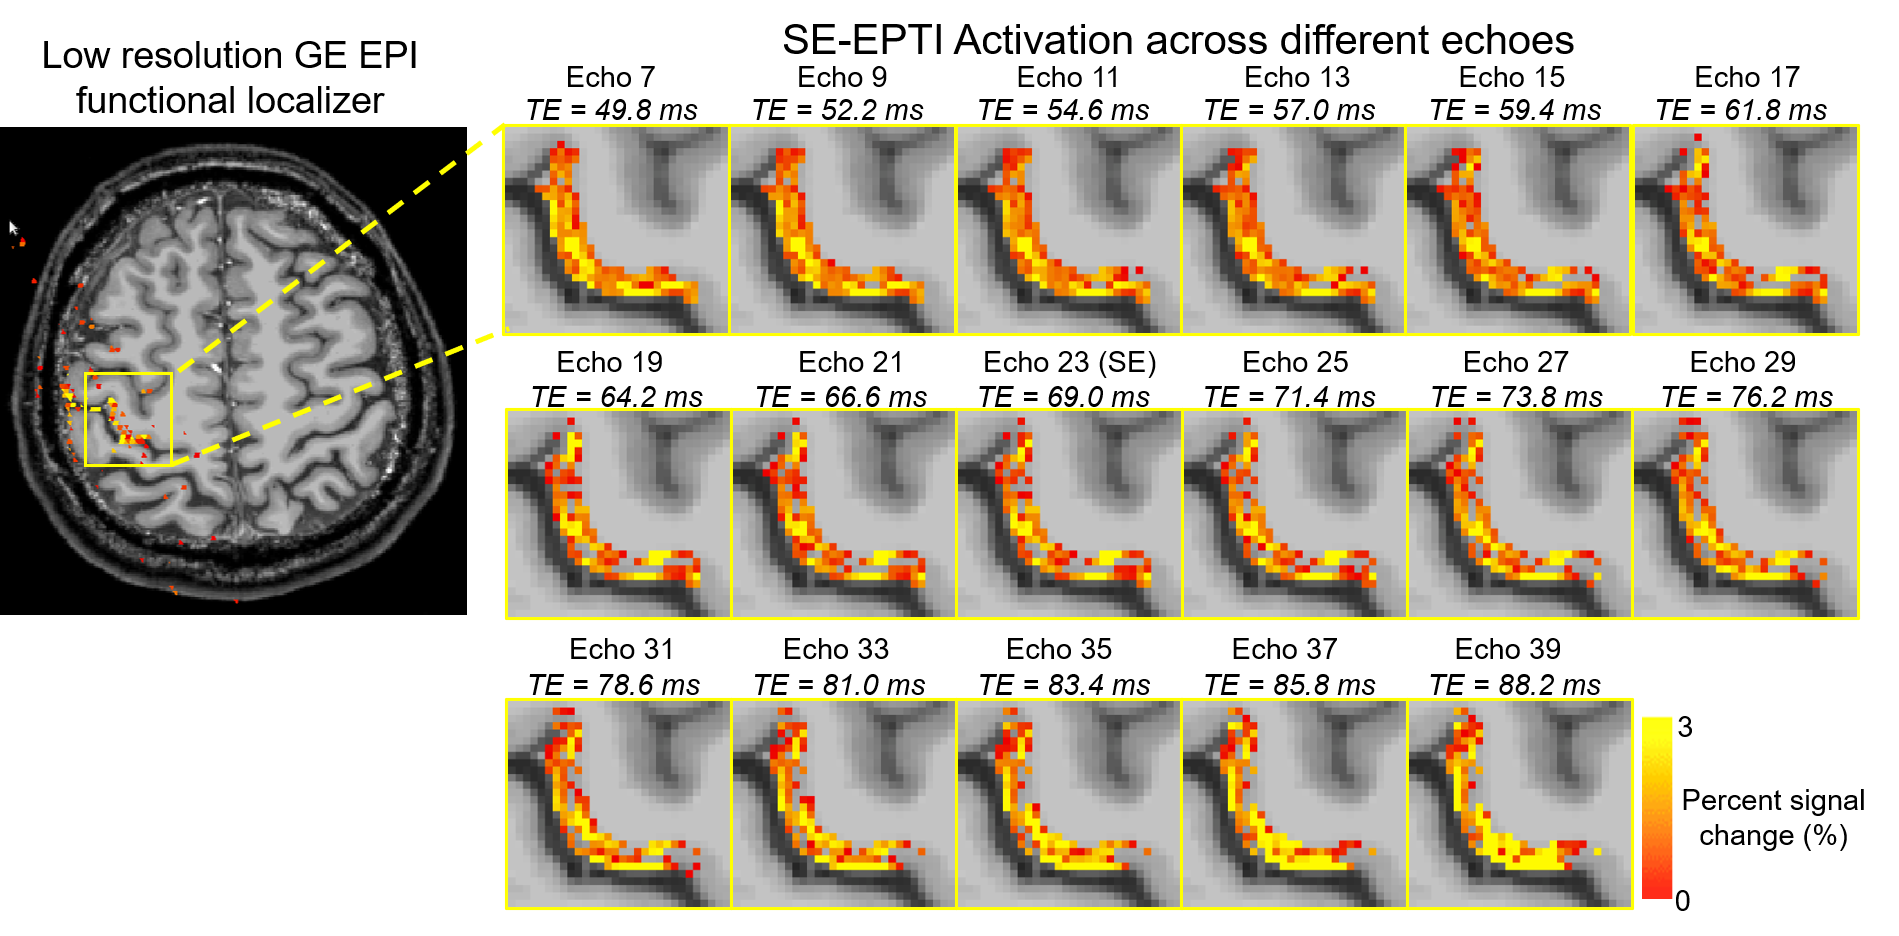
Fig.2 shows example multi-echo images with varying contrast in three orthogonal views that are simultaneously acquired by SE-EPTI, covering the target motor cortex area based on the fMRI localizer.Fig.3 shows the zoomed-in activation maps from the pure SE (echo 23) and ASE images at the hand ‘knob’ region within the motor cortex. ASE images with strong T2’ weighting (e.g., echo 7 and 39) show overall higher activation but are less layer-specific. More differentiable activations in different layer depths are observed at the pure SE echo, which could benefit from the reduced draining vein bias.
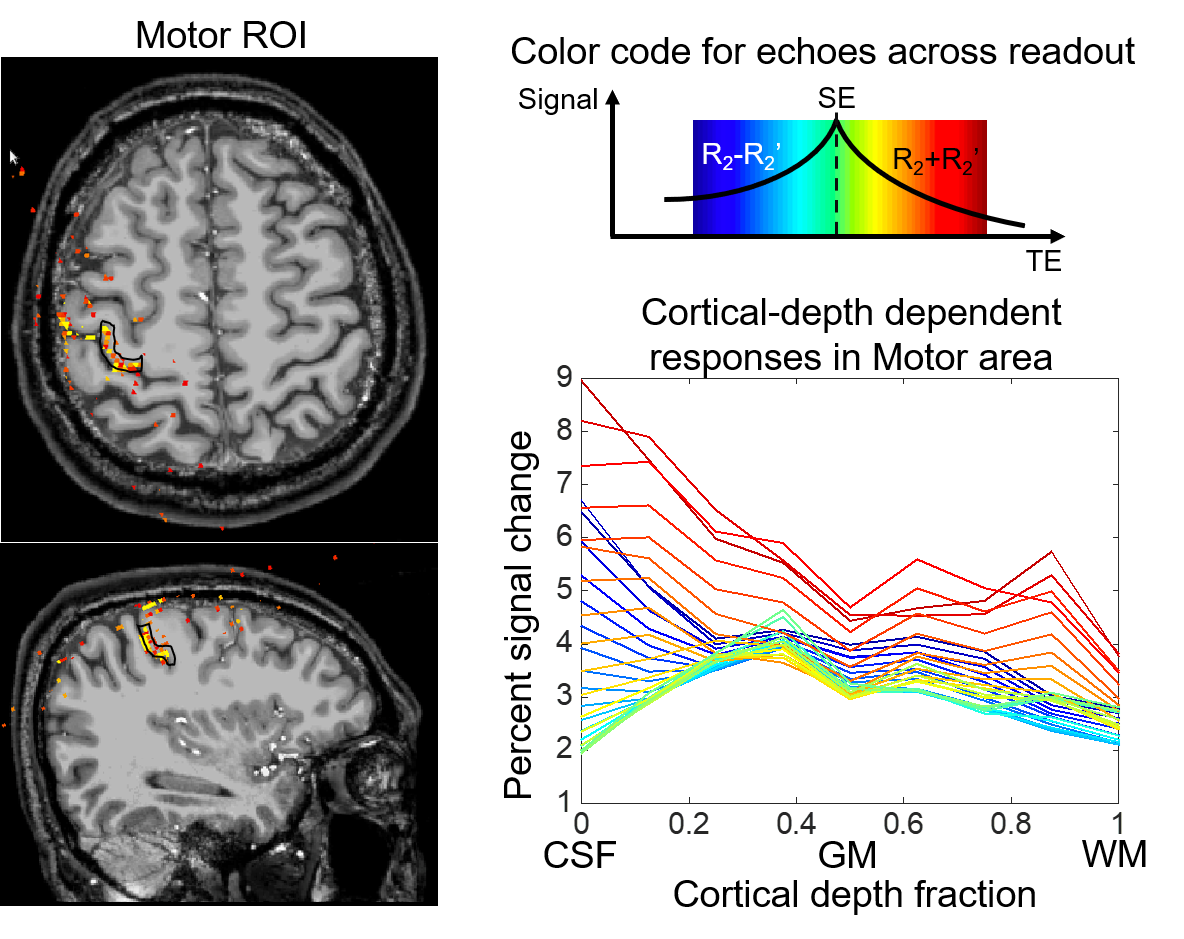
The cortical-depth dependent activation profiles within a selected ROI in motor cortex are plotted in Fig.4. The profiles of different echoes are color coded (7 to 39 echoes, blue-green-red). The early and late echoes (blue and red) peak at the CSF-gray matter boundary due to large vessel bias. As the time-point moves closer to the pure SE point (green), lower activation value at the pial surface is observed, demonstrating the ability of SE-EPTI to reduce T2’ contamination and draining vessel bias. The peak of the pure SE profile is located at the superficial cortical laminae, which may reflect the strong cortico-cortical input in the finger tapping experiment with touching26. A smaller peak at deep laminae was also observed, which may resulted from the spinal output activity26.
Conclusion
The preliminary results using finger tapping task suggest that the pure SE image of EPTI effectively reduced the draining vein bias, providing improved specificity to map layer-specific responses. Different responses were observed in superficial and deep layers in the motor cortex, which may reflect cortical input and output activation. More experiments will be conducted with different sensorimotor tasks to further validate the technique and investigate the layer-specific response using the pure SE image with high specificity.Acknowledgements
This work was supported by the NIH NIBIB (R01-EB020613, R01-EB019437, R01-EB016695, P41-EB030006, and U01-EB025162) and NIMM (R01-MH116173) and made possible by resources provided by Shared Instrumentation Grants S10-OD023637, S10-RR023401, S10-RR023043, and S10-RR019307.References
1 Constable, R. T., Kennan, R. P., Puce, A., McCarthy, G. & Gore, J. C. Functional NMR imaging using fast spin echo at 1.5 T. Magnetic resonance in medicine 31, 686-690 (1994).
2 Poser, B. A. & Norris, D. G. Fast spin echo sequences for BOLD functional MRI. Magnetic Resonance Materials in Physics, Biology and Medicine 20, 11 (2007).
3 Denolin, V. & Metens, T. Three‐dimensional BOLD fMRI with spin‐echo characteristics using T2 magnetization preparation and echo‐planar readouts. Magnetic Resonance in Medicine 50, 132-144 (2003).
4 Boxerman, J. L., Hamberg, L. M., Rosen, B. R. & Weisskoff, R. M. MR contrast due to intravascular magnetic susceptibility perturbations. Magnetic resonance in medicine 34, 555-566 (1995).
5 Bandettini, P. A. & Wong, E. C. Effects of biophysical and physiologic parameters on brain activation‐induced R2* and R2 changes: simulations using a deterministic diffusion model. International Journal of Imaging Systems and Technology 6, 133-152 (1995).
6 Norris, D. G. Spin-echo fMRI: the poor relation? Neuroimage 62, 1109-1115 (2012).
7 Koopmans, P. J. & Yacoub, E. Strategies and prospects for cortical depth dependent T2 and T2* weighted BOLD fMRI studies. Neuroimage 668-676 (2019).
8 Huber, L., Uludağ, K. & Möller, H. E. Non-BOLD contrast for laminar fMRI in humans: CBF, CBV, and CMRO2. NeuroImage 197, 742-760 (2019).
9 Norris, D. G. & Polimeni, J. R. Laminar (f) MRI: A short history and future prospects NeuroImage (2019).
10 Goense, J. B. & Logothetis, N. K. Laminar specificity in monkey V1 using high-resolution SE-fMRI. Magnetic resonance imaging 24, 381-392 (2006).
11 Bandettini, P. A., Wong, E. C., Jesmanowicz, A., Hinks, R. S. & Hyde, J. S. Spin‐echo and gradient‐echo EPI of human brain activation using BOLD contrast: a comparative study at 1.5 T. NMR in Biomedicine 7, 12-20 (1994).
12 Yacoub, E. et al. Spin‐echo fMRI in humans using high spatial resolutions and high magnetic fields. Magnetic Resonance in Medicine 49, 655-664 (2003).
13 Pfaffenrot, V., Voelker, M. N., Kashyap, S. & Koopmans, P. J. Laminar fMRI using T2-prepared multi-echo FLASH. NeuroImage, 118163 (2021).
14 Kemper, V. G. et al. Sub-millimeter T2 weighted fMRI at 7 T: comparison of 3D-GRASE and 2D SE-EPI. Frontiers in neuroscience 9, 163 (2015).
15 Beckett, Alexander JS, et al. "Comparison of BOLD and CBV using 3D EPI and 3D GRASE for cortical layer functional MRI at 7 T." Magnetic resonance in medicine 84.6 (2020): 3128-3145.
17 Park, S., Torrisi, S., Townsend, J. D., Beckett, A. & Feinberg, D. A. Highly accelerated submillimeter resolution 3D GRASE with controlled blurring in‐weighted functional MRI at 7 Tesla: A feasibility study. Magnetic Resonance in Medicine 85, 2490-2506 (2021).
18 Olman, C. A. et al. Layer-specific fMRI reflects different neuronal computations at different depths in human V1. PloS one 7, e32536 (2012).
19 De Martino, F. et al. Cortical depth dependent functional responses in humans at 7T: improved specificity with 3D GRASE. PloS one 8, e60514 (2013).
20 Huber, L., Uludağ, K. & Möller, H. E. Non-BOLD contrast for laminar fMRI in humans: CBF, CBV, and CMRO2. NeuroImage (2017).
21 Huber, L. et al. Slab‐selective, BOLD‐corrected VASO at 7 Tesla provides measures of cerebral blood volume reactivity with high signal‐to‐noise ratio. Magnetic resonance in medicine 72, 137-148 (2014).
22 Jin, T. & Kim, S.-G. in 2006 International Conference of the IEEE Engineering in Medicine and Biology Society. 25-28 (IEEE).
23 Lu, H., Golay, X., Pekar, J. J. & Van Zijl, P. C. Functional magnetic resonance imaging based on changes in vascular space occupancy. Magnetic Resonance in Medicine 50, 263-274 (2003).
24 Huber, L. et al. Layer-dependent functional connectivity methods. Progress in Neurobiology, 101835 (2020).
25 Chai, Y., Li, L., Huber, L., Poser, B. A. & Bandettini, P. A. Integrated VASO and perfusion contrast: A new tool for laminar functional MRI. Neuroimage 207, 116358 (2020).
26 Huber, L. et al. High-resolution CBV-fMRI allows mapping of laminar activity and connectivity of cortical input and output in human M1. Neuron 96, 1253-1263. e1257 (2017).
27 Wang, F. et al. Echo planar time-resolved imaging (EPTI). Magnetic resonance in medicine 81, 3599-3615, doi:10.1002/mrm.27673 (2019).
28 Wang, F., Dong, Z., Wald, L. L., Polimeni, J. R. & Setsompop, K. Simultaneous pure T2 and varying T2'-weighted BOLD fMRI using Echo Planar Time-resolved Imaging for mapping cortical-depth dependent responses. NeuroImage 245, 118641 (2021).
29 Dong, Z., Wang, F., Reese, T. G., Bilgic, B. & Setsompop, K. Echo planar time-resolved imaging with subspace reconstruction and optimized spatiotemporal encoding. Magnetic resonance in medicine 84, 2442-2455 (2020).
30 Liang, Z.-P. in 2007 4th IEEE International Symposium on Biomedical Imaging: From Nano to Macro. 988-991 (IEEE).
31 Cox, R. W. AFNI: software for analysis and visualization of functional magnetic resonance neuroimages. Computers and Biomedical research 29, 162-173 (1996).
32 Woolrich, M. W., Ripley, B. D., Brady, M. & Smith, S. M. Temporal autocorrelation in univariate linear modeling of FMRI data. Neuroimage 14, 1370-1386 (2001).
33 Fischl, B. FreeSurfer. Neuroimage 62, 774-781 (2012).
34 Desikan, R. S. et al. An automated labeling system for subdividing the human cerebral cortex on MRI scans into gyral based regions of interest. NeuroImage 31, 968-980 (2006).
35 Waehnert, M. et al. Anatomically motivated modeling of cortical laminae. Neuroimage 93, 210-220 (2014).
36 Waehnert, M. D. et al. A subject-specific framework for in vivo myeloarchitectonic analysis using high resolution quantitative MRI. NeuroImage 125, 94-107 (2016).
Figures