3331
Optimization of wide-field optical imaging method towards fMRI integration in mice1Biomedical Engineering, Emory University/Georgia Institute of Technology, Atlanta, GA, United States, 2Biology, Emory University, Atlanta, GA, United States
Synopsis
We present an optimized wide-field optical imaging method with GEVI in mice to probe the relationship between slow changes in neuronal membrane potential and the BOLD signal in hindpaw stimulation, demonstrate neuronal sub-threshold activity of slow fluctuations could be possibly isolated from hemodynamic signals.
INTRODUCTION
fMRI is widely appreciated for its methodological advantage of non-invasive whole-brain coverage for macroscale functional network studies. Since fMRI relies on hemodynamic signals that indirectly reflect neural activity, the interpretation of signal changes is difficult, given uncertainty about the contributions from neural activity and hemodynamics. By comparison, optical imaging methods, especially current genetically encoded biosensor technologies, are providing specific information about a variety of neural signals, although the approach is relatively invasive 1,2,3. Obviously, combination of these two major methods is an exciting direction that can bring the advantages of both techniques to bear on research questions in neuroscience. Because the BOLD signal is inherently low frequency, an optimized method that would allow separation of fast and slow neuronal processes would be particularly helpful for interpreting fMRI. In this report, we present our initial work on optimization of the wide-field optical imaging method for eventual integration with fMRI to probe the relationship between slow changes in neuronal membrane potential and the BOLD signal. The key steps for isolating the neuronal contribution in wide-field imaging were explored in our studies.METHODS
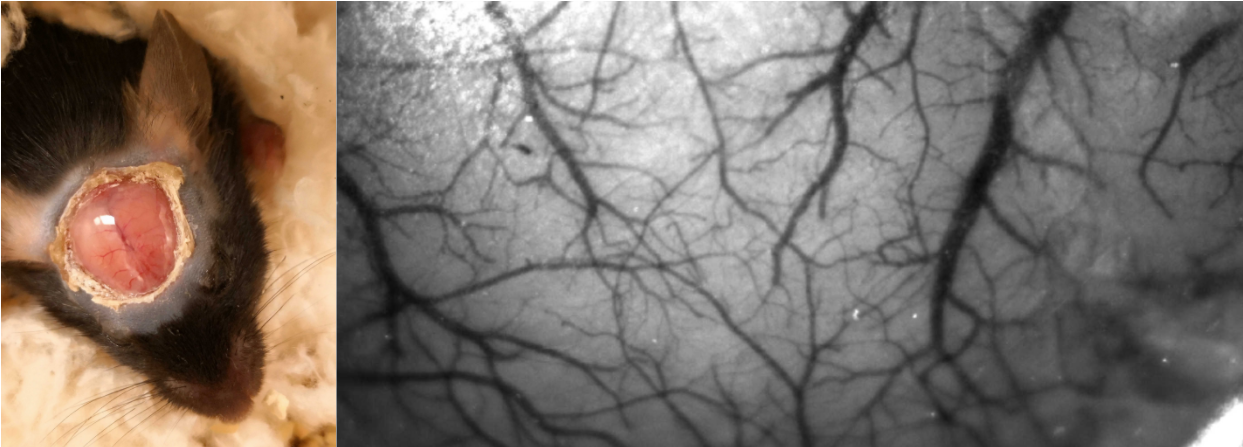
First, we developed a novel crystal optical window method for mice (n=10, male adult) for improved transparency and stability, as shown in Figure 1. For the optical window preparation, the skull bone is milled to the lower layer and cured with optical adhesive covering (Thorlabs, NOA68). Four mice (adult males) with genetically encoded voltage indicators (Emx1-Cre line neonatal injection of DIO-JEDI-Kv2.1 virus vector, the JEDI obtained and credited from Francois St. Pierre’s lab)) were examined using the crystal window method. The voltage signals from excitatory neuronal activity on the soma membrane across the brain were obtained in green fluorescence. The optical imaging system was set up with a customized simultaneous two-camera imaging system and multi-channel fiber-based illumination. The blue LED light was filtered (Semrock, FF01-466/40) for fluorescence excitation. The emitted green fluorescent signals were reflected to a high speed CMOS camera (KURO 1200B) in 50 Hz via a dichroic mirror (Semrock, FF518-Di01). The camera channel was also used to capture the intrinsic optical signals (IOS) of the same wavelength range (filter: Semrock, FF03-525/50), alternating in 50 Hz over direct green light illumination. The image resolution was 200*200 pixels in 12- or 16-bit gray scale. Meanwhile, we used a second camera for imaging either red fluorescence or 800nm IOS activity with concurrent NIR illumination. In this study, all animals were imaged under light anesthesia, 0.5% isoflurane + 0.01mg/kg dexmedetomidine. The classical hind paw current stimulation paradigm (4Hz, 10ms 0.6-0.7mA pulses, block design with 5s on and 25s off for 20 cycles in 10 min) was used to investigate the relationship between hemodynamic responses and neuronal voltage responses. The block design of stimulation was convolved with either a two-gamma function or a triangle wave for predicting a response for fast or slow frequency components, including the 4 Hz responses to individual electrical pulses and < 0.1Hz slow responses that includes cyclic stimulation epochs. The data were preprocessed before further analysis, including spatial Gaussian smoothing and notch filtering of respiratory/cardiac frequencies and their harmonics in time courses. The correlation between the stimulation model and signal of each pixel was used for mapping the cortical responses.RESULTS
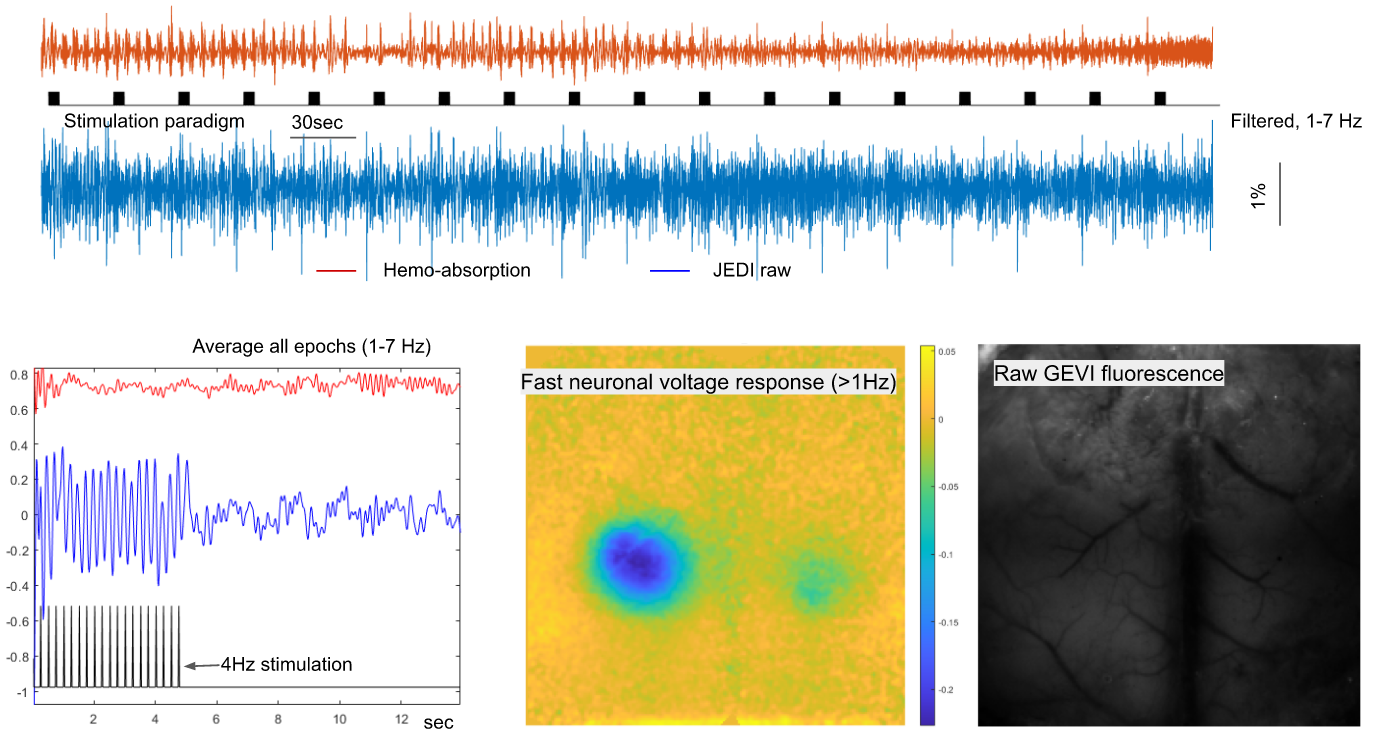
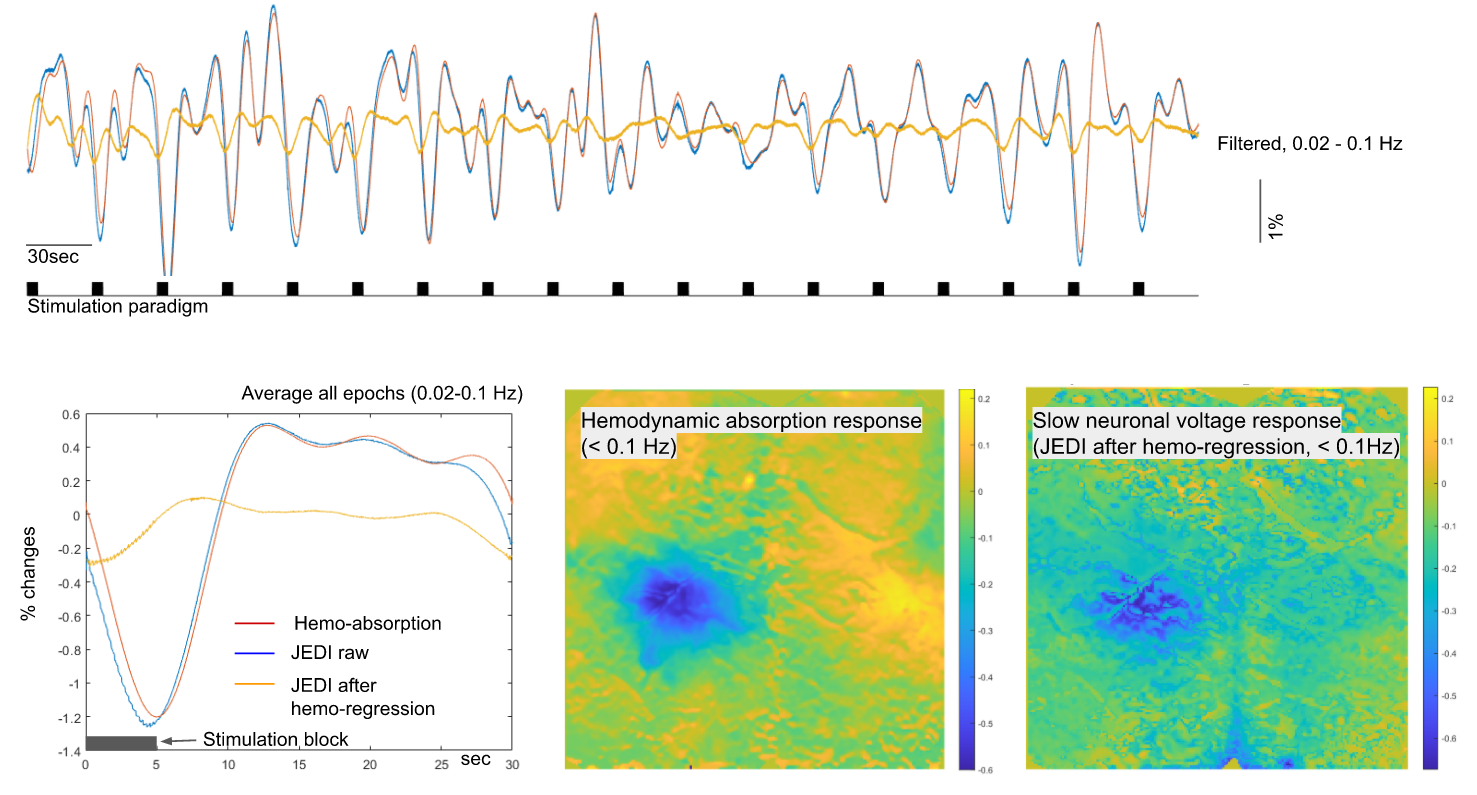
Reproducible activation in response to stimulation was observed across GEVI mice, as demonstrated by a representive in Figure 2 and 3. In response to a peripheral stimulation, localized responses were observed in the cortex of opposite hemisphere. The GEVI signals include both high- and low-frequencies, but IOS hemodynamics in same wavelength range show slow frequency responses only. The slow GEVI responses have similar fluctuation profiles to the hemodynamic changes in the period after stimulation, but there are detectable differences during the stimulation and few seconds after the stimulation period that may indicate a decoupling between slow neural activity and hemodynamics. The peak of corrected JEDI slow responses show a significantly early than hemodynamic response peak (Figure 3, identifiable from individual stimulation epochs and average plot). The GEVI signal intensity changed from high to low, i.e. downward direction, in response to peripheral inputs on both fast signals and slow signals (after IOS correction). Compared to the rapid activity, the slow neural fluctuations are relatively noisy and less localized, with the spatial pattern closely corresponding to the hemodynamic changes, another suggestion that slow neural activity is more closely linked to the fMRI signal.DISCUSSION/CONCLUSION
The crystal optical window preparation facilitates high quality imaging for the integration of multiple signal components. The GEVI method provides a valuable opportunity to image neuronal sub-threshold activities as well action potentials 3,4. The sub-threshold neuronal activities may play an essential functional role in the coordination of neuronal circuit communication and distant network activity 4. The sub-threshold neuronal coordination would have significant implications for the interpretation of fMRI. Our studies suggest the possibility of separating slow neuronal processes from hemodynamic activity with GEVI for future combination with fMRI.Acknowledgements
No acknowledgement found.References
1. Sepehri Rad, M. et al. Voltage and Calcium Imaging of Brain Activity. Biophys. J. 113, 2160–2167 (2017).
2. Jing, M. et al. An optimized acetylcholine sensor for monitoring in vivo cholinergic activity. Nat. Methods 2020 1711 17, 1139–1146 (2020).
3. Zhu, M. H., Jang, J., Milosevic, M. M. & Antic, S. D. Population imaging discrepancies between a genetically-encoded calcium indicator (GECI) versus a genetically-encoded voltage indicator (GEVI). Sci. Reports 2021 111 11, 1–15 (2021).
4. Knöpfel, T., Song, C. Optical voltage imaging in neurons: moving from technology development to practical tool. Nat Rev Neurosci 20, 719–727 (2019).
Figures