3328
Fast 3D fMRI Acquisition over a Small Field-of-View with (k, t)-Space Undersampling1Center for Magnetic Resonance Research, University of Illinois at Chicago, Chicago, IL, United States, 2Department of Biomedical Engineering, University of Illinois at Chicago, Chicago, IL, United States, 3Departments of Radiology and Neurosurgery, University of Illinois at Chicago, Chicago, IL, United States
Synopsis
The simultaneous multi-slice EPI (SMS-EPI) technique is widely used in fast fMRI studies to achieve a short TR (e.g., < 1 s), but its image quality can be degraded when the slices span only a small brain area. In this study we develop a fast fMRI acquisition technique for imaging a small area by employing (k, t)-space undersampling and three-dimension reduced field-of-view imaging (k-t 3D-rFOVI). Our human fMRI experiments covering the visual cortex demonstrate that k-t 3D-rFOVI can provide higher detection sensitivity of brain activations than SMS-EPI.
Introduction
In fast fMRI studies, the image acquisition needs to be accelerated to achieve a short TR (e.g., < 1 sec). Currently, simultaneous multi-slice EPI (SMS-EPI)1-3 is the mainstream image acceleration technique used in fast fMRI. However, the image quality of SMS-EPI can be substantially degraded if the scan covers only a small brain area (e.g., visual cortex) in the slice direction (z), because the receiver coil cannot provide enough sensitivity variations for effectively separating the aliased voxels.4 This study aims to develop a new fast fMRI acquisition technique that integrates the (k, t)-space undersampling method5 into the three-dimension reduced field-of-view imaging (3D-rFOVI).6 Through human fMRI experiments in the visual cortex, we demonstrate the capability of k-t 3D-rFOVI in fast fMRI data acquisition over a focused imaging area.Methods
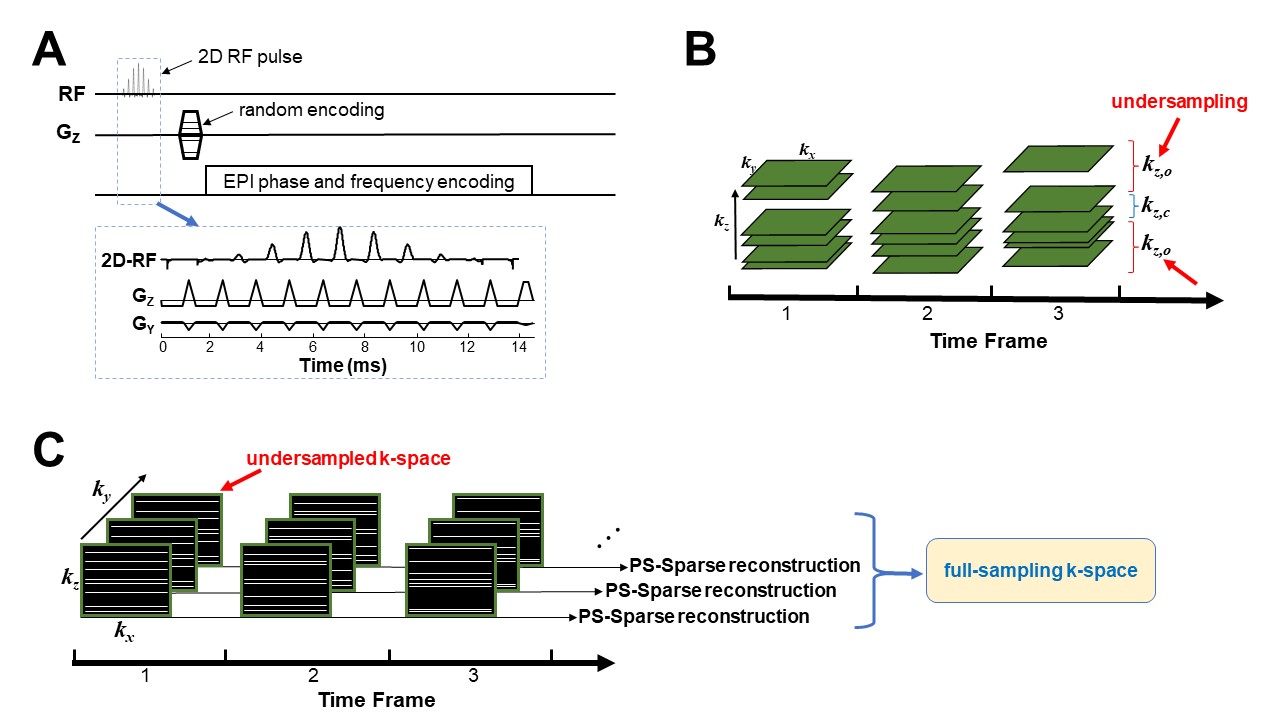
k-t 3D-rFOVI pulse sequence: As shown in Fig. 1A, a slab-selective 2D RF pulse6 was employed in the k-t 3D-rFOV sequence to excite a small 3D field of view. The RF pulse was composed of eleven sub-pulses that were modulated by an envelope pulse with pulse-width = 14.7 ms. The time-bandwidth product of sub-pulse/envelope pulse was 3.01/3.53. The phase encoding steps in the through-slab direction (or z-direction) were randomized to enable the undersampling of k-space in z (kz). The k-space points in x- and y-directions (kx and ky) were fully sampled using a gradient-echo EPI module. In each image volume (time frame), the central kz planes (kz,c) were fully sampled while the outer kz regions (kz,o) were randomly undersampled (Fig. 1B), such that the number of sampled kz planes was reduced from Nz to Ns (Nz is the number of kz planes in full k-space sampling) with the corresponding acceleration factor (R) = Ns/Nz.Image reconstruction: The k-space time series of k-t 3D-rFOVI included Nt time frames each with a Nx×Ny×Ns k-space matrix. The kx-kz planes were extracted for each ky position to create Ny undersampled k-space time series (Fig. 1C). They were separately reconstructed to full-sampling k-space time series of Nx×Ny×Nz using the PS-Sparse algorithm,5and then combined to a Nx×Ny×Nz×Nt dataset. 3D-FFT was applied to the k-space data at each time frame to obtain the final images.
Human fMRI experiments: fMRI experiments were conducted in healthy subjects on a GE MR750 3T scanner with a 32-channel head coil. The 4-min visual task paradigm consisted of interleaved 16s/16s rest/stimulation blocks and 8-Hz flashing checkerboard patterns were used as the stimuli. fMRI images covering the visual cortex were acquired using the k-t 3D-rFOVI sequence: FOV=19.2×9.6×4.8 cm3, matrix=128×64×32 (resolution=1.5×1.5×1.5 mm3), number of samples in kz,c/kz,o = 2/6 (Ns = 8 and R = 4), TR/volume-TR/TE = 100/800/30 ms, and flip angle = 22°. For comparison, an additional fMRI scan was performed with a commercial SMS-EPI sequence: FOV=19.2×19.2 cm2, matrix=128×128, 32 slices with slice thickness = 1.5 mm, in-plane/slice acceleration factor = 2/4, flip angle = 52°, and TR/TE = 800/30 ms.
fMRI data analysis: The fMRI data were analyzed in AFNI. To evaluate the image quality, the temporal SNR (TSNR) was calculated in the fMRI images after motion correction and averaged over all the brain areas in the k-t 3D-rFOV images. The mean TSNR in the same zoomed brain areas as in the k-t 3D-rFOV was also measured in the SMS-EPI images. The fMRI data were smoothed with FWHM=2 mm. t-maps were obtained from the general linear model analysis and then thresholded with p<0.001 and cluster corresponding to FPR<0.05 to detect the brain activation. The number of activated voxels and average t-value were measured in the visual cortex.
Results
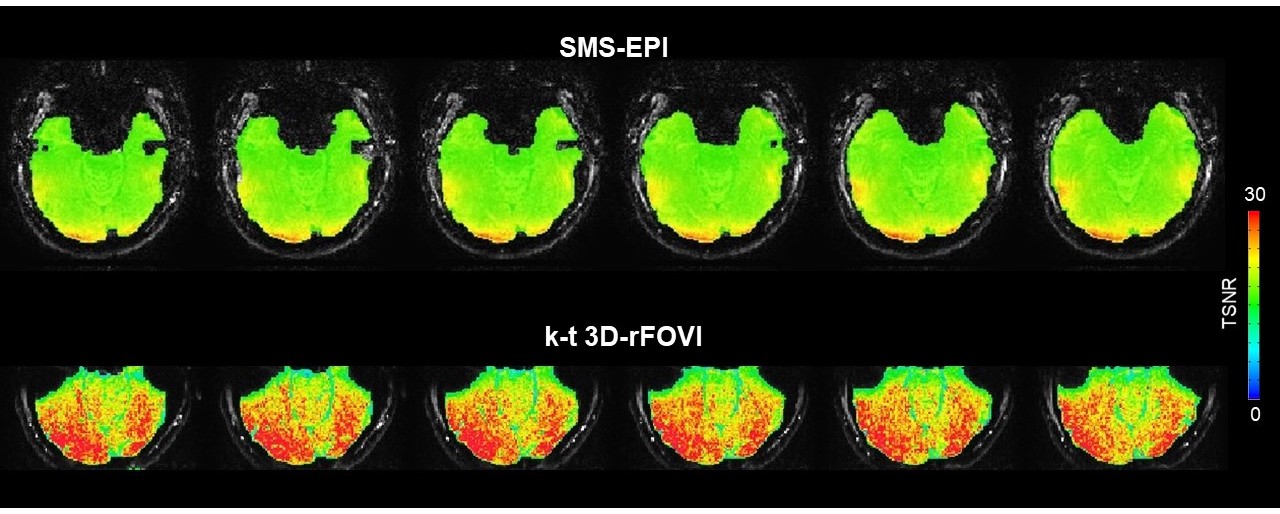
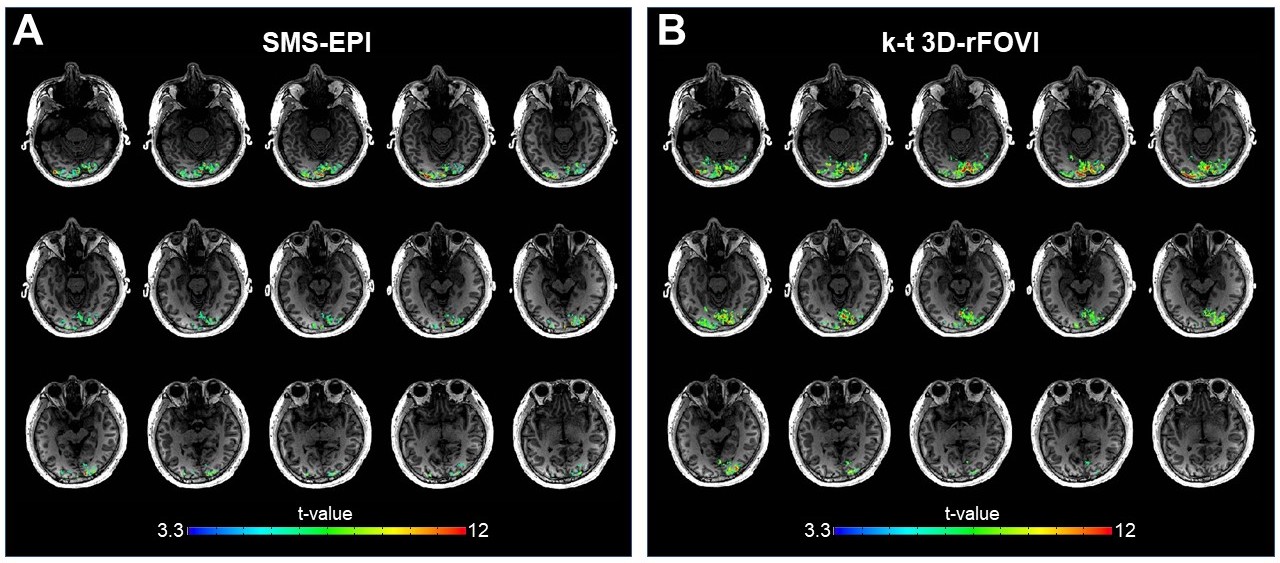
Fig. 2 illustrates SMS-EPI and k-t 3D-rFOVI images from the representative subject. Severe g-factor noise appeared in the SMS-EPI images due to the small distance between the simultaneous slices (=1.2 cm). Compared to the SMS-EPI, k-t 3D-rFOVI provided better image quality for visualizing the brain structures. Additionally, the mean TSNR was increased from 6.8 in the SMS-EPI images to 22.3 in the k-t 3D-rFOVI scan, as illustrated in Fig. 3. In the fMRI activation maps (Fig. 4), there were more activated voxels in the k-t 3D-rFOVI (3869 voxels) than the SMS-EPI (3672 voxels) scan in the visual cortex, and the average t-value of activated foci was elevated by approximately 26% in the k-t 3D-rFOVI scan (t-value = 8.1) relative to the SMS-EPI (t-value = 6.4).Discussion and Conclusions
In this study, we developed a k-t 3D-rFOVI pulse sequence for acquiring fMRI data in a reduced field of view with a high spatial resolution (1.5-mm isotropic) and short TR (800 ms). The human visual fMRI experiments have demonstrated that k-t 3D-FOVI provides higher fMRI image quality than SMS-EPI and considerably improves the detection sensitivity of brain activations. These results indicate that k-t 3D-rFOVI can be a strong contender for fast fMRI studies in a focused brain area. In addition, R = 4 was used in the k-t 3D-rFOVI fMRI experiment, which acquired 300 time frames during the 4-min scan. The PS-Sparse reconstruction method can allow a higher undersampling rate in k-space by increasing the number of time points5, leading to increased acceleration factor and shortened TR in a longer fMRI scan.Acknowledgements
This work was supported in part by the National Institutes of Health (Grant No. 5R01EB026716-01 and 1S10RR028898-01). The content is solely the responsibility of the authors and does not necessarily represent the official views of the National Institutes of Health.References
1. Nunes R, Hajnal JV, Golay X, Larkman DJ. Simultaneous slice excitation and reconstruction for single shot EPI. The Annual Meeting of ISMRM 2006, Seattle.
2. Moeller S, Yacoub E, Olman CA, Auerbach E, Strupp J, Harel N, Ugurbil K. Multiband multislice GE-EPI at 7 Tesla, with 16-fold acceleration using partial parallel imaging with application to high spatial and temporal whole-brain fMRI. Magn Reson Med. 2010;63:1144–1153.
3. Feinberg DA, Moeller S, Smith SM, Auerbach E, Ramanna S, Gunther M, Glasser MF, Miller, KL, Ugurbil K, Yacoub E. Multiplexed echo planar imaging for sub-second whole brain FMRI and fast diffusion imaging. PLoS ONE. 2010;5:e15710.
4. Barth M, Breuer F, Koopmans PJ, Norris DG, Poser BA. Simultaneous multislice (SMS) imaging techniques. Magn Reson Med 2016;75:63-81.
5. Zhao B, Haldar JP, Christodoulou AG, Liang Z-P. Image reconstruction from highly undersampled (k, t)-space data with joint partial separability and sparsity constraints. IEEE Trans Med Imaging 2012;31:1809-1820.
6. Sun K, Zhong Z, Dan G, Karaman M, Luo Q, Zhou XJ. Three-dimensional reduced field-of-view imaging (3D-rFOVI). Proceedings of the 2021 Annual Meeting of ISMRM; S4193.
Figures