3327
Benefits of echo combination for high-spatial-resolution ME resting state FMRI on a compact 3T scanner1Department of Radiology, Mayo Clinic, Rochester, MN, United States, 2GE Global Research, Niskayuna, NY, United States, 3Department of Physiology, Hanyang University, Seoul, Korea, Republic of, 4GE Healthcare, Buc, France
Synopsis
For multi-echo EPI, the T2*-weighted echo combination (T2EC) is a commonly used pre-processing step to boost the data quality. We assessed the benefit of T2EC in high-spatial-resolution multi-echo fMRI with explained variances and functional connectivity detectability. The performance was evaluated and compared with single-echo EPI for resting state fMRI on a compact 3T scanner with high-performance gradients. It was shown that a large portion of unwanted signal variance was globally suppressed through T2EC. Multi-echo acquisition shows improved image intensity and enhanced functional sensitivity in brain regions affected by signal-dropout.
Introduction
Multi-echo(ME)-fMRI is known to provide better BOLD contrast sensitivity due to higher signal-to-noise ratio and broadened optimal T2* coverage than single-echo (SE) fMRI acquisition1. ME-fMRI is especially suitable for the compact 3T (C3T) scanner equipped with high slew rate gradient (peak slew-rate 700T/m/s) 2 as the reduced echo-spacing can compensate for the extra time needed for additional echoes. Whole-brain high-spatial-resolution resting-state ME-fMRI was shown to be feasible on the C3T scanner with practical echo times for all three echoes2. T2*-weighted echo combination (T2EC) was used as a preprocessing step for ME echo-planar-imaging (ME-EPI) acquisition to yield improved temporal SNR. In our study, to analyze the benefit of T2EC, we assessed the marginal explained variance of T2EC and compared with the variance associated with other artifact regressors3. Also, we investigated the improved resting-state functional connectivity (FC) detection, especially in regions suffering from signal dropout when compared with a SE-fMRI acquisition.Methods
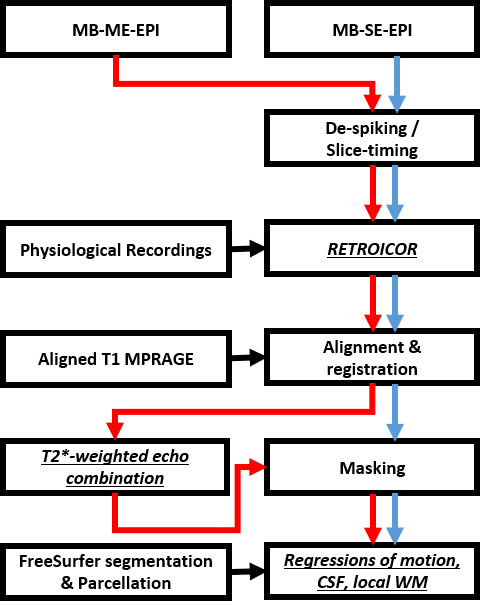
Under an IRB-approved protocol and with written informed consent, T1-weighted anatomical images (1 mm3 isotropic), multi-band (MB) ME-EPI (TR = 0.93s, TEs = 11.8, 29.8, 47.8ms, FA = 59°, in-plane×MB accelerations = 2×4, voxel size 2.43mm3, 52 slices, full k-space sampling, total scan time = 5mins × 2 sessions) and SE-EPI images (TR = 0.7s, TE = 30ms, FA = 52°, total scan time = 11mins, otherwise same as ME-EPI) were acquired from 17 healthy volunteers with a 32-channel head coil (Nova Medical, Wilmington, MA,US).The preprocessing pipeline for artifact-reduction was depicted in Fig. 1, using AFNI, SUMA, and FreeSurfer software packages1,3-8. For FC estimation, the artifact-reduced time series were bandpass-filtered with a frequency range of 0.009 to 0.1 Hz and smoothed by a Gaussian kernel with a 4 mm FWHM. To focus on the sole benefit of T2EC, all other processing steps are kept the same between all comparisons.
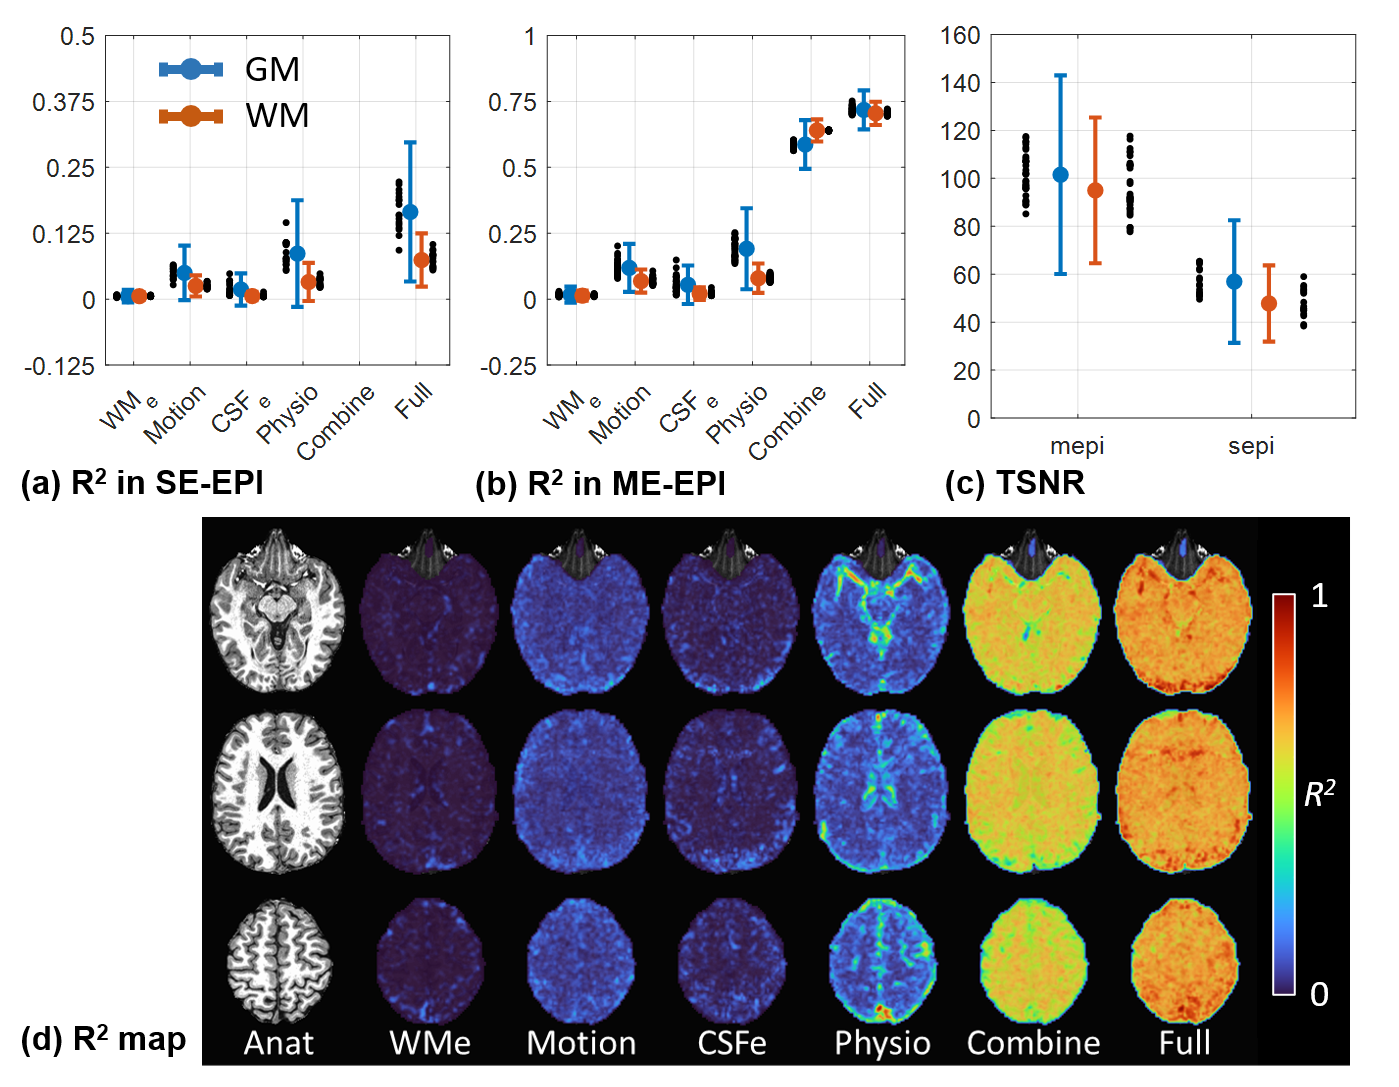
The marginal explained variance R2 value is applied to represent the proportion of signal variance reduction for a certain preprocessing step to the variance with all preprocessing steps3. R2 is defined as: $$$R^2_{step}≡1-SS_{total}/SS_{step}$$$, where SStotal is the error sum of squares with all preprocessing steps and SSstep is the error sum of squares with all preprocessing steps except for a certain step. Without the bandpass filtering and spatial smoothing on datasets, R2 are evaluated for the conventional artifact-related regressors of RETROICOR (Physio)6, ANATICOR (WMe)3, motion and ventricles (CSFe), and for T2EC in ME datasets, separately in GM and WM voxels across all subjects.
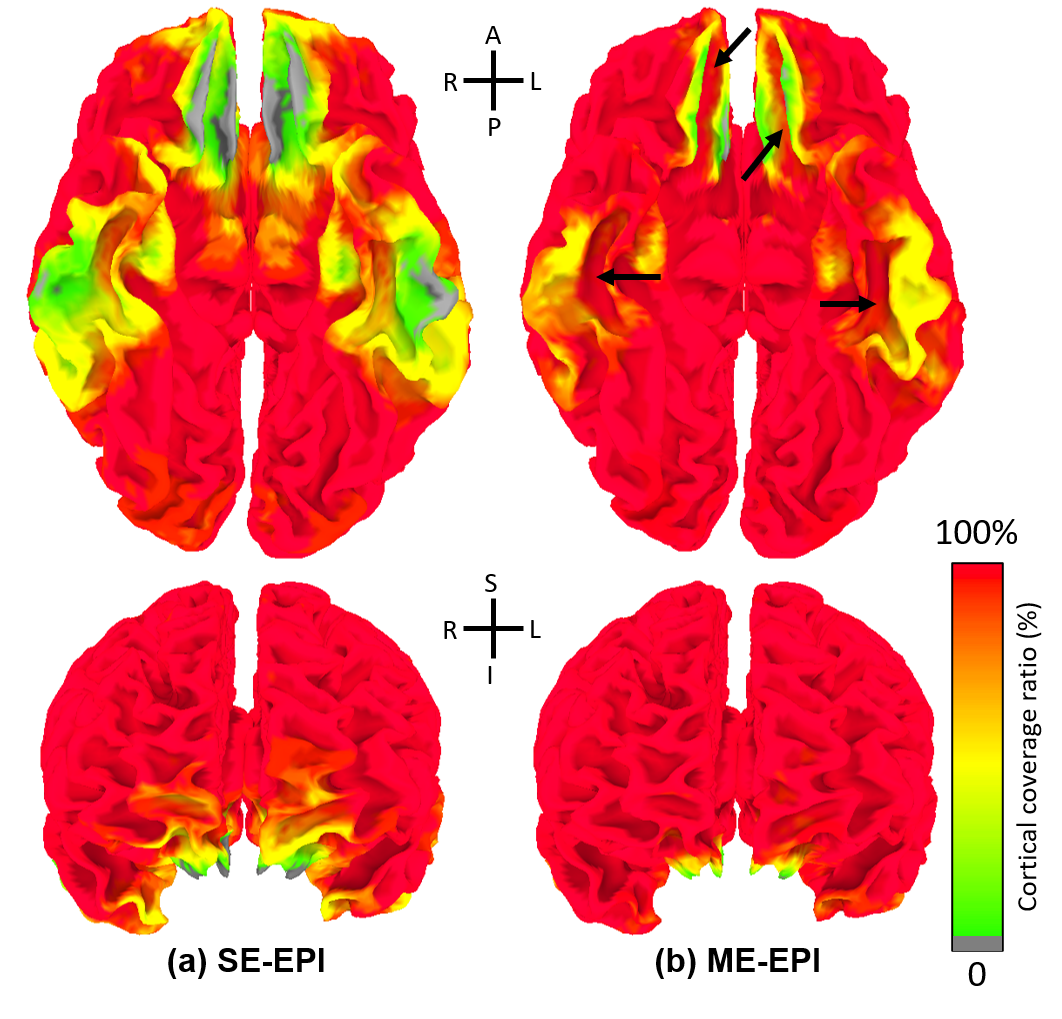
To investigate the effect of T2EC on BOLD detection, the cortical coverage ratio was evaluated on the 3D surface model for both SE and ME datasets9. Also, the effect of the BOLD sensitivity improvement on FC was also investigated by ROI-based FC. With 168 cortical parcellations defined by FreeSurfer software, the inter-ROI FCs were calculated as Pearson correlation coefficient between ROIs. Fisher-transformed FCs composed a FC matrix of 168×168. Paired Student’s t-test for group comparison was applied to the FC matrices obtained from SE- and ME-EPI datasets. We thresholded inter-ROI FCs with a statistically significant difference (p<0.01) and a selected FC value (Fisher(r) > 0.3) and counted the number of the inter-ROI FCs survived by the two thresholds.
Results
In Fig. 2(a,b), the conventional regressors for multi-echo acquisitions showed a similar trend in R2 as those for single-echo acquisitions. R2 for T2EC were substantially higher than the other regressors, which indicated that a fairly large portion of signal variances was removed through T2EC. In Fig. 2(d), R2 for T2EC in general accounts for most of the explained variance.Fig. 3 showed the cortical coverage ratio, in which the T2EC enhanced signal intensity even in some high-susceptibility regions. Particularly, cortex along the medial orbital sulci (olfactory sulci) and anterior transverse collateral sulci showed signal intensity improvement across almost all of subjects10.
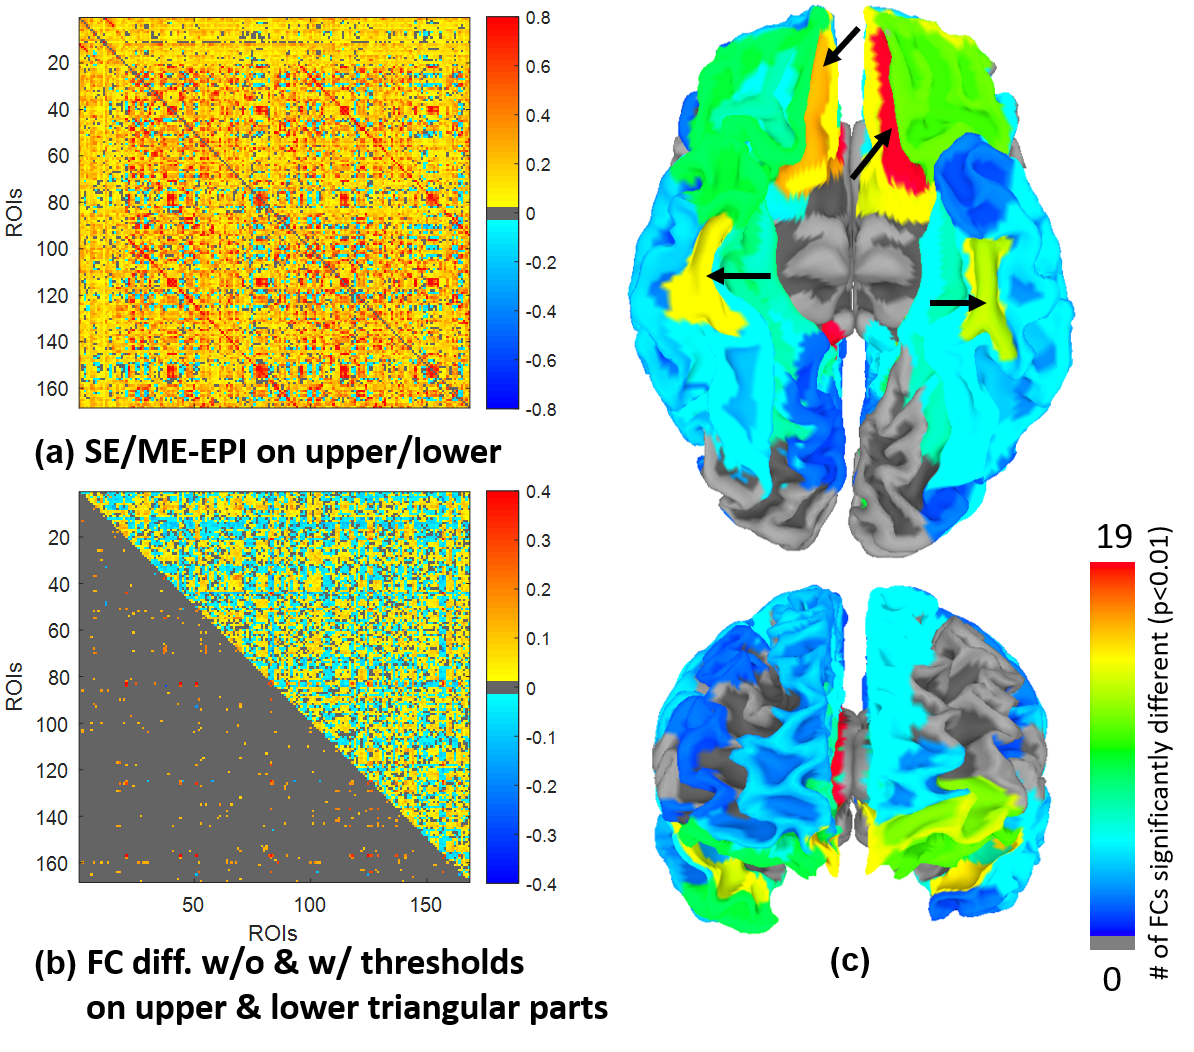
ROI-based group FCs were given in Fig. 4(a), where the upper and lower triangles are for SE and ME datasets, respectively. Difference of ROI-based group FCs was given in Fig. 4(b), where upper and lower triangles denote group difference without/with the thresholds, respectively. Most of significant group differences with thresholds showed higher FC magnitude for ME than SE. As indicated in Fig. 4(c), the four regions (indicated with arrows) which had statistically and functionally significant differences than others were consistent with the regions indicated in Fig. 3.
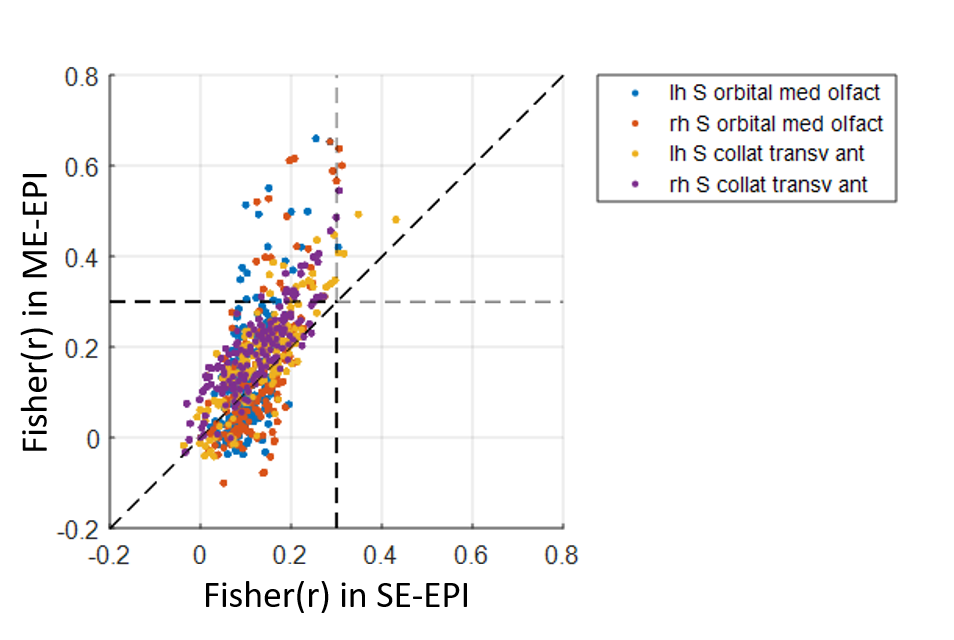
Fig. 5 showed all inter-ROI group FCs derived from the four regions marked in Figs 3 and 4. SE datasets produced only limited number of weak inter-ROI FCs while ME datasets detected more and stronger inter-ROI FCs.
Discussion
Explained variance of echo-combining compared with the various of other regressors on ME-fMRI dataset shows strong thermal noise suppression result from T2EC, which leads to high temporal SNR for ME acquisition. Inter-ROI FC analysis comparison between SE-fMRI and ME-fMRI shows the improved robustness in BOLD sensitivity of ME-fMRI especially in the inferior frontal and temporal lobes, important brain regions that commonly suffer from signal dropout on BOLD imaging studies.Conclusion
For a high-spatial-resolution resting-state fMRI study performed on a C3T, T2*-weighted echo combination preprocessing for ME-fMRI reduced thermal-noise-related signal variance and improved BOLD sensitivity in signal-dropout brain regions.Acknowledgements
This work was supported by NIH U01 EB024450 and NIH U01 EB026979.References
1. Poser, B.a., et al., BOLD contrast sensitivity enhancement and artifact reduction with multiecho EPI: Parallel-acquired inhomogeneity-desensitized fMRI. Magnetic Resonance in Medicine, 2006. 55(6): p. 1227-1235.
2. Kang, D., et al. Feasibility of high spatial and temporal resolution multi-echo multi-band whole brain resting-state functional MRI on a compact 3T system. in Proc. Intl. Soc. Mag. Reson. Med. 2020.
3. Jo, H.J., et al., Mapping sources of correlation in resting state FMRI, with artifact detection and removal. Neuroimage, 2010. 52(2): p. 571-82.
4. Cox, R.W., AFNI: software for analysis and visualization of functional magnetic resonance neuroimages. Comput Biomed Res, 1996. 29(3): p. 162-73.
5. Reuter, M., et al., Within-subject template estimation for unbiased longitudinal image analysis. Neuroimage, 2012. 61(4): p. 1402-18.
6. Glover, G.H., T.Q. Li, and D. Ress, Image-based method for retrospective correction of physiological motion effects in fMRI: RETROICOR. Magnetic Resonance in Medicine, 2000. 44(1): p. 162-167.
7. Saad, Z.S., et al., SUMA: An interface for surface-based intra- and inter-subject analysis with AFNI, in 2004 2nd IEEE International Symposium on Biomedical Imaging: Macro to Nano. 2004. p. 1510-1513.
8. Destrieux, C., et al., Automatic parcellation of human cortical gyri and sulci using standard anatomical nomenclature. Neuroimage, 2010. 53(1): p. 1-15.
9. Kang, D., et al., The benefit of high-performance gradients on echo planar imaging for BOLD-based resting-state functional MRI. Phys Med Biol, 2020. 65(23): p. 235024.
10. Fernandez, B., et al., Multi-echo EPI of human fear conditioning reveals improved BOLD detection in ventromedial prefrontal cortex. Neuroimage, 2017. 156: p. 65-77.
Figures