3325
Improved Fidelity for Resting-State Connectivity Measurements in High-Spatial-Resolution ME-fMRI on a Compact 3T Scanner1Department of Radiology, Mayo Clinic, Rochester, MN, United States, 2GE Global Research, Niskayuna, NY, United States, 3Department of Physiology, Hanyang University, Seoul, Korea, Republic of, 4GE Healthcare, Buc, France
Synopsis
Through echo-combination, multi-echo echo-planar-imaging (ME-EPI) has shown improved performance for fMRI over single-echo (SE)-EPI. The high-performance gradients on a compact 3T scanner enable whole-brain high-spatial-resolution ME-EPI with reasonable echo times and comparable TR to SE-EPI. To evaluate the fidelity of the ME-EPI sequence in resting state fMRI and compare with that of SE-EPI sequence, seed-based and ICA-based functional connectivity (FC) analyses were applied to evaluate scan-time-dependency and accuracy improvement. ME-EPI extracted more and stronger FCs in seed-based connectivity analysis and produced higher sensitivity and accuracy in ICA-based method, compared to SE-EPI.
Introduction
A compact 3T (C3T) scanner with high-performance gradients (80 mT/m and 700 T/m/s) enables shorter echo spacing/train durations and improves image fidelity for echo-planar-imaging (EPI)1-3. As an advanced fMRI imaging approach, multi-echo EPI (ME-EPI) could potentially provide enhanced BOLD sensitivity4,5 and further information of dynamic T2* closely reflecting neuronal activity6,7 at the cost of increased imaging time compared to single-echo EPI (SE-EPI). A multi-band (MB), ME-EPI was recently implemented on the C3T to fully utilize the high slew rate to achieve high-spatial-resolution fMRI with whole-brain coverage and reasonable echo times8. In this study, the performance of the ME-EPI was assessed in a resting-state fMRI study through seed-based and independent-component-analysis (ICA) based functional connectivity (FC) analyses and compared with the SE-EPI acquisition.Methods
Under an IRB-approved protocol and with written informed consent, T1-weighted anatomical images (1 mm3 isotropic), ME-EPI (TR = 0.94s, TEs = 11.8, 29.8, 47.8 ms, FA = 59°, in-plane × MB accelerations = 2×4, voxel size 2.43 mm3, 52 slices, full k-space sampling, total scan time = 5 min. × 2 sessions) and SE-EPI images (TR = 0.7s, TE = 30 ms, FA = 52°, total scan time = 11 min., otherwise same as ME-EPI) were acquired from 21 healthy volunteers with a 32-channel head coil (Nova Medical, Wilmington, MA,US). A subgroup of 17 volunteers were scanned with the ME-EPI sequences.The preprocessing pipeline for artifact-reduction was performed using AFNI and FreeSurfer software packages4,9-13, including initial volume truncation, de-spiking, Legendre polynomial detrending and regressions for RETROICOR11, slice-timing correction, ANATICOR12, motion and ventricle regressions. T2*-weighted echo combination was performed only for ME datasets4. Additionally, the artifact-reduced residual time series were censored by sudden motion detection, bandpass-filtered with 0.009 to 0.1 Hz and smoothed by a Gaussian kernel with a 4 mm FWHM. The preprocessed datasets were spatially normalized into MNI152_T1_2009c template in AFNI and temporally to unit time-course standard deviation.
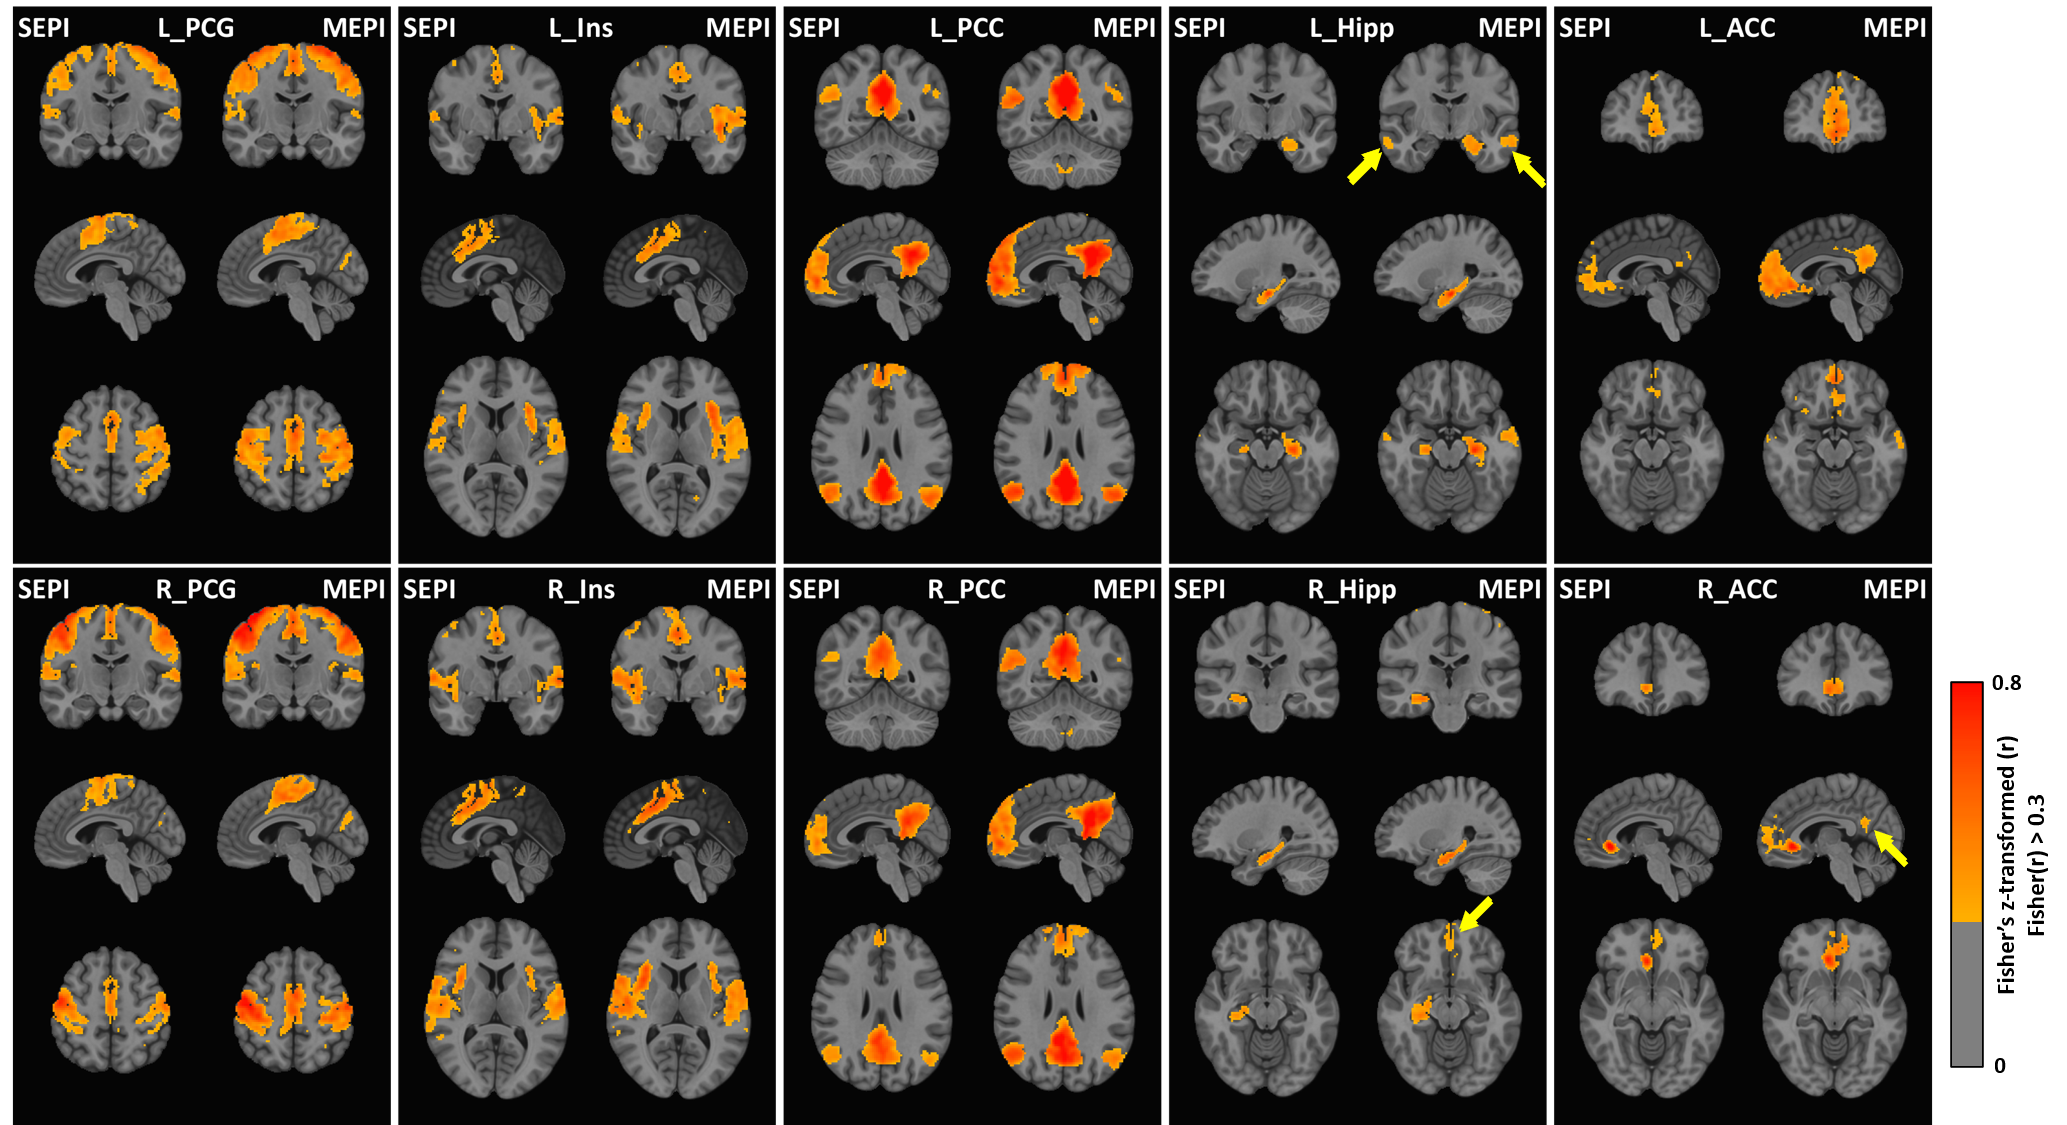
For seed-based FC analysis, Pearson correlation coefficient maps were calculated from 10 seed ROIs defined in AAL3v15,14. Group-level FC maps for SE and ME datasets were obtained through two-sample Student’s t-test with a covariate of global correlation and corrected by FDR algorithm (‘3dttest++’ and ‘3dFDR’ in AFNI)15. To investigate scan-time dependency, the datasets were truncated into shorter time frames ranging from 2- to 9-minute length at 1-minute increment and applied into the process described above.
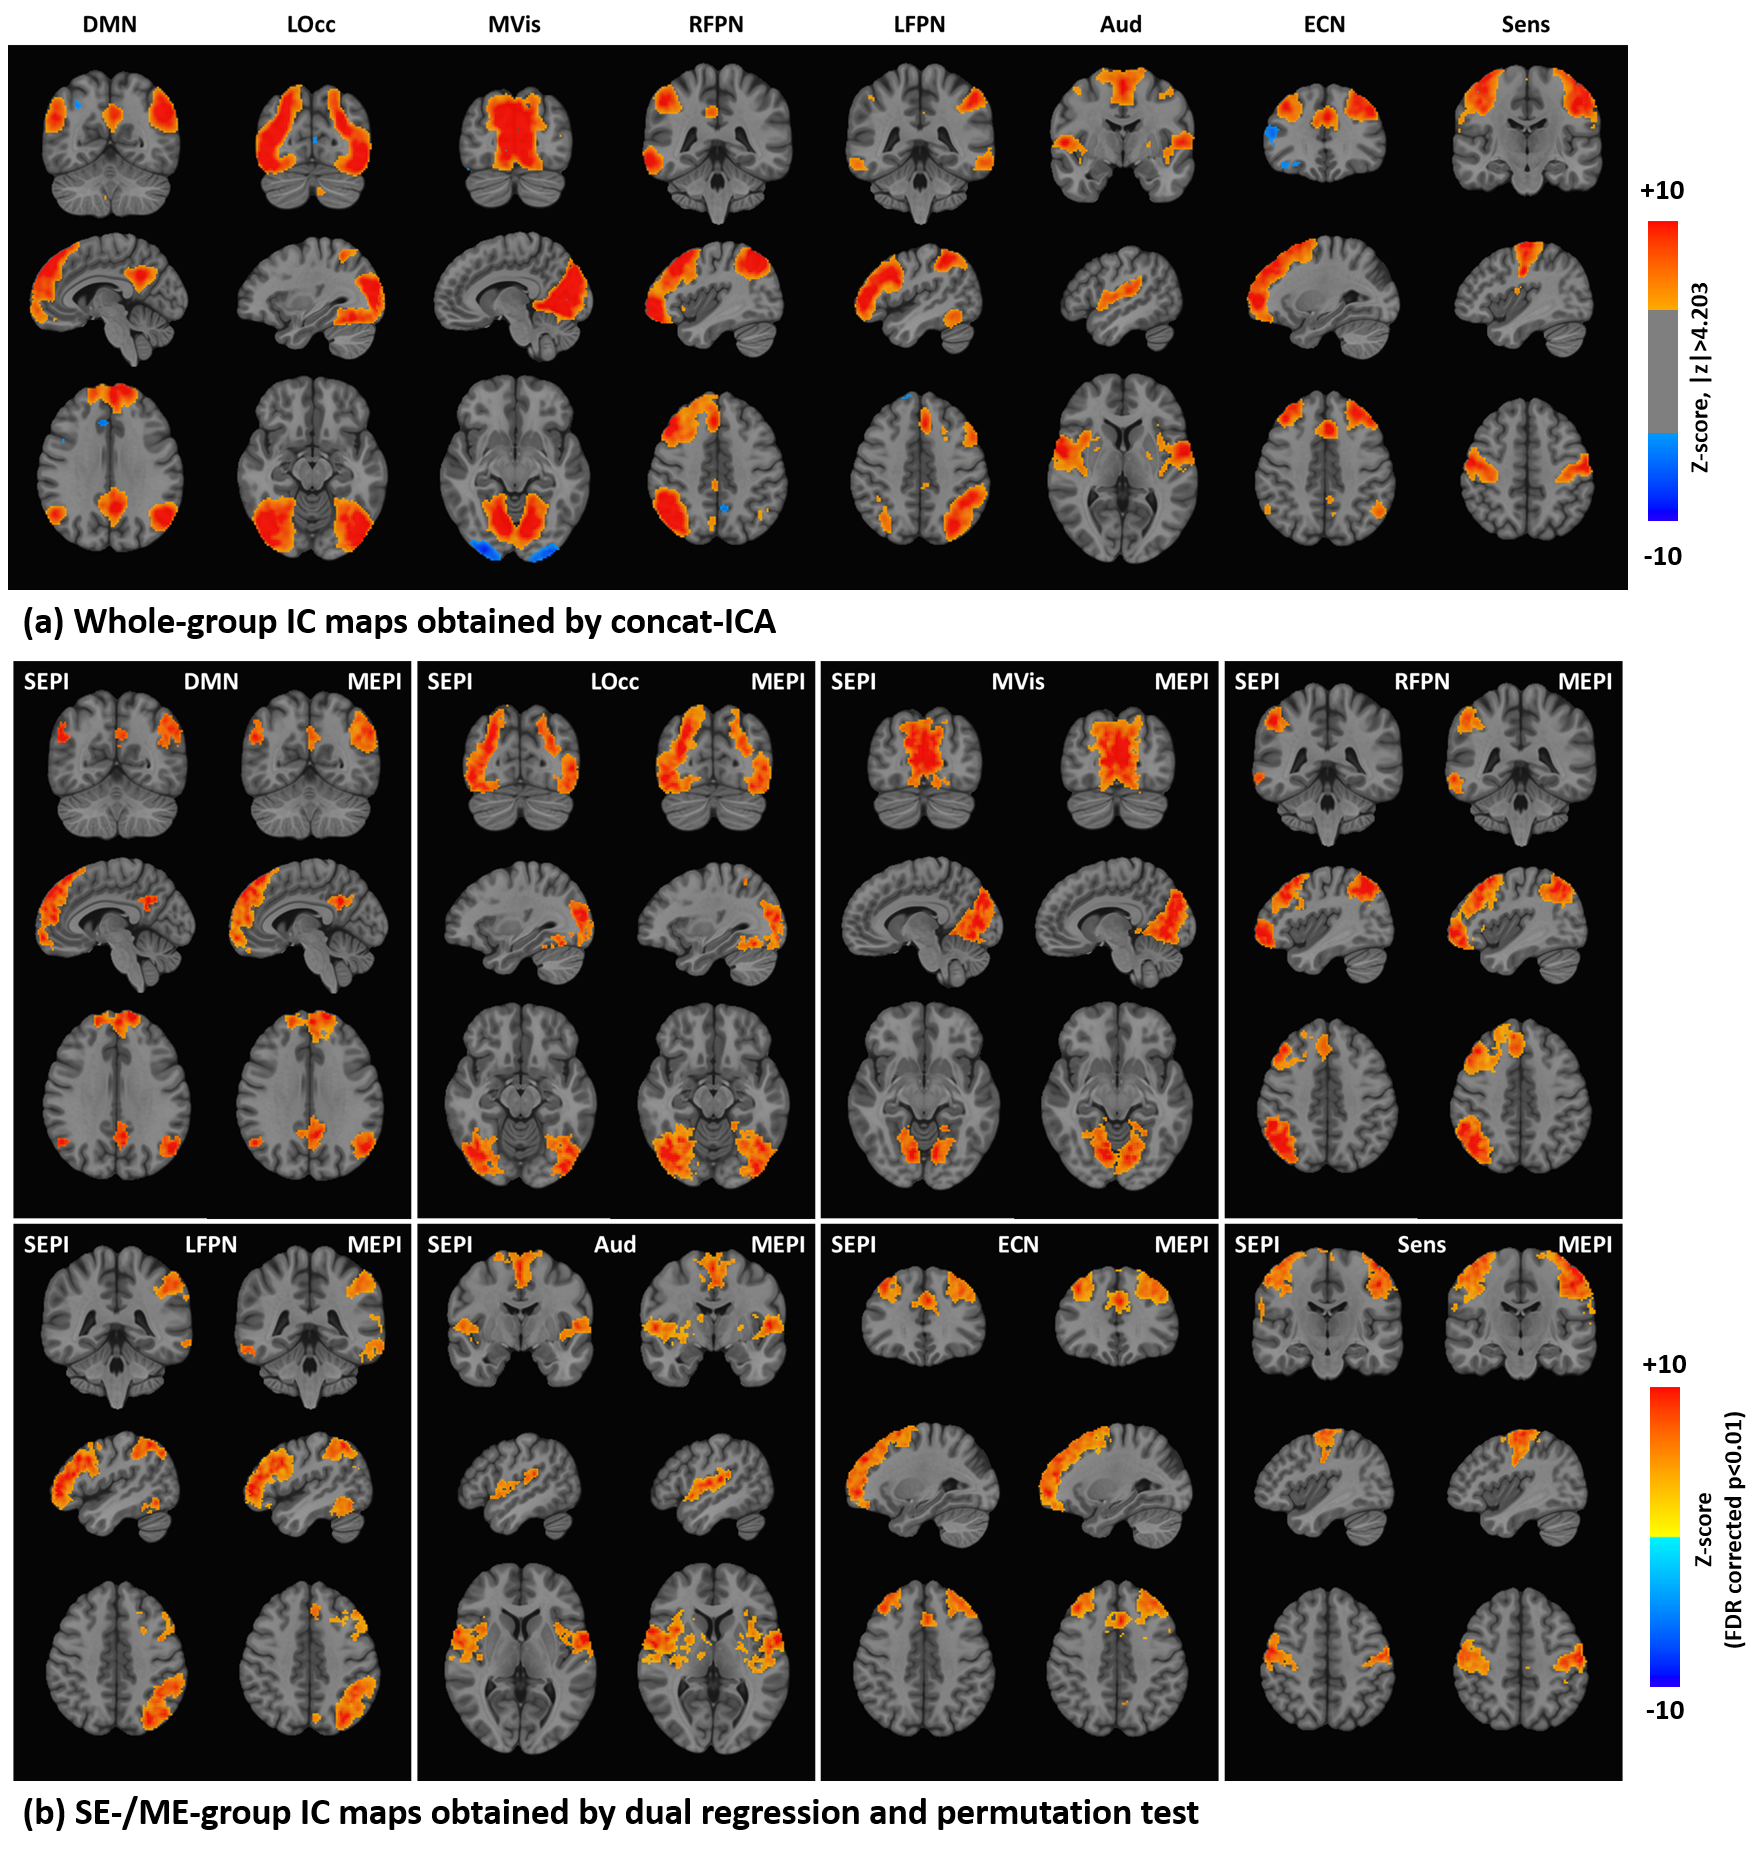
For ICA-based FC analysis16-19, FSL-based concat-ICA were applied to temporally-concatenated SE and ME datasets from all subjects to identify patterns of FC in the whole group (whole-group IC maps). Dual regression was used to calculate subject/scan-length-specific IC maps. Lastly, ‘randomise’ permutation tests were performed to get the inference on ME-group and SE-group IC maps with different time lengths. Whole-group IC map was used as the ground truth to assess corresponding SE/ME-group IC maps, in which the numbers of activated voxels were counted as true positives, true negative, false positive (FP), and false negative based on the whole-group IC map mask. Sensitivity, specificity, and accuracy for both SE-group and ME-group IC maps were calculated based on the four metrics.
Results
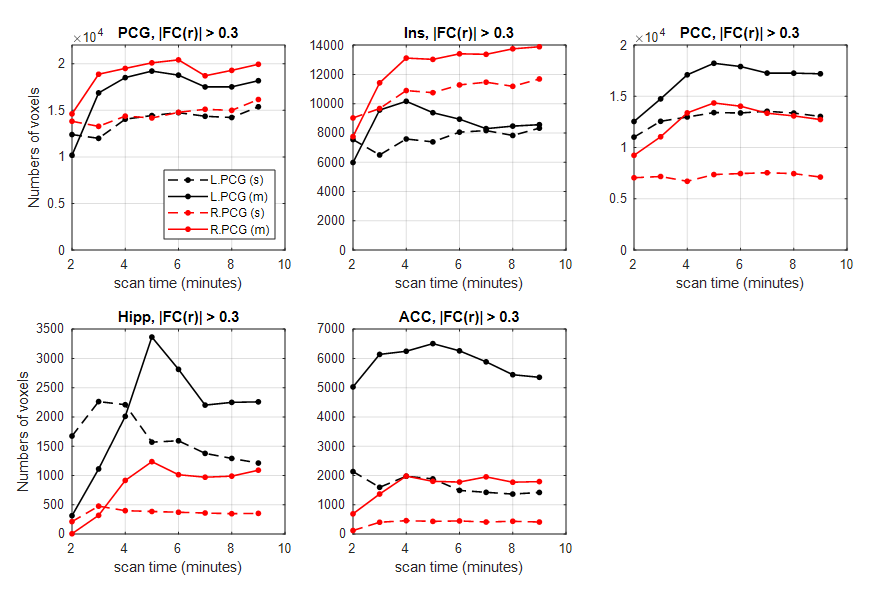
In seed-based FC comparison, differences between ME and SE FC maps were observed with a threshold of FDR-corrected p<0.001. Visually ME maps had higher magnitude and broader extent and detected more clusters functionally connected than SE-FC maps as indicated in Fig. 1. After a binary 0.3 magnitude threshold, more voxels survived in seed-based FC for ME than SE acquisitions regardless of scan lengths, as shown in Fig. 2.In Fig. 3(a), eight whole-group IC maps were manually chosen as they represent well-known intrinsic brain networks16. Fig. 3(b) showed examples of both SE- and ME-group IC maps derived from the 6-minute-length SE/ME datasets. Visually, ME-group IC maps showed broader and more intense FC than SE-group IC maps.
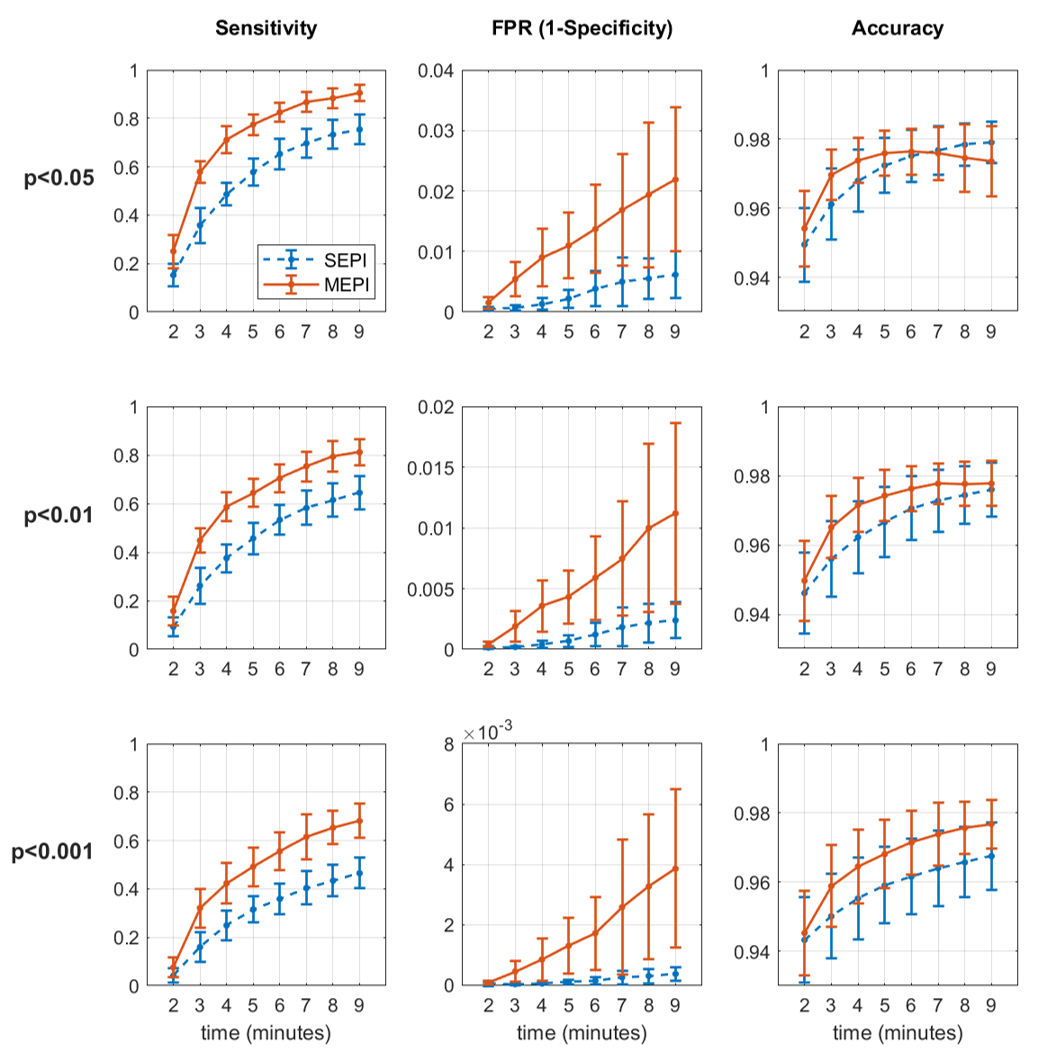
In Fig. 4, the calculated sensitivity, FP rate and accuracy across eight IC maps were plotted. ME-group ICs produced higher sensitivity and FP rate than SE-group ICs through all scan times and at all thresholds. With FDR-corrected p-values of 0.01 and 0.001, the accuracy in ME-group ICs was superior to those in SE-group ICs. Pertaining to performance at different scan durations, for example a 4-minute ME scan was comparable to an 8-minute SE scan in terms of sensitivity and accuracy with p-values of 0.01 and 0.001.
Discussion
In seed-based analysis, it was demonstrated that ME acquisitions detected more and stronger FC than the corresponding SE acquisitions with the same scan duration. For ICA-based FC analysis, ME-group generates superior IC maps in sensitivity and accuracy than SE-group with controlled FP rate. The improved fidelity of ME-fMRI acquisition can be attributed to T2*-weighted echo combination as a pre-processing step, which improves temporal SNR and better modeling of T2* decay for ME-EPI than SE-EPI. The higher sensitivity of ME fMRI can be used to shorten the scan time or to boost the reliability of resting state fMRI study. The high-performance gradients of the C3T are well-suited to ME-fMRI acquisitions.Conclusion
On a compact 3T scanner, the high-spatial-resolution multi-band ME-fMRI robustly produced higher sensitivity for both seed-based and ICA-based FC measurements than multi-band SE-fMRI with comparable TRs.Acknowledgements
This work was supported by NIH U01 EB024450 and NIH U01 EB026979.References
1. Foo, T.K.F., et al., Lightweight, compact, and high-performance 3T MR system for imaging the brain and extremities. Magn Reson Med, 2018. 80(5): p. 2232-2245.
2. Tan, E.T., et al., High slew-rate head-only gradient for improving distortion in echo planar imaging: Preliminary experience. J Magn Reson Imaging, 2016. 44(3): p. 653-64.
3. Kang, D., et al., The benefit of high-performance gradients on echo planar imaging for BOLD-based resting-state functional MRI. Phys Med Biol, 2020. 65(23): p. 235024.
4. Poser, B.a., et al., BOLD contrast sensitivity enhancement and artifact reduction with multiecho EPI: Parallel-acquired inhomogeneity-desensitized fMRI. Magnetic Resonance in Medicine, 2006. 55(6): p. 1227-1235.
5. Cohen, A.D., et al., Improved resting state functional connectivity sensitivity and reproducibility using a multiband multi-echo acquisition. Neuroimage, 2021. 225: p. 117461.
6. Speck, O. and J. Hennig, Functional imaging by I0- and T2*-parameter mapping using multi-image EPI. Magnetic resonance in medicine : official journal of the Society of Magnetic Resonance in Medicine / Society of Magnetic Resonance in Medicine, 1998. 40(2): p. 243-8.
7. Kundu, P., et al., Differentiating BOLD and non-BOLD signals in fMRI time series using multi-echo EPI. NeuroImage, 2012. 60(3): p. 1759-1770.
8. Kang, D., et al. Feasibility of high spatial and temporal resolution multi-echo multi-band whole brain resting-state functional MRI on a compact 3T system. in Proc. Intl. Soc. Mag. Reson. Med. 2020.
9. Cox, R.W., AFNI: software for analysis and visualization of functional magnetic resonance neuroimages. Comput Biomed Res, 1996. 29(3): p. 162-73.
10. Reuter, M., et al., Within-subject template estimation for unbiased longitudinal image analysis. Neuroimage, 2012. 61(4): p. 1402-18.
11. Glover, G.H., T.Q. Li, and D. Ress, Image-based method for retrospective correction of physiological motion effects in fMRI: RETROICOR. Magnetic Resonance in Medicine, 2000. 44(1): p. 162-167.
12. Jo, H.J., et al., Mapping sources of correlation in resting state FMRI, with artifact detection and removal. Neuroimage, 2010. 52(2): p. 571-82.
13. Destrieux, C., et al., Automatic parcellation of human cortical gyri and sulci using standard anatomical nomenclature. Neuroimage, 2010. 53(1): p. 1-15.
14. Rolls, E.T., et al., Automated anatomical labelling atlas 3. Neuroimage, 2020. 206: p. 116189.
15. Saad, Z.S., et al., Correcting brain-wide correlation differences in resting-state FMRI. Brain Connect, 2013. 3(4): p. 339-52.
16. Beckmann, C.F., et al., Investigations into resting-state connectivity using independent component analysis. Philosophical Transactions of the Royal Society B: Biological Sciences, 2005. 360(1457): p. 1001-1013.
17. Nickerson, L.D., et al., Using Dual Regression to Investigate Network Shape and Amplitude in Functional Connectivity Analyses. Front Neurosci, 2017. 11: p. 115.
18. Jenkinson, M., et al., Fsl. Neuroimage, 2012. 62(2): p. 782-90.
19. Beckmann, C.F., et al., Group comparison of resting-state FMRI data using multi-subject ICA and dual regression. Neuroimage, 2009. 47(Suppl 1): p. S148.
Figures