3323
Detecting longitudinal dynamic functional connectivity changes using multiband multi-echo fMRI in high school football athletes1Radiology, Medical College of Wisconsin, Milwaukee, WI, United States, 2Neurosurgery, Medical College of Wisconsin, Milwaukee, WI, United States, 3Neurology, Medical College of Wisconsin, Milwaukee, WI, United States
Synopsis
Repetitive head impact exposure (RHIE) during contact sports may have damaging neurocognitive effects. In this study, we investigated longitudinal changes in dynamic functional connectivity (dFNC) using multiband multi-echo (MBME) fMRI in high school football players over the course of two seasons. Four recurring connectivity states were identified. A greater total number of dFNC changes were observed over two seasons compared to over the course of one season. Changes across all four states were only observed in the two-season comparison. These preliminary results suggest that RHIE may lead to accumulated effects in functional connectivity patterns.
Introduction
A growing body of evidence suggests that repetitive head impact exposure (RHIE) during contact sports (CS) may have damaging neurocognitive effects1,2. Research on the effects of RHIE is limited, and the mechanisms by which RHIE lead to brain injury remain unknown. Resting-state fMRI has been used to investigate brain networks in relation to RHIE in CS athletes3,4. These approaches rely on the assumption that functional connectivity is static over the entire scan period; however, recent work has demonstrated that connectivity fluctuates over time5-7. Here, we investigated longitudinal changes in dynamic functional connectivity (dFNC) in non-concussed high school football players using an advanced multiband, multi-echo (MBME) MRI sequence to improve BOLD sensitivity and reliability.Methods
Twenty-one male non-concussed United States high school football players were followed for two football seasons and underwent MRI scans before and after each season. Nineteen subjects completed a follow-up scan at postseason of Year 1. Thirteen subjects returned for a preseason scan before Year 2, and 10 of them completed the postseason follow-up scan after Year 2.Imaging was performed on a 3T GE scanner. A T1-weighted MPRAGE anatomical image was acquired. This was followed by a gradient echo MBME resting state fMRI scan with the following parameters: TR/TE=900/11,30,49ms, FOV=24cm, matrix=80x80, slice thickness=3mm, 11 slices with multiband factor=4 (44 total slices), FA=60°, and partial Fourier factor=0.85, in-plane acceleration (R)=2. Resting state scans lasted 7:28. During the resting state scans, subjects were instructed to close their eyes, but remain awake.
Data was analyzed using a combination of AFNI and FSL. First, the anatomical MPRAGE image was coregistered to Montreal Neurological Institute (MNI) space. Then, the first-echo functional data was volume registered to the first volume. Subsequent echoes were registered using the transformation matrices from the first echo. Image distortion was corrected using topup. The three echoes were then combined using the T2*-weighted approach8 and denoised using multi-echo independent component analysis (ME-ICA)9-11. This technique classifies independent components as BOLD or non-BOLD based on whether their amplitudes are linearly dependent on TE9,10,12. Non-BOLD components were regressed out of the combined ME data resulting in a denoised dataset. The denoised MBME dataset was then registered to the MPRAGE image and registered to MNI space using the anatomical transformations computed above. Finally, the data was smoothed with a 4mm FWHM Gaussian kernel and bandpass filtered with 0.01<f<0.15Hz.
The preprocessed functional data from the CS subjects underwent group-level spatial independent component analysis (ICA) using the GIFT toolbox13 to decompose data into 100 intrinsic connectivity networks (ICNs)7,14. Components associated with cerebrospinal fluid, white matter, or movement artifacts were ignored. The resulting 69 components were organized into ten intrinsic connectivity networks (ICNs) including attention (AT), default mode (DM), parietal (PAR), subcortical (SC), temporal (TM), cerebellar (CB), frontal (FT), salience (SAL), somatomotor (SM), and visual (VIS).
dFNC was computed using a sliding-window approach and a sliding window length of 24 TRs. To estimate recurring dFNC states, a k-means clustering analysis was performed using the elbow criterion to determine the optimal number of clusters k14. Windowed dFNC matrices across all runs were classified into states. The state vector for each run represented the assignment of a windowed matrix to one of k connectivity states. For every subject, cluster centroids were obtained by averaging dFNC matrices belonging to the same state. The resulting centroids were used for comparison between timepoints in a within-subjects analysis. Based on the state vector, dFNC metrics were calculated including state occupancy rate (the number of windows in a state divided by total number of windows) and mean dwell time (the average number of consecutive windows belonging to a state). Longitudinal comparisons of dFNC strengths were assessed using paired t-tests.
Results
Four recurring connectivity states were identified (Figure 1). State 4 had the highest occurrence rate (42%) while State 2 occurred least often (12%) but displayed the highest inter- and intra-network connectivity across all domains. Figure 2 shows the comparison of pre- and postseason differences in dFNC over one and two seasons. At an uncorrected threshold of p < 0.001, a greater total number of dFNC changes were observed over two seasons (postseason, Year 2 versus preseason, Year 1). Changes across all four states were only observed in the two-season comparison. No t-test survived correction for false discovery rate, most likely due to the relatively small sample size.Discussion/Conclusions
The finding that the largest number of total dFNC changes occurred in the two-season comparison relative to individual one-season comparisons suggests that RHIE may lead to accumulated effects in dynamic functional connectivity patterns. There was also evidence to support a shift from temporary dFNC alterations in primary functional networks, such as visual and sensorimotor networks, to more persistent changes in higher-order cognitive networks including attention, memory, and executive control. Dynamic connectivity changes were also seen in the default mode and salience networks, which have been previously implicated in mechanisms of concussion. Although preliminary, our results suggest a longitudinal profile of network changes that may point towards a sequence of consistent pathological processes following RHIE during CS.Acknowledgements
No acknowledgement found.References
1. McKee AC, Cantu RC, Nowinski CJ, et al. Chronic traumatic encephalopathy in athletes: progressive tauopathy after repetitive head injury. Journal of neuropathology and experimental neurology. Jul 2009;68(7):709-35. doi:10.1097/NEN.0b013e3181a9d503
2. Stern RA, Riley DO, Daneshvar DH, Nowinski CJ, Cantu RC, McKee AC. Long-term consequences of repetitive brain trauma: chronic traumatic encephalopathy. PM & R : the journal of injury, function, and rehabilitation. Oct 2011;3(10 Suppl 2):S460-7. doi:10.1016/j.pmrj.2011.08.008
3. Abbas K, Shenk TE, Poole VN, et al. Alteration of default mode network in high school football athletes due to repetitive subconcussive mild traumatic brain injury: a resting-state functional magnetic resonance imaging study. Brain connectivity. Mar 2015;5(2):91-101. doi:10.1089/brain.2014.0279
4. DeSimone JC, Davenport EM, Urban J, et al. Mapping default mode connectivity alterations following a single season of subconcussive impact exposure in youth football. Human brain mapping. Jun 1 2021;42(8):2529-2545. doi:10.1002/hbm.25384
5. Chang C, Glover GH. Time–frequency dynamics of resting-state brain connectivity measured with fMRI. Neuroimage. 2010;50(1):81-98.
6. Sakoğlu Ü, Pearlson GD, Kiehl KA, Wang YM, Michael AM, Calhoun VD. A method for evaluating dynamic functional network connectivity and task-modulation: application to schizophrenia. Magnetic Resonance Materials in Physics, Biology and Medicine. 2010;23(5-6):351-366.
7. Allen EA, Damaraju E, Plis SM, Erhardt EB, Eichele T, Calhoun VD. Tracking whole-brain connectivity dynamics in the resting state. Cerebral cortex. 2014;24(3):663-676.
8. Posse S, Wiese S, Gembris D, et al. Enhancement of BOLD-contrast sensitivity by single-shot multi-echo functional MR imaging. Magn Reson Med. Jul 1999;42(1):87-97. doi:10.1002/(sici)1522-2594(199907)42:1<87::aid-mrm13>3.0.co;2-o
9. Kundu P, Brenowitz ND, Voon V, et al. Integrated strategy for improving functional connectivity mapping using multiecho fMRI. Proceedings of the National Academy of Sciences. Oct 1 2013;110(40):16187-16192. doi:10.1073/pnas.1301725110
10. Kundu P, Inati SJ, Evans JW, Luh WM, Bandettini PA. Differentiating BOLD and non-BOLD signals in fMRI time series using multi-echo EPI. Neuroimage. Apr 15 2012;60(3):1759-70. doi:10.1016/j.neuroimage.2011.12.028
11. DuPre E, Salo T, Markello R, Kundu P, Whitaker K, Handwerker D. ME-ICA/tedana: 0.0.6: https://doi.org/10.5281/zenodo.2558498. https://doi.org/10.5281/zenodo.2558498
12. Olafsson V, Kundu P, Wong EC, Bandettini PA, Liu TT. Enhanced identification of BOLD-like components with multi-echo simultaneous multi-slice (MESMS) fMRI and multi-echo ICA. Neuroimage. May 15 2015;112:43-51. doi:10.1016/j.neuroimage.2015.02.052
13. Calhoun VD, Adali T, Pearlson GD, Pekar JJ. A method for making group inferences from functional MRI data using independent component analysis. Human brain mapping. Nov 2001;14(3):140-51. doi:10.1002/hbm.1048
14. Damaraju E, Allen EA, Belger A, et al. Dynamic functional connectivity analysis reveals transient states of dysconnectivity in schizophrenia. NeuroImage: Clinical. 2014;5:298-308.
Figures
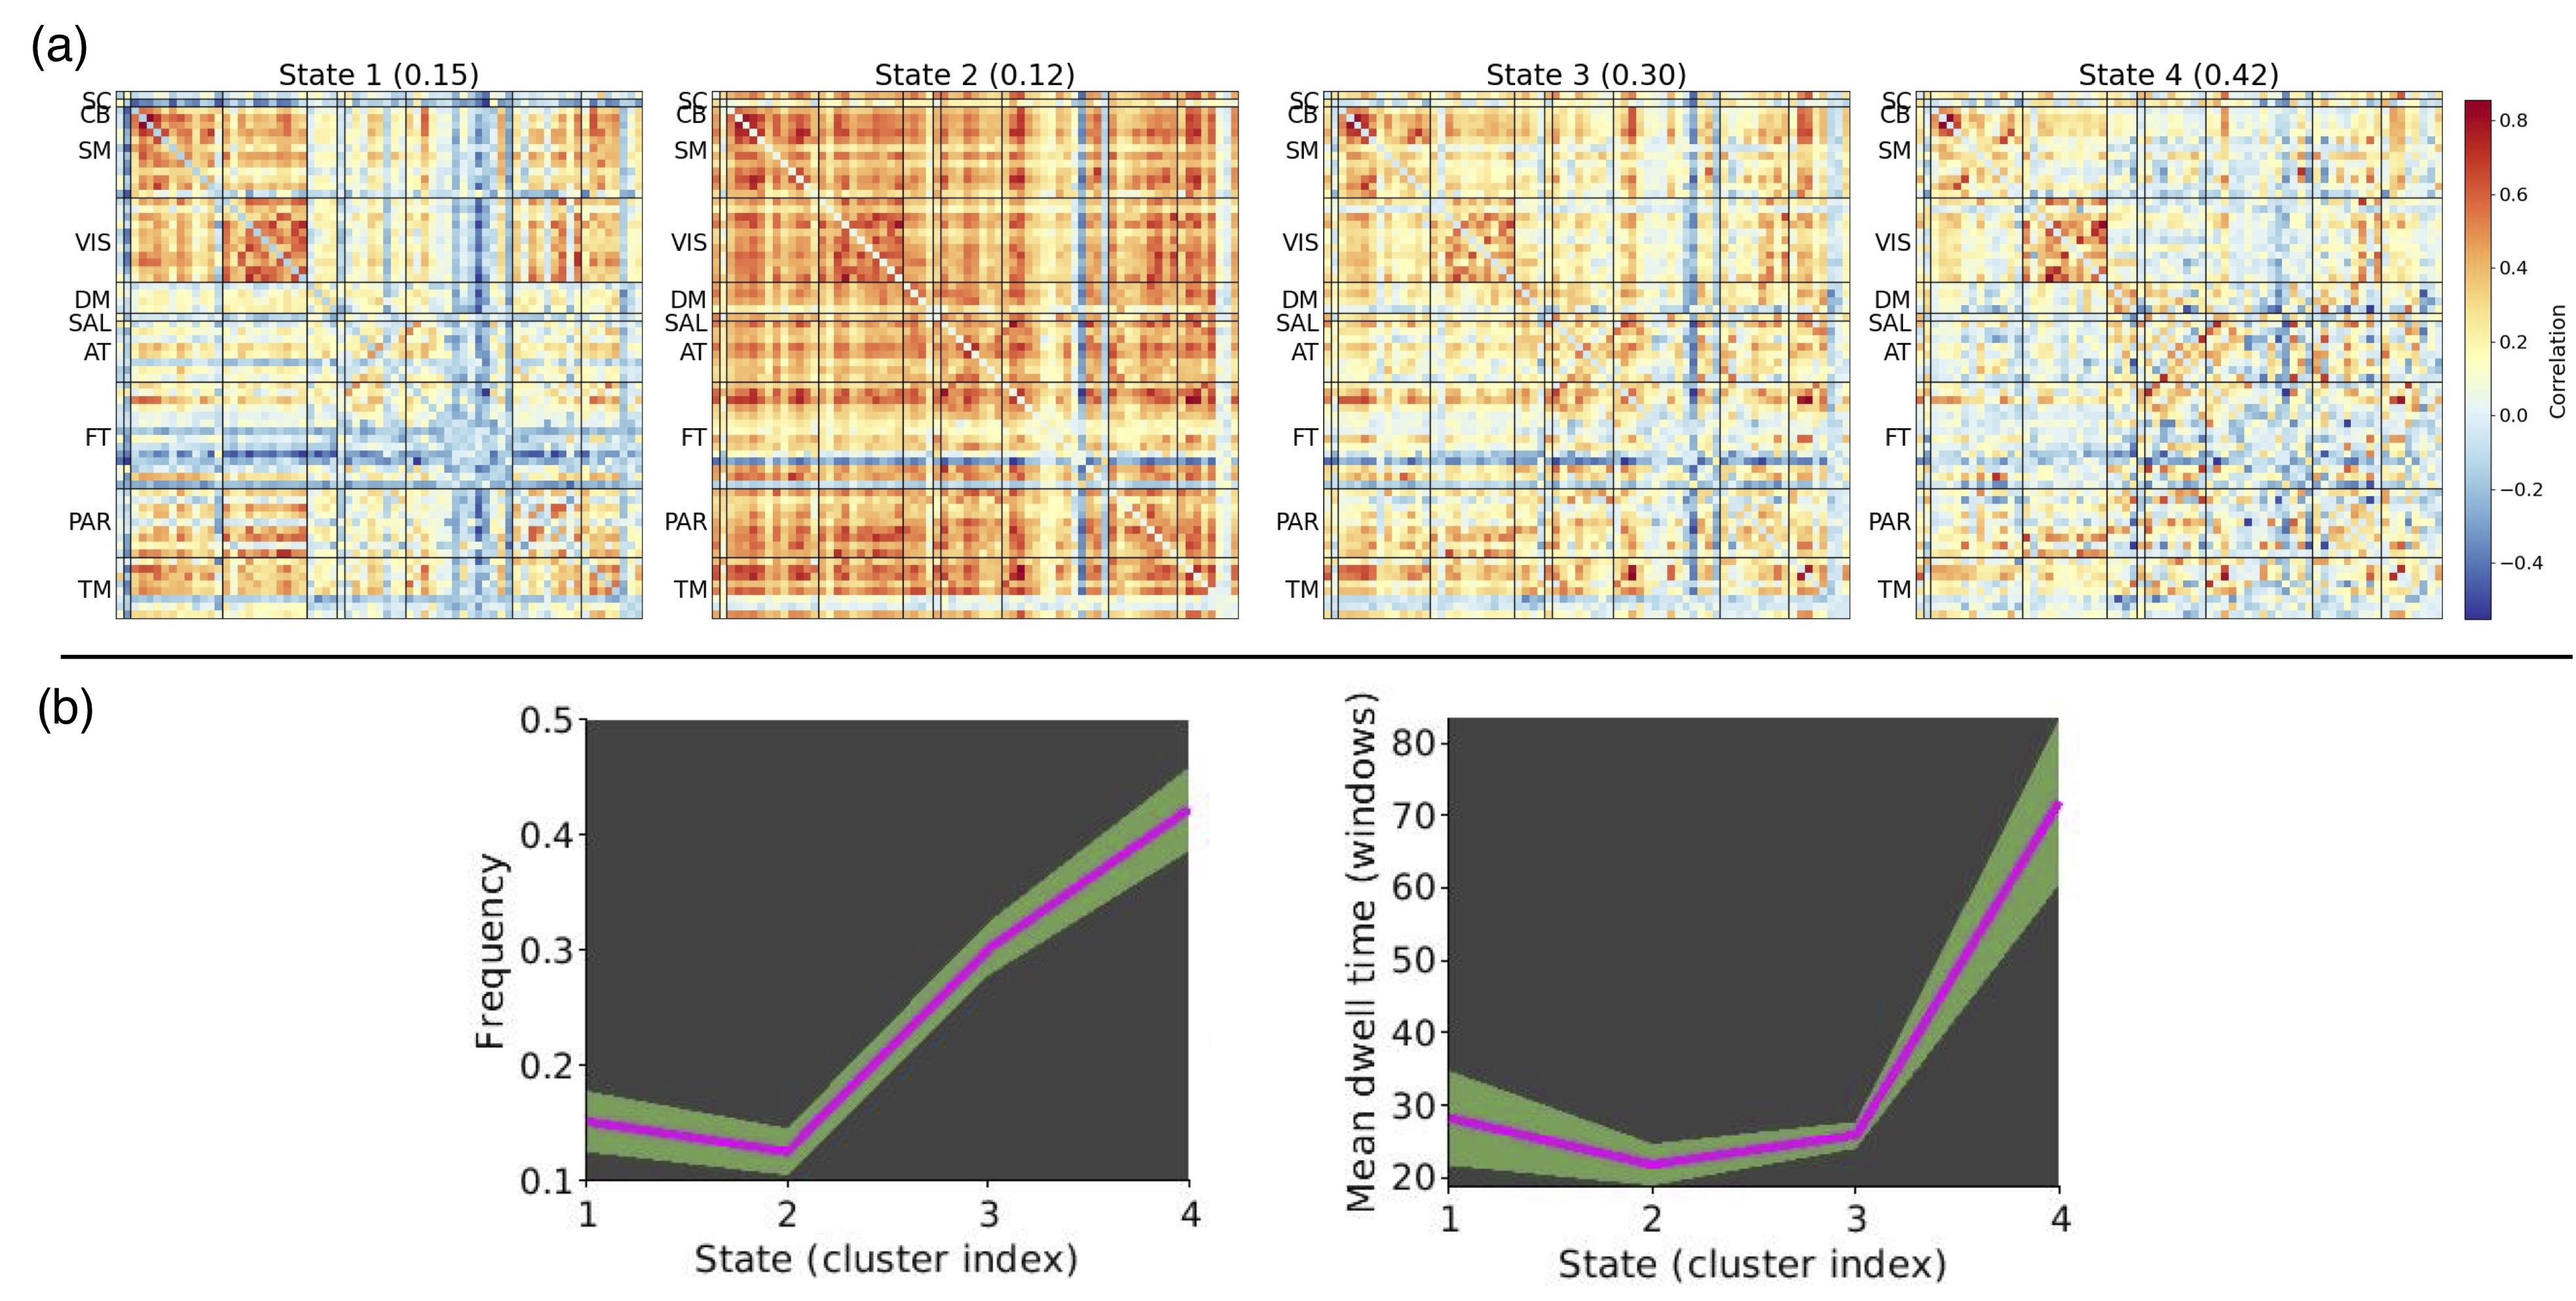
Figure 1. Dynamic functional network connectivity (dFNC) analysis.
(a) Centroids and percentage of occurrence for each dFNC state identified using k-means clustering for all data across time points. (b) Mean dwell time and frequency of each state. Abbreviations: SC = Subcortical, CB = Cerebellum, SM = Somatomotor, VIS = Visual, DM = Default Mode, SAL = Salience, AT = Attention, FT = Frontal, PAR = Parietal, TM = Temporal.
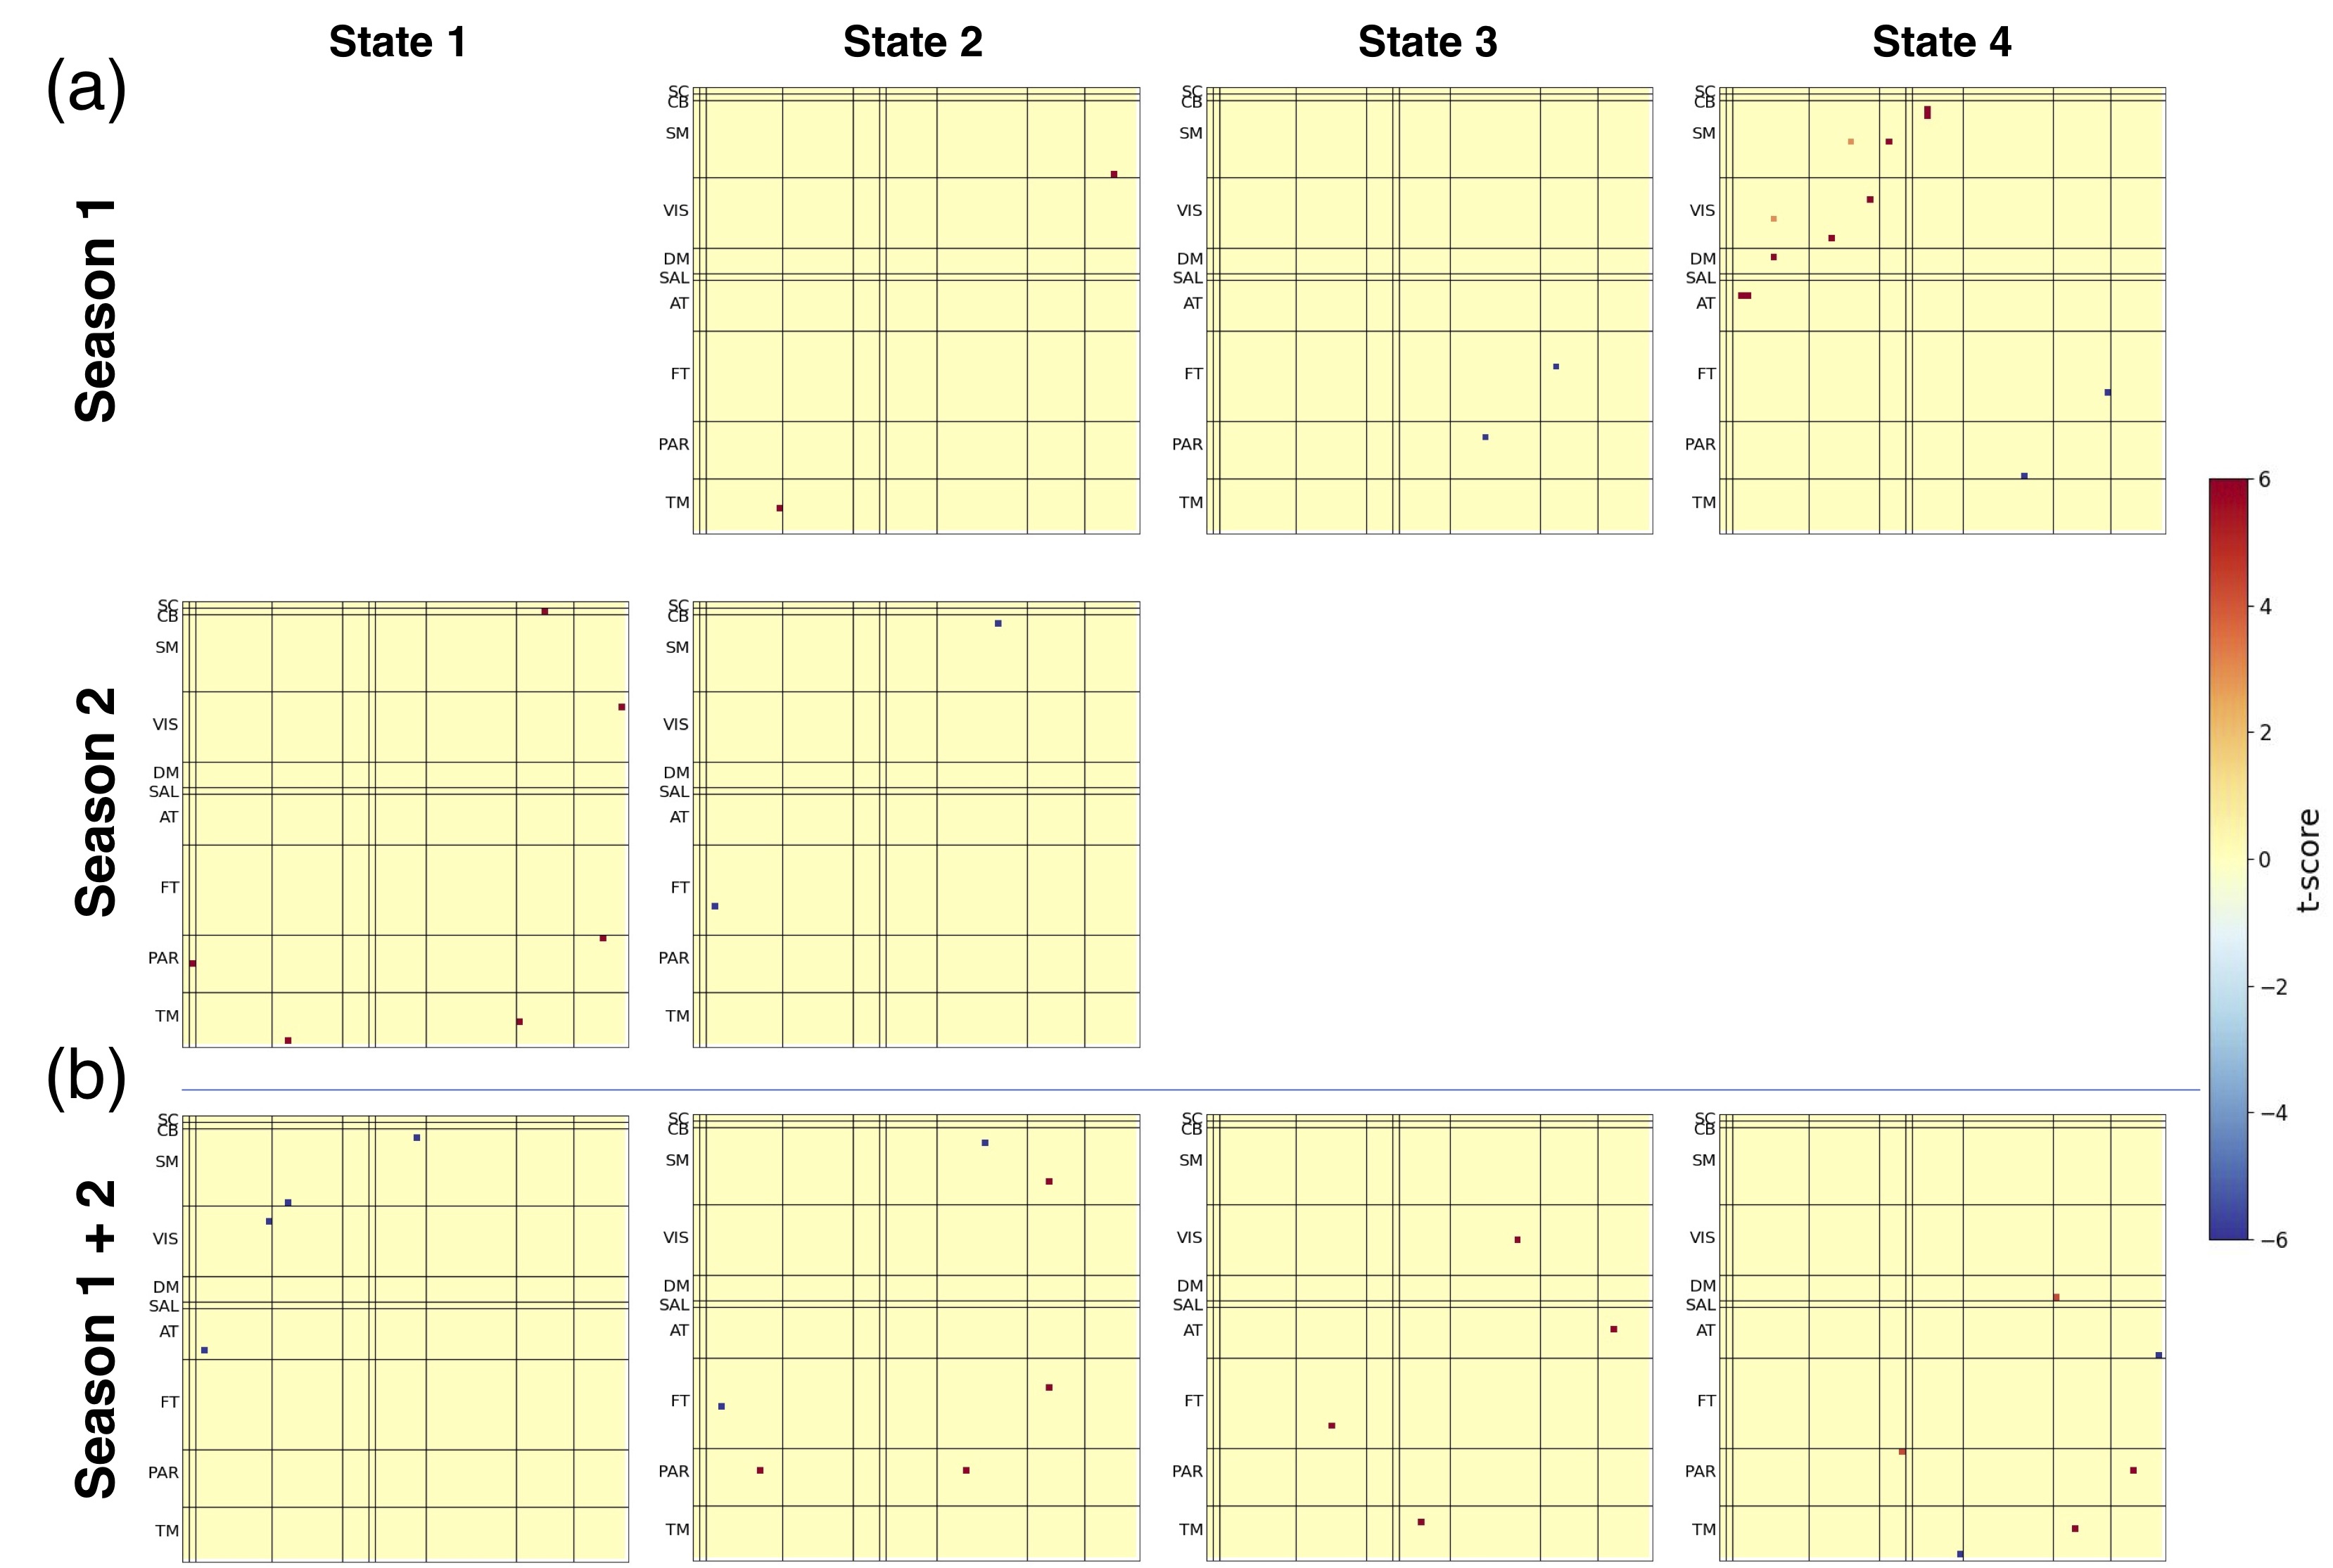
Figure 2. Comparison of average dFNC connectivity strength between one- and two-season intervals.
(a ) One-season comparisons (pre- and postseason 1, pre- and postseason 2)
(b) Two-season comparison (preseason 1 and postseason 2). Results are from a paired t-test with thresholds set at an uncorrected p < 0.001. Abbreviations: SC = Subcortical, CB = Cerebellum, SM = Somatomotor, VIS = Visual, DM = Default Mode, SAL = Salience, AT = Attention, FT = Frontal, PAR = Parietal, TM = Temporal.