3321
Functional and structural connectomes of subthalamic nucleus subregions in living humans using 7 Tesla MRI1Brainstem Imaging Laboratory, Department of Radiology, Athinoula A. Martinos Center for Biomedical Imaging, Massachusetts General Hospital, Boston, MA, United States, 2Escuela Nacional de Estudios Superiores, Juriquilla, Universidad Nacional Autónoma de México, Querétaro, Mexico, 3Sant'Anna School of Advanced Studies, Institute of Life Sciences, Pisa, Italy, 4Research Center E. Piaggi, University of Pisa, Pisa, Italy
Synopsis
The subthalamic nucleus (STh) plays a crucial role in the basal ganglia movement-related circuit and it is involved in movement disorders such as Parkinson’s disease, dystonia, and chorea, among others. Its study in living humans is challenging due to limited resolution and contrast in conventional MRI. Previous work developed an in-vivo atlas of two STh subregions based on their fractional anisotropy properties. With the goal of characterizing their function and connectivity, in the present study, we evaluated the functional and structural connectivity of these STh subregions using 7 Tesla MRI and tested their preferential connectivity towards associative or motor regions.
Introduction
The subthalamic nucleus (STh) is part of the basal ganglia motor circuit1. Based on invasive tracer studies in non-human primates, STh connects not only with motor cortex, but also with associative and limbic cortices2. A comprehensive functional and structural connectivity map of this nucleus and its subregions in humans is crucial for understanding movement disorders. Indeed, neurosurgery and deep-brain-stimulation of advanced Parkinson’s disease target the motor part of STh, yet aim at minimizing associative and limbic side-effects. Recently, an in-vivo human atlas of two STh subregions was developed based on their fractional anisotropy profile3.Prupose
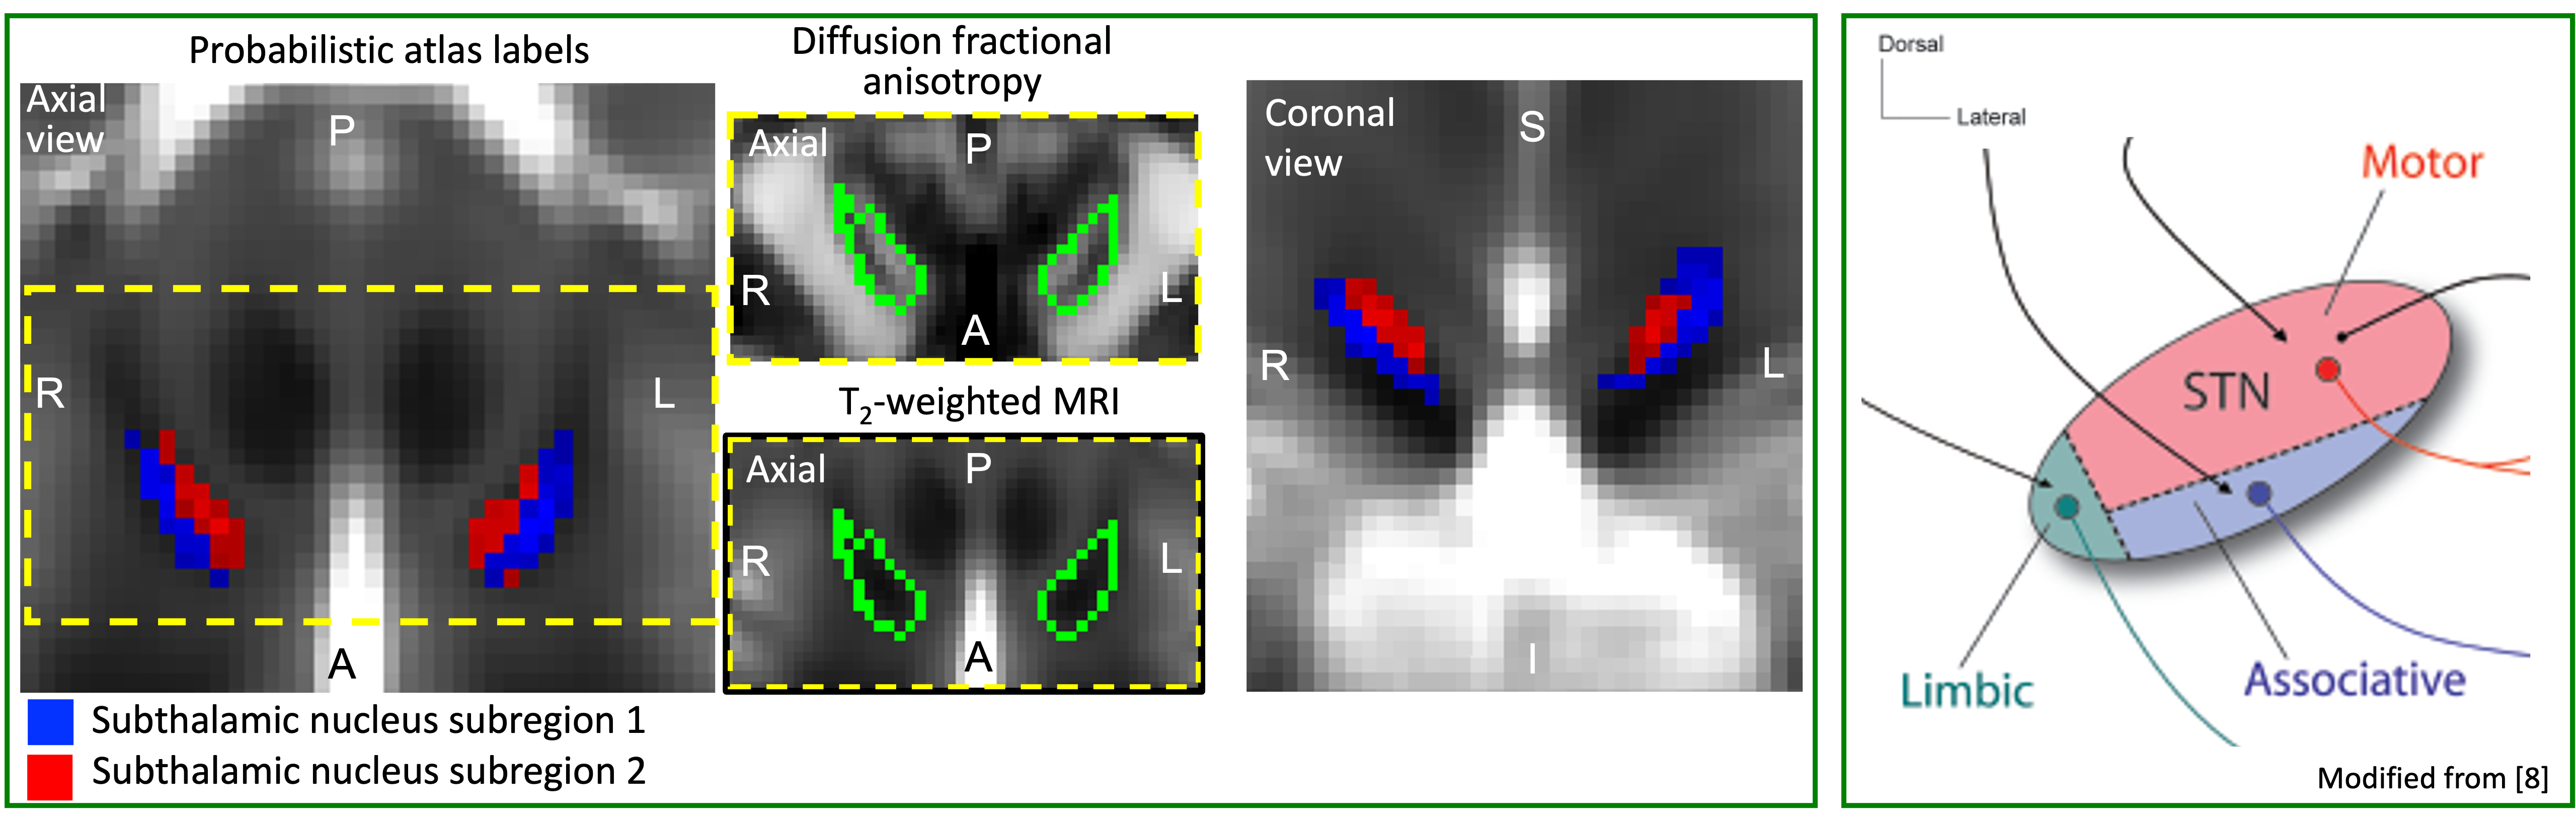
To apply our recently developed in-vivo brainstem and diencephalic nuclei atlas3–7 to high spatial resolution fMRI and HARDI at 7 Tesla, and verify in humans the connectivity of two STh subregions to motor/associative/limbic cortical and subcortical areas, including the brainstem. Further, according to their location (Figure 1) and previous literature8, we tested the hypothesis that inferior-anterior STh subregion 1 has stronger connectivity with associative areas, and superior-posterior STh subregion 2 with motor cortices.Methods
Twenty healthy volunteers (10m/10f; age:29.5±1.1years), underwent 7 Tesla and 3 Tesla MRI under IRB approval.7 Tesla MRI: fMRI data acquisition: three resting-state (eyes-closed) fMRI runs were acquired with parameters: gradient-echo EPI, isotropic voxel-size/matrix-size/GRAPPA-factor/nominal echo-spacing/bandwidth/N. slices/slice orientation/slice-acquisition order/echo-time (TE)/repetition-time (TR)/flip-angle/simultaneous-multi-slice factor/N. repetitions/phase-encoding direction/acquisition-time per-run=1.1mm/180x240/3/0.82ms/“1488Hz/Px”/123/sagittal/interleaved/32ms/2.5s/75°/3/210/anterior-posterior/10’07”. Fieldmap: isotropic voxel-size/matrix-size/bandwidth/N. slices/slice orientation/slice-acquisition order/TE1/TE2/TR/FA/simultaneous-multi-slice factor/phase-encodingdirection=2.0mm/116x132/1515“Hz/pixel”/80/sagittal/interleaved/3.00ms/4.02ms/570.0ms/36°/3/anterior-posterior. HARDI data acquisition: single-shot 2D spin-echo-EPI (using a prototype sequence which supports unipolar diffusion-encoding) with parameters n. slices/TE/TR/phase-encoding direction/bandwidth/partial-Fourier/n. diffusion-directions/b-value/ acquisition-time: 82 /66.8ms/7.4s/“anterior/posterior”/1456“Hz/pixel”/“6/8”/60/2500“s/mm2”, seven interspersed “b0” images (T2-weighted, non-diffusion-weighted, b-value=0s/mm2), 8′53′′. To perform distortion-correction we acquired seven “b0” images with opposite phase-encoding direction.
3 Tesla MRI: T1-weighted MEMPRAGE: isotropic voxel-size/TR/TEs/inversion-time/flip-angle/FOV/bandwidth/GRAPPA-factor/slice orientation/slice-acquisition order/acquisition time=1mm/2.53s/1.69,3.5,5.3,7.2ms/1.5s/7°/256x256x176mm3/650“Hz/pixel”/3/sagittal/anterior-posterior/4′28”.
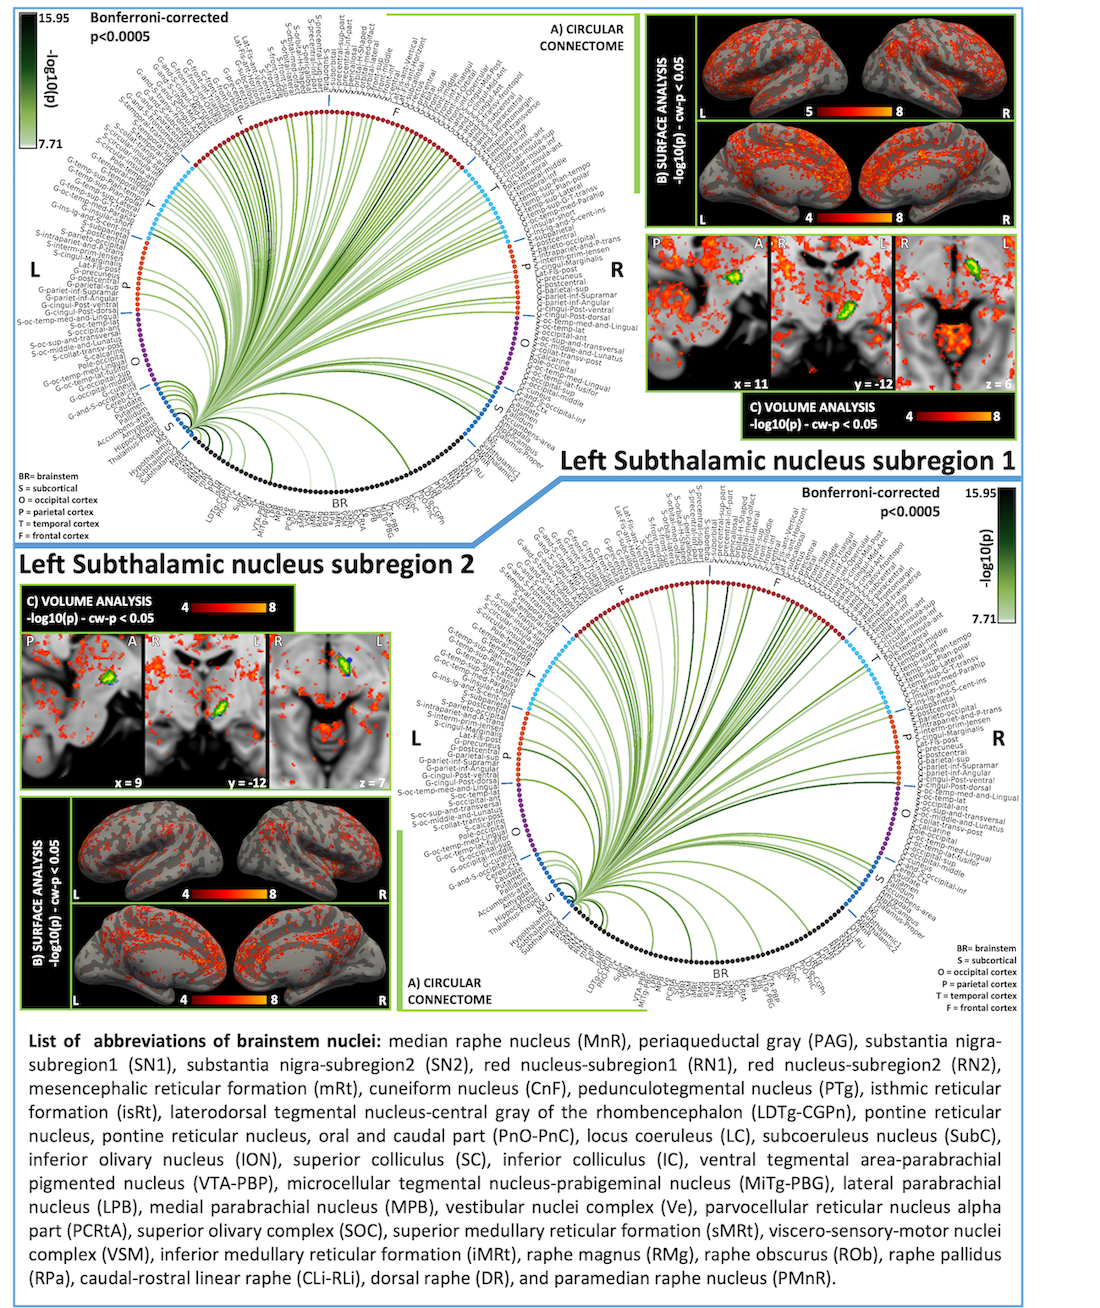
fMRI data analysis: To remove physiological noise we applied RETROICOR.9 Images were slice-timing corrected, reoriented to “RPI” orientation, and cropped. Then, we computed the transformations to correct for geometric distortions (using the fieldmap) and rigid-body motion. For coregistration of fMRIs to the MEMPRAGE, the bias-field-corrected time-averaged fMRI of the first run was used to compute an affine transformation and a nonlinear warp. After concatenating and applying transformations relative to distortion-, motion-correction and coregistration to the MEMPRAGE, we regressed out nuisance signal-fluctuations due to motion, cardiac rate, respiratory-volume-per-unit-time, and pulsatility in the cerebrospinal fluid neighboring the brainstem. We scaled the signal to percent signal change, removed the temporal mean, and performed band-pass filtering (cut-off:0.01-0.1 Hz). Finally, we concatenated the runs and applied the MEMPRAGE-to-MNI transformations. As seeds, we used the probabilistic atlas labels of bilateral STh subregions 1 and 2 thresholded at 35%3. As targets, we used 231 cortical and subcortical masks (Freesurfer parcellations10, probabilistic brainstem atlas labels3–7). For the region-based connectivity analysis, at the subject level, the Pearson’s correlation coefficient was computed between average time-courses extracted from seeds and targets. At the group level, we performed a one-sample t-test on the Fisher-transformed correlation coefficients and defined ‘links’ significant connections (p < 0.0005 Bonferroni corrected).
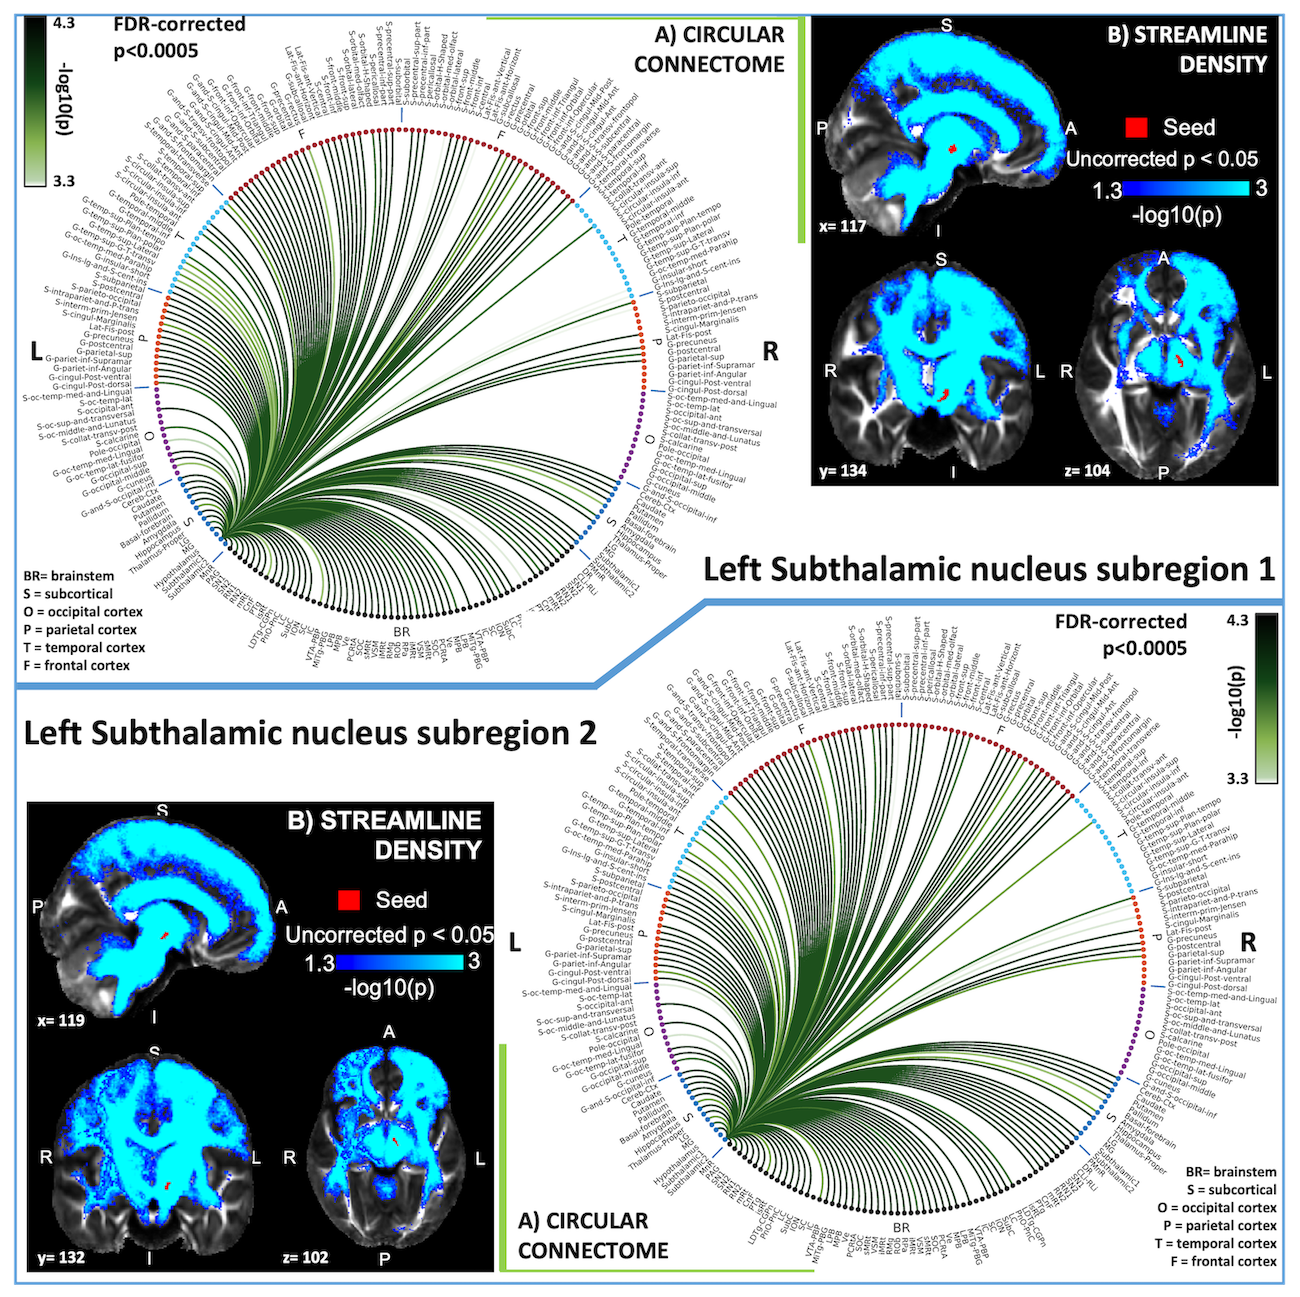
HARDI data analysis: HARDIs were de-noised11, motion and distortion-corrected (FSL, topup/eddy). To map the Freesurfer parcellation to native HARDI-space, we computed an affine boundary-based transformation (FSL, FLIRT-BBR) between the preprocessed MEMPRAGE and single-subject S0. To map the brainstem nuclei atlas to native HARDI-space, we computed the bivariate diffeomorphic transformations (ANTs) between IIT-MNI FA/S0 templates12 and single-subject FA/S0 images using an intermediate group-based bivariate optimal-template. One subject was excluded due to poor data-quality. Seeds and targets were defined as explained above. We performed probabilistic tractography using MRtrix3-iFOD2 algorithm (90-degree maximum angle between successive steps, 0.07 cut-off, 1-mm minimum streamline-length). We propagated 100,000 streamlines from each seed-mask and computed a “structural-connectivity-index” (range:[0 1]) for each pair of seed-target masks (=fraction of streamlines propagated from the seed reaching the target mask). Wilcoxon test was performed on the connectivity-index values, false-discovery-rate (FDR) was used to correct for multiple comparisons and significant values were displayed with a 2D-circular diagram13.
T1-weighted MEMPRAGE data analysis: We computed the root-mean-square MEMPRAGE across echo-times, rotated it to standard “RPI” orientation, performed bias-field correction (SPM) and cropping. Then, we computed (ANTs) a group-average MEMPRAGE template as an intermediate step to coregister single-subject MEMPRAGEs to Montreal-Neurological-Institute (MNI) space. The pre-processed T1-weighted images were parcellated using Freesurfer to generate cortical and subcortical targets.
Results
In Figure 1 we display the probabilistic atlas labels of the two STh subregions, used as seeds. In Figures 2-3, we display the functional and structural connectomes of left STh subregions. The association (r-value) between the functional and structural connectomes of both bilateral STh subregions was equal to 0.35 (p-value=6.3e-28).Discussion and Conclusions
Both STh subregions displayed functional connectivity with motor (SN2/mRt/PTg or CnF/VSM/iMRt) and limbic (PAG/VTA-PBP) brainstem nuclei, as well as motor/limbic/associative cortical and subcortical areas. As opposed to the structural connectivity, STh subregion 1 showed a wider functional cortical connectivity comprising associative frontal and temporal areas than STh subregion 2, in line with our hypothesis. The functional and structural connectivity of STh subregions with cortical, subcortical and brainstem (motor, associative and limbic) areas is in agreement with previous literature8. These connectomes might provide a baseline to study basal ganglia disorders, and new insight into deep brain stimulation effects on STh subregions.Acknowledgements
NIH NIA-R01AG063982. Dr. Thorsten Feiweier for providing the diffusion sequence used in this study.References
1. Nambu, A., Tokuno, H. & Takada, M. Functional significance of the cortico-subthalamo-pallidal ‘hyperdirect’ pathway. Neurosci. Res. 43, 111–117 (2002).
2. Haynes, W. I. A. & Haber, S. N. The organization of prefrontal-subthalamic inputs in primates provides an anatomical substrate for both functional specificity and integration: implications for Basal Ganglia models and deep brain stimulation. J. Neurosci. 33, 4804–4814 (2013).
3. Bianciardi, M. et al. Toward an In Vivo Neuroimaging Template of Human Brainstem Nuclei of the Ascending Arousal, Autonomic, and Motor Systems. Brain Connectivity 5, 597–607 (2015).
4. Bianciardi, M. et al. A probabilistic template of human mesopontine tegmental nuclei from in vivo 7T MRI. Neuroimage 170, 222–230 (2018).
5. García-Gomar, M. G. et al. In vivo Probabilistic Structural Atlas of the Inferior and Superior Colliculi, Medial and Lateral Geniculate Nuclei and Superior Olivary Complex in Humans Based on 7 Tesla MRI. Front. Neurosci. 13, 764 (2019).
6. Singh, K. et al. Probabilistic Template of the Lateral Parabrachial Nucleus, Medial Parabrachial Nucleus, Vestibular Nuclei Complex, and Medullary Viscero-Sensory-Motor Nuclei Complex in Living Humans From 7 Tesla MRI. Front. Neurosci. 13, 1425 (2020).
7. Singh, K., García-Gomar, M. G. & Bianciardi, M. Probabilistic Atlas of the Mesencephalic Reticular Formation, Isthmic Reticular Formation, Microcellular Tegmental Nucleus, Ventral Tegmental Area Nucleus Complex, and Caudal–Rostral Linear Raphe Nucleus Complex in Living Humans from 7 Tesla Magnetic Resonance Imaging. Brain Connectivity brain.2020.0975 (2021) doi:10.1089/brain.2020.0975.
8. Benarroch, E. E. Subthalamic nucleus and its connections: Anatomic substrate for the network effects of deep brain stimulation. Neurology 70, 1991–1995 (2008).
9. Glover, G. H., Li, T. Q. & Ress, D. Image-based method for retrospective correction of physiological motion effects in fMRI: RETROICOR. Magn Reson Med 44, 162–167 (2000).
10. Destrieux, C., Fischl, B., Dale, A. & Halgren, E. Automatic parcellation of human cortical gyri and sulci using standard anatomical nomenclature. NeuroImage 53, 1–15 (2010).
11. Manjón, J. V. et al. Diffusion Weighted Image Denoising Using Overcomplete Local PCA. PLoS ONE8, e73021 (2013).
12. Varentsova, A., Zhang, S. & Arfanakis, K. Development of a high angular resolution diffusion imaging human brain template. Neuroimage 91, 177–186 (2014).
13. Irimia, A., Chambers, M. C., Torgerson, C. M. & Van Horn, J. D. Circular representation of human cortical networks for subject and population-level connectomic visualization. Neuroimage 60, 1340–1351 (2012).
Figures