3316
Adjustable parabolic shape 8Tx/16Rx array for longitudinal cardiac MRI in large animals at 7T: proof of concept1Chair of Cellular and Molecular Imaging, Comprehensive Heart Failure Center, University Hospital Würzburg, Wuerzburg, Germany
Synopsis
Cardiovascular MRI at the ultra-high-field is an emerging modality promising a significant increase of the spatial resolution and physical sensitivity of routine cardiac imaging. Pig models play an important role in the establishment and translation of 7T cMRI to humans. The prerequisite for high-quality 7T cMRI data in pigs is dedicated transceiver arrays adapted to the shape of the pig’s thorax. We validated the proof-of-concept of the transceiver pTX cardiac array with adjustable parabolic shape housing for longitudinal studies with pigs. The stability of the transmit and receive characteristics by shape adjustments are tested in-silico and in phantom measurements.
Introduction
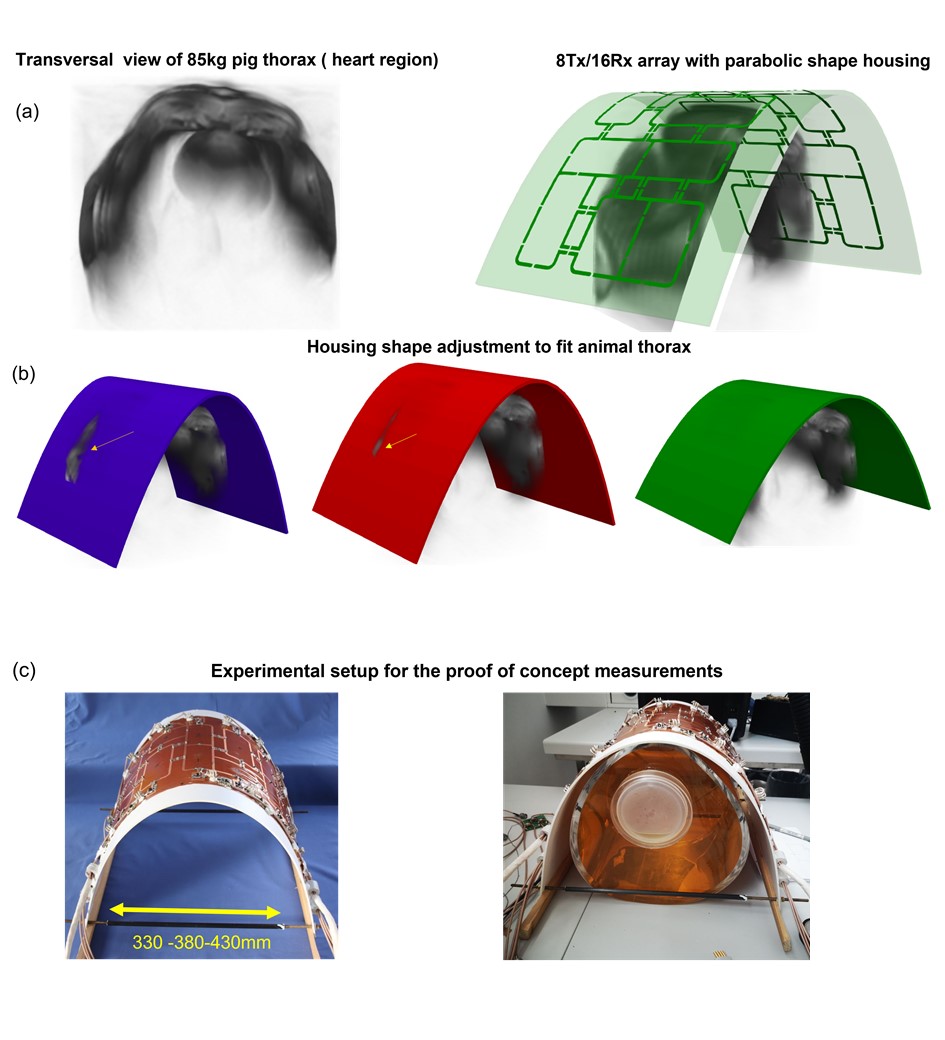
Cardiovascular MRI (cMRI) at ultra-high field is an emerging modality promising a significant increase in the spatial resolution and physical sensitivity of routine cardiac imaging. Using multiple-element transceiver arrays with parallel transmit (pTX) support allows overcoming the problem of destructive interferences of B1+-field in the thorax caused by dielectric resonances [1,2]. Porcine models play an important role in the establishment and translation of the 7T cMRI techniques to humans. The prerequisite of high-quality 7T porcine cMRI is the adaptation of the array to the shape of the pig’s thorax [3,4]. In longitudinal studies with a duration of several weeks or months, the upper range of the animal’s weight and, therefore, thorax dimensions are difficult to estimate. We present the proof of concept of the array for cMRI in pigs up to 100 kg weight with an adjustable parabolic shape. The work aimed to ensure the stability of the transmit and receive characteristics of the 8Tx/16Rx array while the shape is being accommodated to the growing dimensions of the animal thorax.Materials and Methods
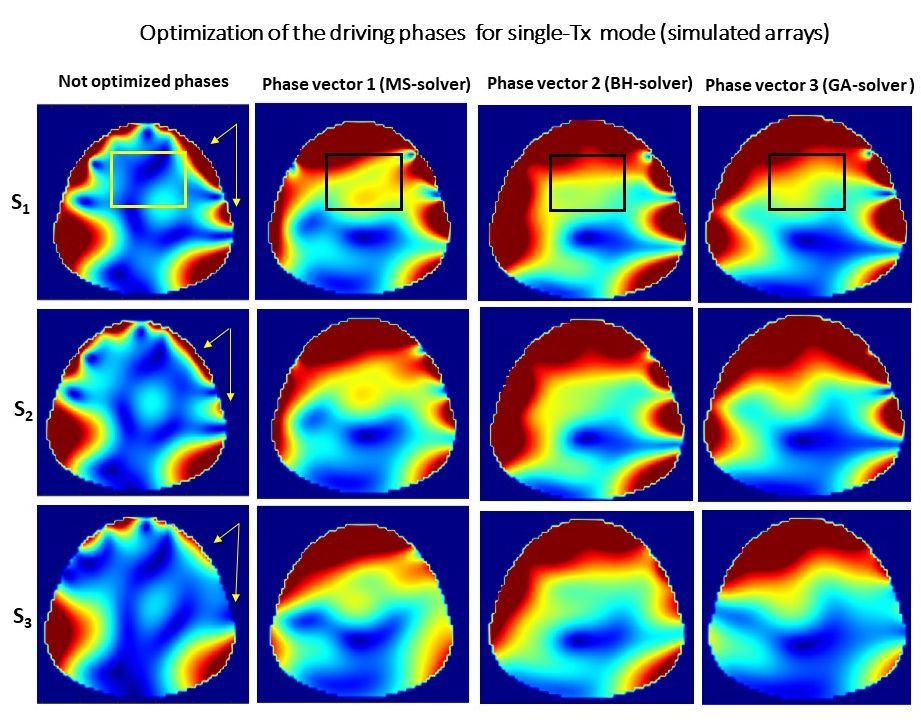
Electromagnetic simulations of the 16-element transceiver array were done using CST-Microwave-Studio. For matching and tuning the RF-circuit co-simulation was employed in CST-Design-Studio (CST-DS). The adjustable array shapes were described by the cylindrical paraboloid surfaces. The steepness of the parabolas was adjusted to fit the thorax of the pig in a range of 60 to 100 kg based on the MR-images of the real pig thorax (Figure 1a,b). Three array shapes (S1, S2, S3) were simulated to check the variation of the B1+-field profile while adjusting the housing to the pig thorax. The computation of the hardware-integrated driving phases of elements providing optimized default B1+ profile for single-Tx mode was performed using the multi-start approach [3], genetic algorithm (Matlab Global Optimization Toolbox), and basin-hopping solver (SciPy Python package). The phase vector optimized for the shape S2 was used to check the B1+-profile for all 3 shapes. Experimental testing of the adjustable parabolic shape array concept and its influence on the array characteristics was done using the prototype of the 8Tx/16Rx array with antisymmetric L-shaped elements [3] printed on the flexible substrate (Figure 1c). To make the array compatible with the pTx system, every two neighboring elements are interfaced to one Tx-channel. The adjustment of the array shape was done for 3 positions gradually increasing the distance between bottom margins. The MRI measurements with the array loaded by a pig body phantom were performed on a 7T whole-body MAGNETOM™ Siemens Terra scanner. For each array shape the measurements of the absolute B1+-maps, relative B1+-maps of individual Tx-channels, g-factor, and noise correlation matrix was done. The reference voltage for 1ms 180◦ pulse was determined by a vendor-integrated routine for each array shape. Relative B1+-maps were used for the B1-shimming in the pTX mode performed off-line using an in-house designed Matlab toolbox.Results
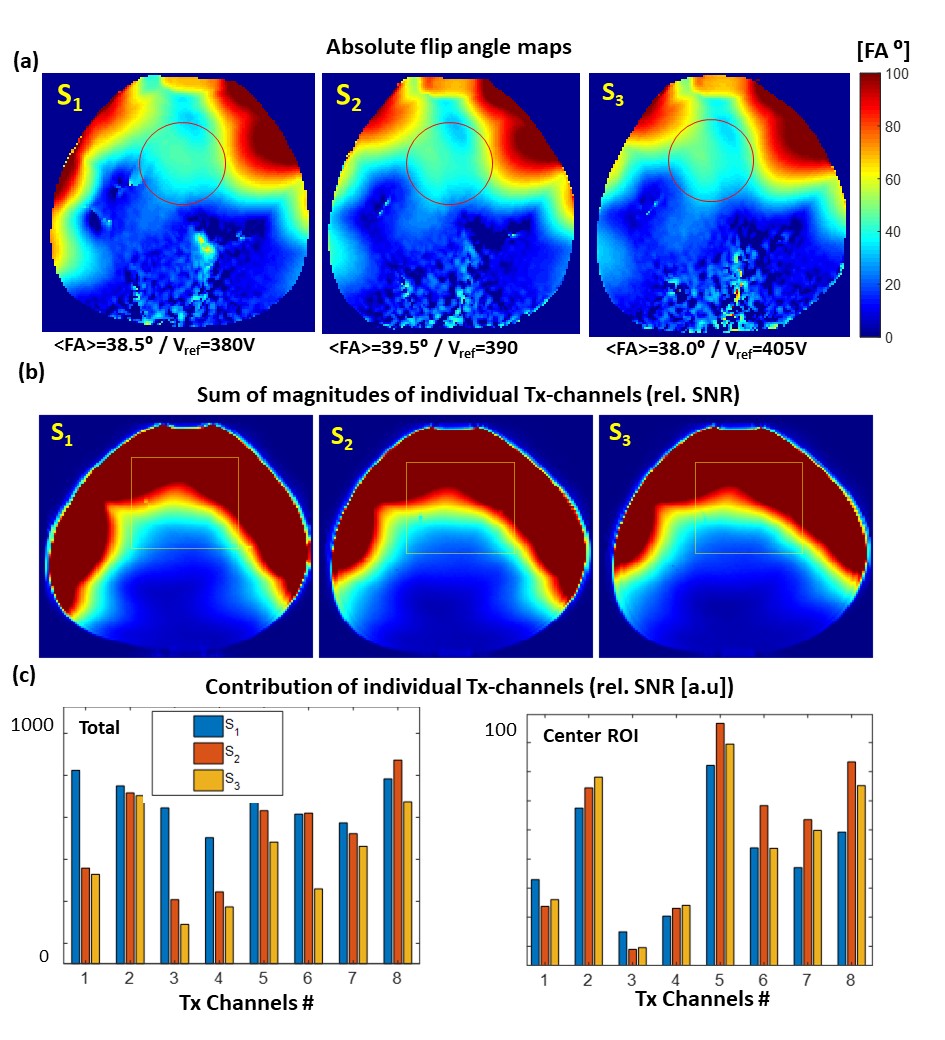
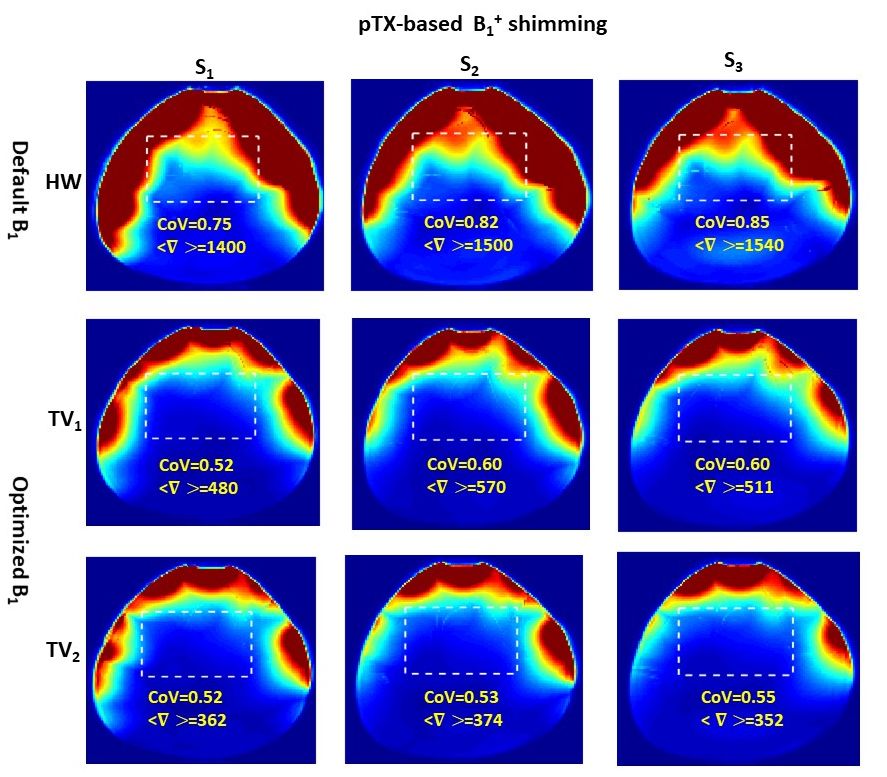
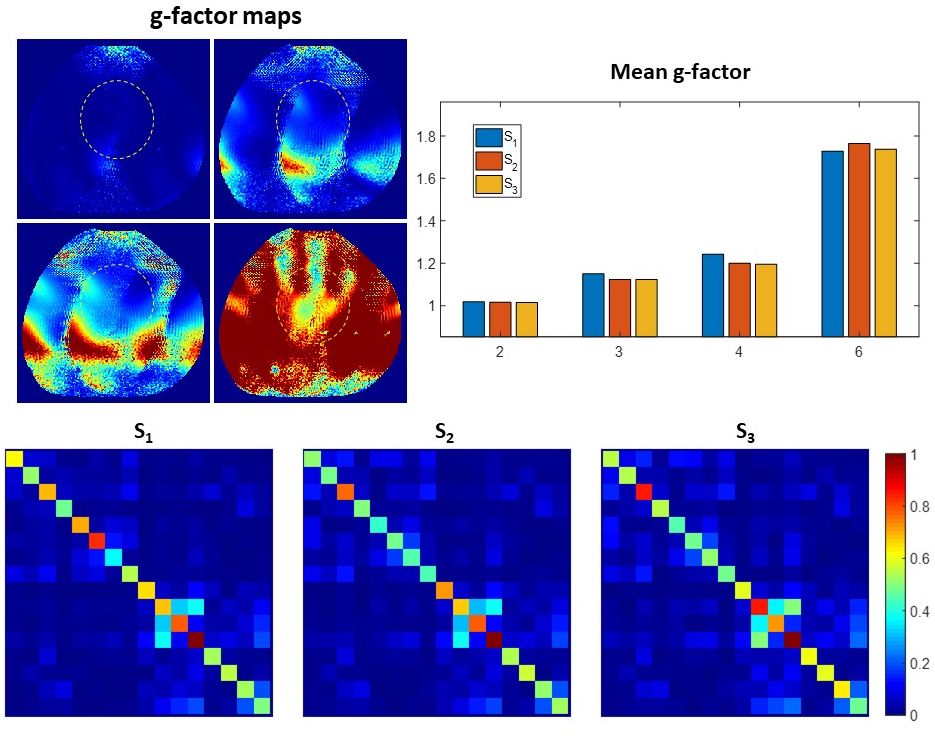
Figure 2 demonstrates the variation of the B1+ maps in the central transversal slice for three array shapes using three different optimized phase vectors for elements driving voltages. Figure 3(a) shows the absolute B1+ map measured by vendor-integrated protocol. Figure 3(b,c) shows the sum-of-magnitudes (SoM) of the relative SNR maps of the individual transmit channels. Figure 4 demonstrates the result of the pTX-based B1-shimming for all three array shapes. Finally, Figure 5 shows the effect of the array shape on the g-factor and noise correlation matrices.Discussion
The results of EM-simulation demonstrate that an optimized B1+-profile remains relatively stable while array shape changes through all three considered variants. The B1+-profiles formed by the same optimized phase vector for all three simulated shapes show a similar coefficient of variation and mean B1+. This should allow using shape adjustment once an array hardware phasing is pre-optimized for the single Tx-mode [5]. This finding also agrees with the stability of the absolute B1-map measured with the experimental setup (Figure 3a). The increased array flatness for shape S3 leads to an insignificant increase of the reference voltage (on 10%) compared to shape S1. The sum-of-magnitude SNR maps of individual Tx channels show that variation of the shape may have an essential effect on the performance of the array in the periphery of the thorax. In theory, however, the peak SNR remains stable in the central region of the thorax phantom corresponding to the animal heart position. The results of pTX-based B1-shimming demonstrate that even with the different initial states a very close coefficient of variation of the SNR in the targeted region can be shaped by pTX-B1-shimming for all three arrays shapes. Finally, g-factor mapping demonstrates full stability of the mean value in the region of the pig heart for all the tested array shapes.Conclusion
Both simulated and prototype versions of the array for cMRI with parabolic shape demonstrated steadiness of the most essential transmit and receive characteristic while the array’s shape is adjusted within a chosen range of inner dimensions. The final validation will be performed in the longitudinal in-vivo measurements with the maximal weight of the animals up to 100 kg.Acknowledgements
Financial support: German Ministry of Education and Research (BMBF, grants: 01EO1004, 01E1O1504).References
[1] Kraff O, Quick HH. Radiofrequency Coils for 7 Tesla MRI. Top Magn Reson Imaging. 2019 Jun;28(3):145-158. doi: 10.1097/RMR.0000000000000206. PMID: 31188273.
[2] Niendorf, T., Paul, K., Oezerdem, C., Graessl, A., Klix, S., Huelnhagen, T., Hezel, F., Rieger, J., Waiczies, H., Frahm, J., Nagel, A.M., Oberacker, E., Winter, L., 2016. W(h)ither human cardiac and body magnetic resonance at ultrahigh fields? technical advances, practical considerations, applications, and clinical opportunities. NMR in Biomedicine 29, 1173–1197.
[3] Elabyad IA, Terekhov M, Stefanescu MR, Lohr D, Fischer M, Schreiber LM. Design of a novel antisymmetric coil array for parallel transmit cardiac MRI in pigs at 7 T. J Magn Reson. 2019 Aug;305:195-208.
[4] Elabyad IA, Terekhov M, Lohr D, Stefanescu MR, Baltes S, Schreiber LM. A Novel Mono-surface Antisymmetric 8Tx/16Rx Coil Array for Parallel Transmit Cardiac MRI in Pigs at 7T. Scientific Reports. 2020;10(1):3117
[5] Terekhov M, Elabyad IA, Schreiber LM (2021) Global optimization of default phases for parallel transmit coils for ultra-high-field cardiac MRI. PLoS ONE 16(8): e0255341.
Figures