3309
Iron and Myelin Content in Multiple Sclerosis Lesions using Magnetic Susceptibility Source Separation
Reza Rahmanzadeh1,2, Po-Jui Lu1,2, Hyeong-Geol Shin 3, Matthias Weigel1,2, Thanh D. Nguyen4, Yi Wang4, Francesco La Rosa 5,6, Meritxell Bach Cuadra 5,6, Ernst-Wilhelm Radue1, Jens Kuhle2, Ludwig Kappos2, Jongho Lee 3, and Cristina Granziera1,2
1Translational Imaging in Neurology Basel, Department of Medicine and Biomedical Engineering, University Hospital Basel and University of Basel, Basel, Switzerland, 2Neurologic Clinic and Policlinic, Switzerland, Departments of Medicine, Clinical Research and Biomedical Engineering, University Hospital Basel and University of Basel, Basel, Switzerland, 3Laboratory for Imaging Science and Technology, Department of Electrical and Computer Engineering, Seoul National University, Seoul, Korea, Republic of, 4Department of Radiology, Weill Cornell Medical College, New York, NY, United States, 5Signal Processing Laboratory (LTS5), Ecole Polytechnique Fédérale de Lausanne (EPFL), Lausanne, Switzerland, 6Radiology Department, Center for Biomedical Imaging (CIBM), Lausanne University and University Hospital, Lausanne, Switzerland
1Translational Imaging in Neurology Basel, Department of Medicine and Biomedical Engineering, University Hospital Basel and University of Basel, Basel, Switzerland, 2Neurologic Clinic and Policlinic, Switzerland, Departments of Medicine, Clinical Research and Biomedical Engineering, University Hospital Basel and University of Basel, Basel, Switzerland, 3Laboratory for Imaging Science and Technology, Department of Electrical and Computer Engineering, Seoul National University, Seoul, Korea, Republic of, 4Department of Radiology, Weill Cornell Medical College, New York, NY, United States, 5Signal Processing Laboratory (LTS5), Ecole Polytechnique Fédérale de Lausanne (EPFL), Lausanne, Switzerland, 6Radiology Department, Center for Biomedical Imaging (CIBM), Lausanne University and University Hospital, Lausanne, Switzerland
Synopsis
Most multiple sclerosis (MS) white matter lesions (WMLs) appears hyperintense in quantitative susceptibility mapping (QSM). In the present study, we investigated the comparative contribution of myelin loss and iron deposit to QSM hyperintensity using a susceptibility source separation algorithm disentangling QSM- positive and QSM-negative susceptibility sources. Our results show that in most MS WMLs, demyelination is the source of QSM hyperintensity.
Introduction
MS is characterized by demyelination, axonal loss and iron deposition in white matter (WM) lesions1. Yet, to date, it is unclear to what extent these pathological processes are present in MS WMLs. In fact, MS lesions undergo multiple waves of de- and re-myelination, which lead to the final lesion phenotype of either demyelinated or partly/fully remyelinated2. Iron content is also extremely heterogeneous across MS WMLs and many chronic active MS lesions harbor iron-laden macrophages3. QSM is a field-to-source inversion method to map the local susceptibility sources in the biological tissue4. QSM has been used to classify MS lesions with respect to their myelin and iron content5 and it has been shown that most of MS lesions appears hyperintense in QSM, which might be due to loss of diamagnetic myelin or to accumulation of paramagnetic iron, or both. Very recently, novel method was proposed (magnetic susceptibility source separation- ‘chi-separation’), which disentangles the iron and the myelin contribution to the QSM signal 6. In the present study, we applied this method to study the comparative contribution of myelin loss and iron deposit to QSM hyperintensity in MS WMLs.Methods
Fifty MS patients underwent multi-parametric MRI in a 3T Prisma system (Siemens Healthcare, Germany) using a 64-channel head coil. The MRI protocol included: (i) 3D FLAIR (TR/TE/TI=5000/386/1800 ms), T1 map and MP2RAGE (TR/TI1/ TI2=5000/700/2500 ms) with resolution 1 mm3; (ii) FastT2-prep for myelin water imaging (TR/TE/resolution = 7.5/0.5 ms/1.25x1.25x5 mm3)7 ; (iii) (III) multi-echo gradient echo images (ME-GRE; spatial resolution 0.75 x 0.75 x 3mm3, TR 49ms, number of echoes 10 and TEs=6.7, 10.8, 14.8, 18.9, 22.9, 27.0, 31.1, 35.1, 39.2, 43.2ms). WML were automatically segmented 8 and manually corrected (n = 485). WM masks were obtained using Freesurfer9. Hyperintense QSM lesions were identified on 3D EPI QSM (n = 286). Three subjects and a total of 22 lesions were excluded because of being affected by artifacts. A 4-voxel peri-plaque (PP) layer of normal-appearing WM surrounding the lesions was automatically computed. For all included lesions the relative negative and positive susceptibility changes (hereinafter called deltaneg, deltapos), as measured in negative and positive chi-separation maps, were calculated as: (PP-WMLs)/PP. And the lesions were classified into four groups: (i) Both deltaneg & deltapos are positive (i.e. their values are not less than 0). (ii) Both deltaneg & deltapos are negative. (i.e. their values are less than 0). (iii) deltaneg is positive & deltapos is negative. (iv) deltaneg is negative & deltapos is positive.Results
286/485 (58.96%) of MS WMLs showed QSM hyperintensity. The lesion-wise distribution of positive and negative susceptibility inside QSM hyperintense WMLs shows a wide distribution (figure 1). Out of 264 included lesions, in 168 lesions (63.63%) both deltaneg & deltapos were positive (group i, Figure 2-B), showing therefore lower negative and positive susceptibility inside WMLs compared with PP tissue. In 15/264 WMLs (5.68%), both deltaneg (small negative values) and deltapos were negative (group ii, Figure 2-C). In 78/264 WMLs (29.54%), deltaneg was positive and deltapos was negative (group iii, Figure 2-A). Three remaining lesions were included in group iv and, where deltaneg was negative and deltapos was positive. However, they were located at the boundary between WM and gray matter or close to WM bundles were the delta calculation is not reliable.Discussion
Our results showed that most QSM hyperintense lesions exhibited positive deltaneg & deltapos, revealing that those lesions exhibit low myelin and iron content compared to PP tissue. We have previously suggested that some QSM lesions may correspond to chronic inactive lesions, which are characterized by extensive demyelination and low activated-cells content (that are rich in iron): the current findings support therefore this previous hypothesis2. In 29.88% of WML QSM hyperintensity was due to both demyelination and iron deposition, which is a characteristic of iron-laden macrophages in demyelinated areas10. In a minority of QSM hyperintense lesions (5.68 %), both deltaneg and deltapos were negative, suggesting that those lesions may correspond to actively remyelinating focal plaques 11.Conclusion
Our study disentangles first the contribution of myelin loss and iron deposition in MS WMLs which appears hyperintense in QSM. Our results show that QSM hyperintensity encompasses three categories of MS WMLs and mostly represents co-occurrence of iron and myelin loss in chronic inactive MS WMLs. A small proportion of this lesions, appear to be actively remyelinating.Acknowledgements
We acknowledge all the study participants.References
1. Rahmanzadeh R, Lu PJ, Barakovic M, et al. Myelin and axon pathology in multiple sclerosis assessed by myelin water and multi-shell diffusion imaging. Brain. Mar 9 2021;doi:10.1093/brain/awab088 2. Kuhlmann T, Ludwin S, Prat A, Antel J, Bruck W, Lassmann H. An updated histological classification system for multiple sclerosis lesions. Acta Neuropathol. Jan 2017;133(1):13-24. doi:10.1007/s00401-016-1653-y 3. Tham M, Frischer JM, Weigand SD, et al. Iron Heterogeneity in Early Active Multiple Sclerosis Lesions. Ann Neurol. Nov 27 2020;doi:10.1002/ana.25974 4. Liu T, Xu W, Spincemaille P, Avestimehr AS, Wang Y. Accuracy of the morphology enabled dipole inversion (MEDI) algorithm for quantitative susceptibility mapping in MRI. IEEE Trans Med Imaging. Mar 2012;31(3):816-24. doi:10.1109/TMI.2011.2182523 5. Chen W, Gauthier SA, Gupta A, et al. Quantitative susceptibility mapping of multiple sclerosis lesions at various ages. Radiology. Apr 2014;271(1):183-92. doi:10.1148/radiol.13130353 6. Shin HG, Lee J, Yun YH, et al. chi-separation: Magnetic susceptibility source separation toward iron and myelin mapping in the brain. Neuroimage. Oct 15 2021;240:118371. doi:10.1016/j.neuroimage.2021.118371 7. Nguyen TD, Deh K, Monohan E, et al. Feasibility and reproducibility of whole brain myelin water mapping in 4 minutes using fast acquisition with spiral trajectory and adiabatic T2prep (FAST-T2) at 3T. Magn Reson Med. Aug 2016;76(2):456-65. doi:10.1002/mrm.25877 8. La Rosa F, Abdulkadir A, Fartaria MJ, et al. Multiple sclerosis cortical and WM lesion segmentation at 3T MRI: a deep learning method based on FLAIR and MP2RAGE. Neuroimage Clin. Jun 30 2020;27:102335. doi:10.1016/j.nicl.2020.102335 9. Fischl B. FreeSurfer. Neuroimage. Aug 15 2012;62(2):774-81. doi:10.1016/j.neuroimage.2012.01.021 10. Marik C, Felts PA, Bauer J, Lassmann H, Smith KJ. Lesion genesis in a subset of patients with multiple sclerosis: a role for innate immunity? Brain. Nov 2007;130(Pt 11):2800-15. doi:10.1093/brain/awm236 11. Lee NJ, Ha SK, Sati P, et al. Potential role of iron in repair of inflammatory demyelinating lesions. J Clin Invest. Oct 1 2019;129(10):4365-4376. doi:10.1172/JCI126809Figures
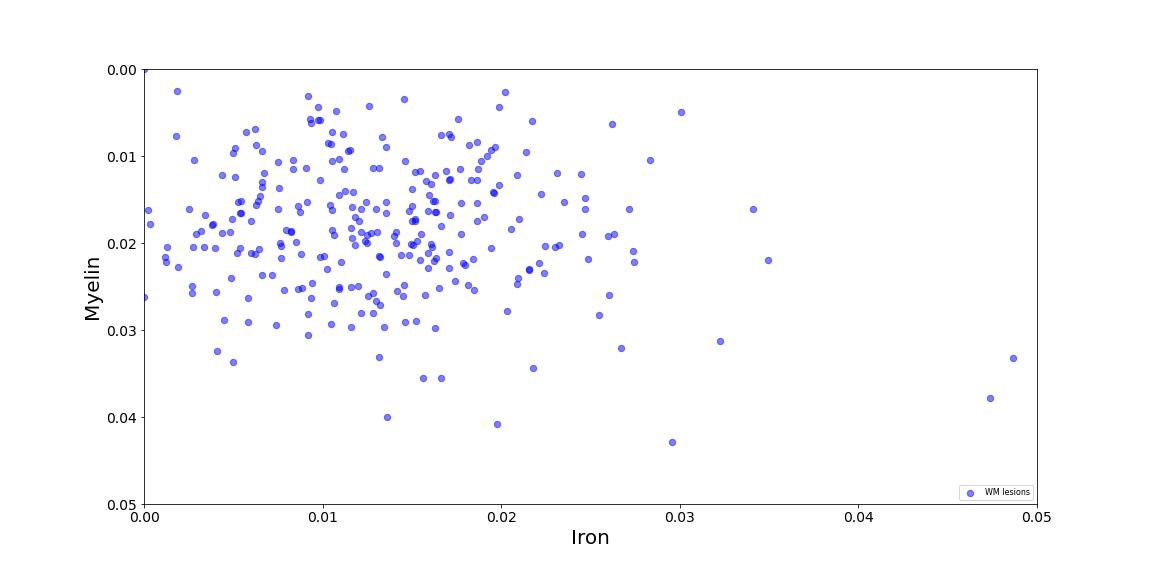
Figure 1. The scatter-plot shows the distribution of
negative and positive susceptibility (depicted as myelin and iron,
respectively) across WMLs with QSM hyperintensity.
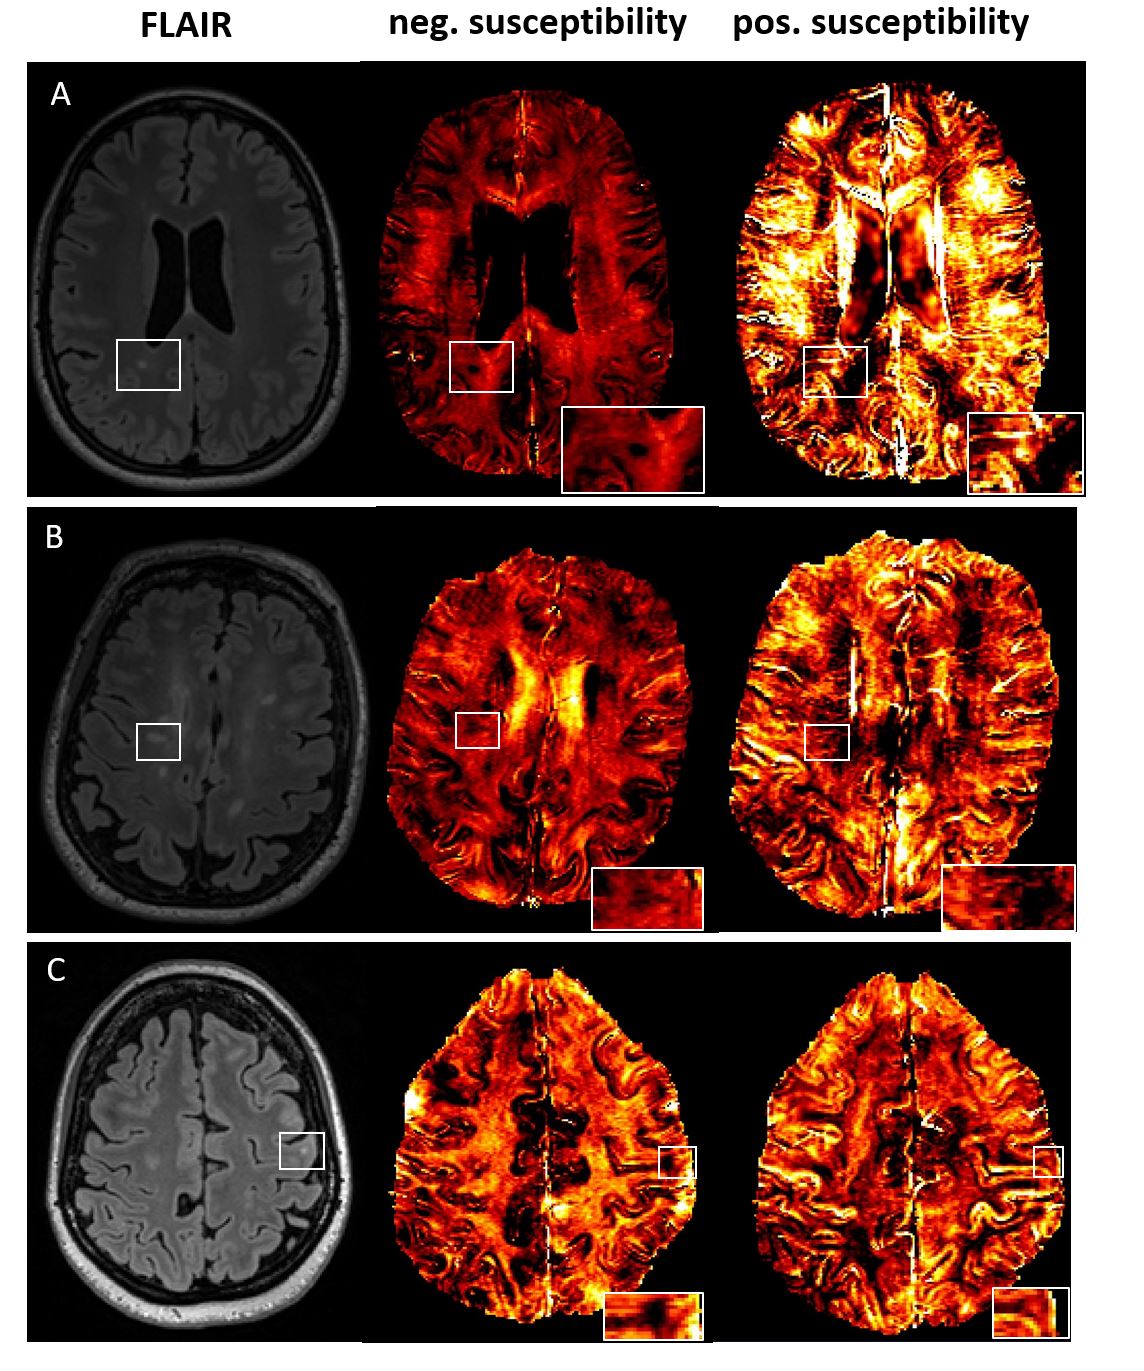
Figure 2. A, 29.54% of WML belonging to group (iii);
B, 63.63% of WML belonging to group (i); C, 5.68% of WML belonging to group
(ii).
DOI: https://doi.org/10.58530/2022/3309