3308
Feature and voxel fidelity constraints improve the accuracy of direct inversion quantitative susceptibility mapping in deep gray matter1Medical Physics Unit, McGill University, Montreal, QC, Canada, 2Medical Imaging, McGill University Health Centre, Montreal, QC, Canada, 3Research Institute of the McGill University Health Centre, Montreal, QC, Canada
Synopsis
We have designed a novel QSM algorithm that addresses some of the limitations of existing techniques that combine the background removal and dipole inversion steps in a single step. We propose that the solution to the direct inversion problem can be aided by an iterative k-space algorithm and the inclusion of a priori information that represents feature-based and voxel-fidelity-based constraints. The considered approach, when compared with other techniques, resulted in a more accurate depiction of the susceptibility in high susceptibility deep gray matter (dGM) structures without sacrificing performance in regions like the cortex of the brain.
Introduction
In QSM, a conventional pipeline performs the background field removal and dipole inversion in separate steps. Direct inversion methods combine these two steps in a single algorithm1–5. When comparing direct inversion methods to conventional QSM, the former offers a better depiction of the susceptibility at the edges of the brain, without requiring edge erosion2,3. This enables the study of susceptibility in regions like the cortex. However, direct inversion methods tend to underestimate the susceptibility of high susceptibility sources4,5. Based on this observation, we have developed a direct inversion method that incorporates additional a priori information that we hypothesized would produce a more accurate susceptibility distribution. This a priori information is implemented in the algorithm by adding constraints as suggested in scSWIM6 and through a k-space iterative approach as in iSWIM7.Methods
In our method, the susceptibility distribution $$$\chi^{*}$$$ is calculated by solving the optimization problem:$$\chi^{*}=\text{min}_{\chi}\left\Vert WM\left(B-F^{-1}DFP\chi\right)\right\Vert _{2}^{2}+\alpha\left\Vert M_{F}\nabla\chi\right\Vert _{0}+\beta\left\Vert M_{VF}P\chi\right\Vert _{2}^{2}$$ $$$W$$$ is a weighting matrix that accounts for non-uniform noise in the phase and is derived from the magnitude of the gradient echo (GRE) complex data8. $$$M$$$ is a binary mask defining the brain. $$$F,\text{ }D,\text{ }\nabla$$$ are the operators representing the Fourier transform, dipole kernel in k-space, and gradient, respectively. $$$B$$$ is the total field shift (TFS) map obtained after phase processing (phase offset correction, phase unwrapping, and combination of multi-echo information through a weighted least-squares fit). $$$P$$$ is a right preconditioner2. $$$M_{F}$$$ and $$$M_{VF}$$$ are weighting matrices that enforce feature-based and voxel-fidelity-based constraints, respectively6. The solution of the optimization problem was achieved using a variable-splitting algorithm5,9. The problem was divided in two loops (“L2-Loop” and “L0-Loop” in Figure 1). The L2-Loop is solved using a Conjugate Gradient (CG) algorithm, while the L0-Loop is solved using Iterative Hard Thresholding (IHT)10. The optimal $$$\alpha$$$ and $$$\beta$$$ were estimated using the L-curve heuristic11. Inside the L2-loop, an iterative k-space algorithm was included to improve the solution of the CG output7. The constraints $$$M_{F}$$$ and $$$M_{VF}$$$ are derived from the calculated susceptibility map and a separately collected T1-weighted dataset6.
To study the feasibility of our method, we used a version of the SIM1 numerical brain phantom from the QSM reconstruction challenge 2.012,13. The phantom was generated from the publicly available code with a 0.64 mm isotropic voxel size. The results from the proposed method were compared with TFI2 and MEDI14, using the ICC and normalized RMSE. The comparison was done in anatomically relevant regions-of-interest (ROIs) corresponding to whole brain, deep gray matter (dGM), thalamus, white matter (WM, including encephalus, cerebellum, and brain stem), grey matter (GM, including cerebral and cerebellar cortex, amygdalae, and hippocampus), and blood vessels. It is assumed that the GM mask represents cortical gray matter. The dGM structures considered are caudate nucleus (CN), putamen (PU), red nucleus (RN), substantia nigra (SN), globus pallidus (GP), and dentate nucleus (DN). Additionally, a visual assessment of the susceptibility maps was performed.
Results and Discussion
The susceptibility maps from our method retain anatomical features and blood vessels at a level comparable to MEDI, avoiding the “flat” appearance of the TFI result12 (Figure 2). However, dark/bright artifacts15 due to errors in the brain masks are more prominent in our method due to the use of Tikhonov regularization to enforce voxel-fidelity constraints. TFI and the proposed method produced a similar amount of streaking artifacts due to the calcification showed in the sagittal view. MEDI presents less artifacts due to the calcification16,17.Based on the ICC, our method is more accurate for dGM susceptibility when compared to TFI (Figure 3). Also, when compared to TFI, our method addresses the underestimation of the susceptibility in high susceptibility dGM regions corresponding to the SN and DN5. However, the method tends to overestimate the susceptibility in the CN, PU, RN, and GP (as supported by the RMSE values in Table 1).
The proposed method is a promising approach to study the susceptibility in the cortical region of the brain. According to the RMSE (Table 1), the proposed approach is the best when evaluated in the whole brain, WM, GM, and blood vessels masks. Of particular interest is the fact that our method outperforms MEDI and achieves a comparable performance to TFI within the GM mask which represents cortical gray matter. This observation is further supported by Figure 4 and the agreement of the histograms for TFI and our technique for the GM mask.
Conclusions
The proposed method achieves a comparable accuracy to TFI within the cortex while improving the accuracy in dGM structures. Additionally, our method improves depiction of anatomical features when compared to TFI. Our method outperforms MEDI (according to the RMSE metric) when evaluated in the WM and GM masks. However, this approach also introduces further challenges like the overestimation of susceptibility in CN, PU, RN, and GP and the increased number of dark/bright artifacts. Future work will include assessment in vivo.Acknowledgements
We acknowledge funding from NSERC, FRQS, and FRQNT.
References
1. Liu Z, Wen Y, Spincemaille P, et al. Automated adaptive preconditioner for quantitative susceptibility mapping. Magn Reson Med. 2020;83(1):271-285. doi:https://doi.org/10.1002/mrm.27900
2. Liu Z, Kee Y, Zhou D, Wang Y, Spincemaille P. Preconditioned total field inversion (TFI) method for quantitative susceptibility mapping. Magn Reson Med. 2017;78(1):303-315. doi:10.1002/mrm.26331
3. Sun H, Ma Y, MacDonald ME, Pike GB. Whole head quantitative susceptibility mapping using a least-norm direct dipole inversion method. Neuroimage. 2018;179:166-175. doi:10.1016/j.neuroimage.2018.06.036
4. Balasubramanian PS, Spincemaille P, Guo L, Huang W, Kovanlikaya I, Wang Y. Spatially Adaptive Regularization in Total Field Inversion for Quantitative Susceptibility Mapping. iScience. 2020;23(10):101553. doi:10.1016/j.isci.2020.101553
5. Zhang L, Chen X, Lin J, et al. Fast quantitative susceptibility reconstruction via total field inversion with improved weighted L(0) norm approximation. NMR Biomed. 2019;32(5):e4067. doi:10.1002/nbm.4067
6. Gharabaghi S, Liu S, Wang Y, et al. Multi-Echo Quantitative Susceptibility Mapping for Strategically Acquired Gradient Echo (STAGE) Imaging. Front Neurosci. 2020;14:581474. doi:10.3389/fnins.2020.581474
7. Tang J, Liu S, Neelavalli J, Cheng YCN, Buch S, Haacke EM. Improving susceptibility mapping using a threshold-based K-space/image domain iterative reconstruction approach. Magn Reson Med. 2013;69(5):1396-1407. doi:https://doi.org/10.1002/mrm.24384
8. de Rochefort L, Liu T, Kressler B, et al. Quantitative susceptibility map reconstruction from MR phase data using bayesian regularization: Validation and application to brain imaging. Magn Reson Med. 2010;63(1):194-206. doi:https://doi.org/10.1002/mrm.22187
9. Bilgic B, Fan AP, Polimeni JR, et al. Fast quantitative susceptibility mapping with L1-regularization and automatic parameter selection. Magn Reson Med. 2014;72(5):1444-1459. doi:10.1002/mrm.25029
10. Mancera L, Portilla J. Non-convex sparse optimization through deterministic annealing and applications. In: 2008 15th IEEE International Conference on Image Processing. ; 2008:917-920. doi:10.1109/ICIP.2008.4711905
11. Milovic C, Prieto C, Bilgic B, et al. Comparison of parameter optimization methods for quantitative susceptibility mapping. Magn Reson Med. 2021;85(1):480-494. doi:10.1002/mrm.28435
12. Bilgic B, Langkammer C, Marques JP, Meineke J, Milovic C, Schweser F. QSM reconstruction challenge 2.0: Design and report of results. Magn Reson Med. 2021;86(3):1241-1255. doi:https://doi.org/10.1002/mrm.28754
13. Marques JP, Meineke J, Milovic C, et al. QSM reconstruction challenge 2.0: A realistic in silico head phantom for MRI data simulation and evaluation of susceptibility mapping procedures. Magn Reson Med. 2021;86(1):526-542. doi:10.1002/mrm.28716
14. Liu J, Liu T, de Rochefort L, et al. Morphology enabled dipole inversion for quantitative susceptibility mapping using structural consistency between the magnitude image and the susceptibility map. Neuroimage. 2012;59(3):2560-2568. doi:10.1016/j.neuroimage.2011.08.082
15. Wen Y, Spincemaille P, Nguyen T, et al. Multiecho complex total field inversion method (mcTFI) for improved signal modeling in quantitative susceptibility mapping. Magn Reson Med. 2021;86(4):2165-2178. doi:10.1002/mrm.28814
16. Liu T, Xu W, Spincemaille P, Avestimehr AS, Wang Y. Accuracy of the morphology enabled dipole inversion (MEDI) algorithm for quantitative susceptibility mapping in MRI. IEEE Trans Med Imaging. 2012;31(3):816-824. doi:10.1109/TMI.2011.2182523
17. Liu Z, Spincemaille P, Yao Y, Zhang Y, Wang Y. MEDI+0: Morphology enabled dipole inversion with automatic uniform cerebrospinal fluid zero reference for quantitative susceptibility mapping. Magn Reson Med. 2018;79(5):2795-2803. doi:https://doi.org/10.1002/mrm.26946
Figures
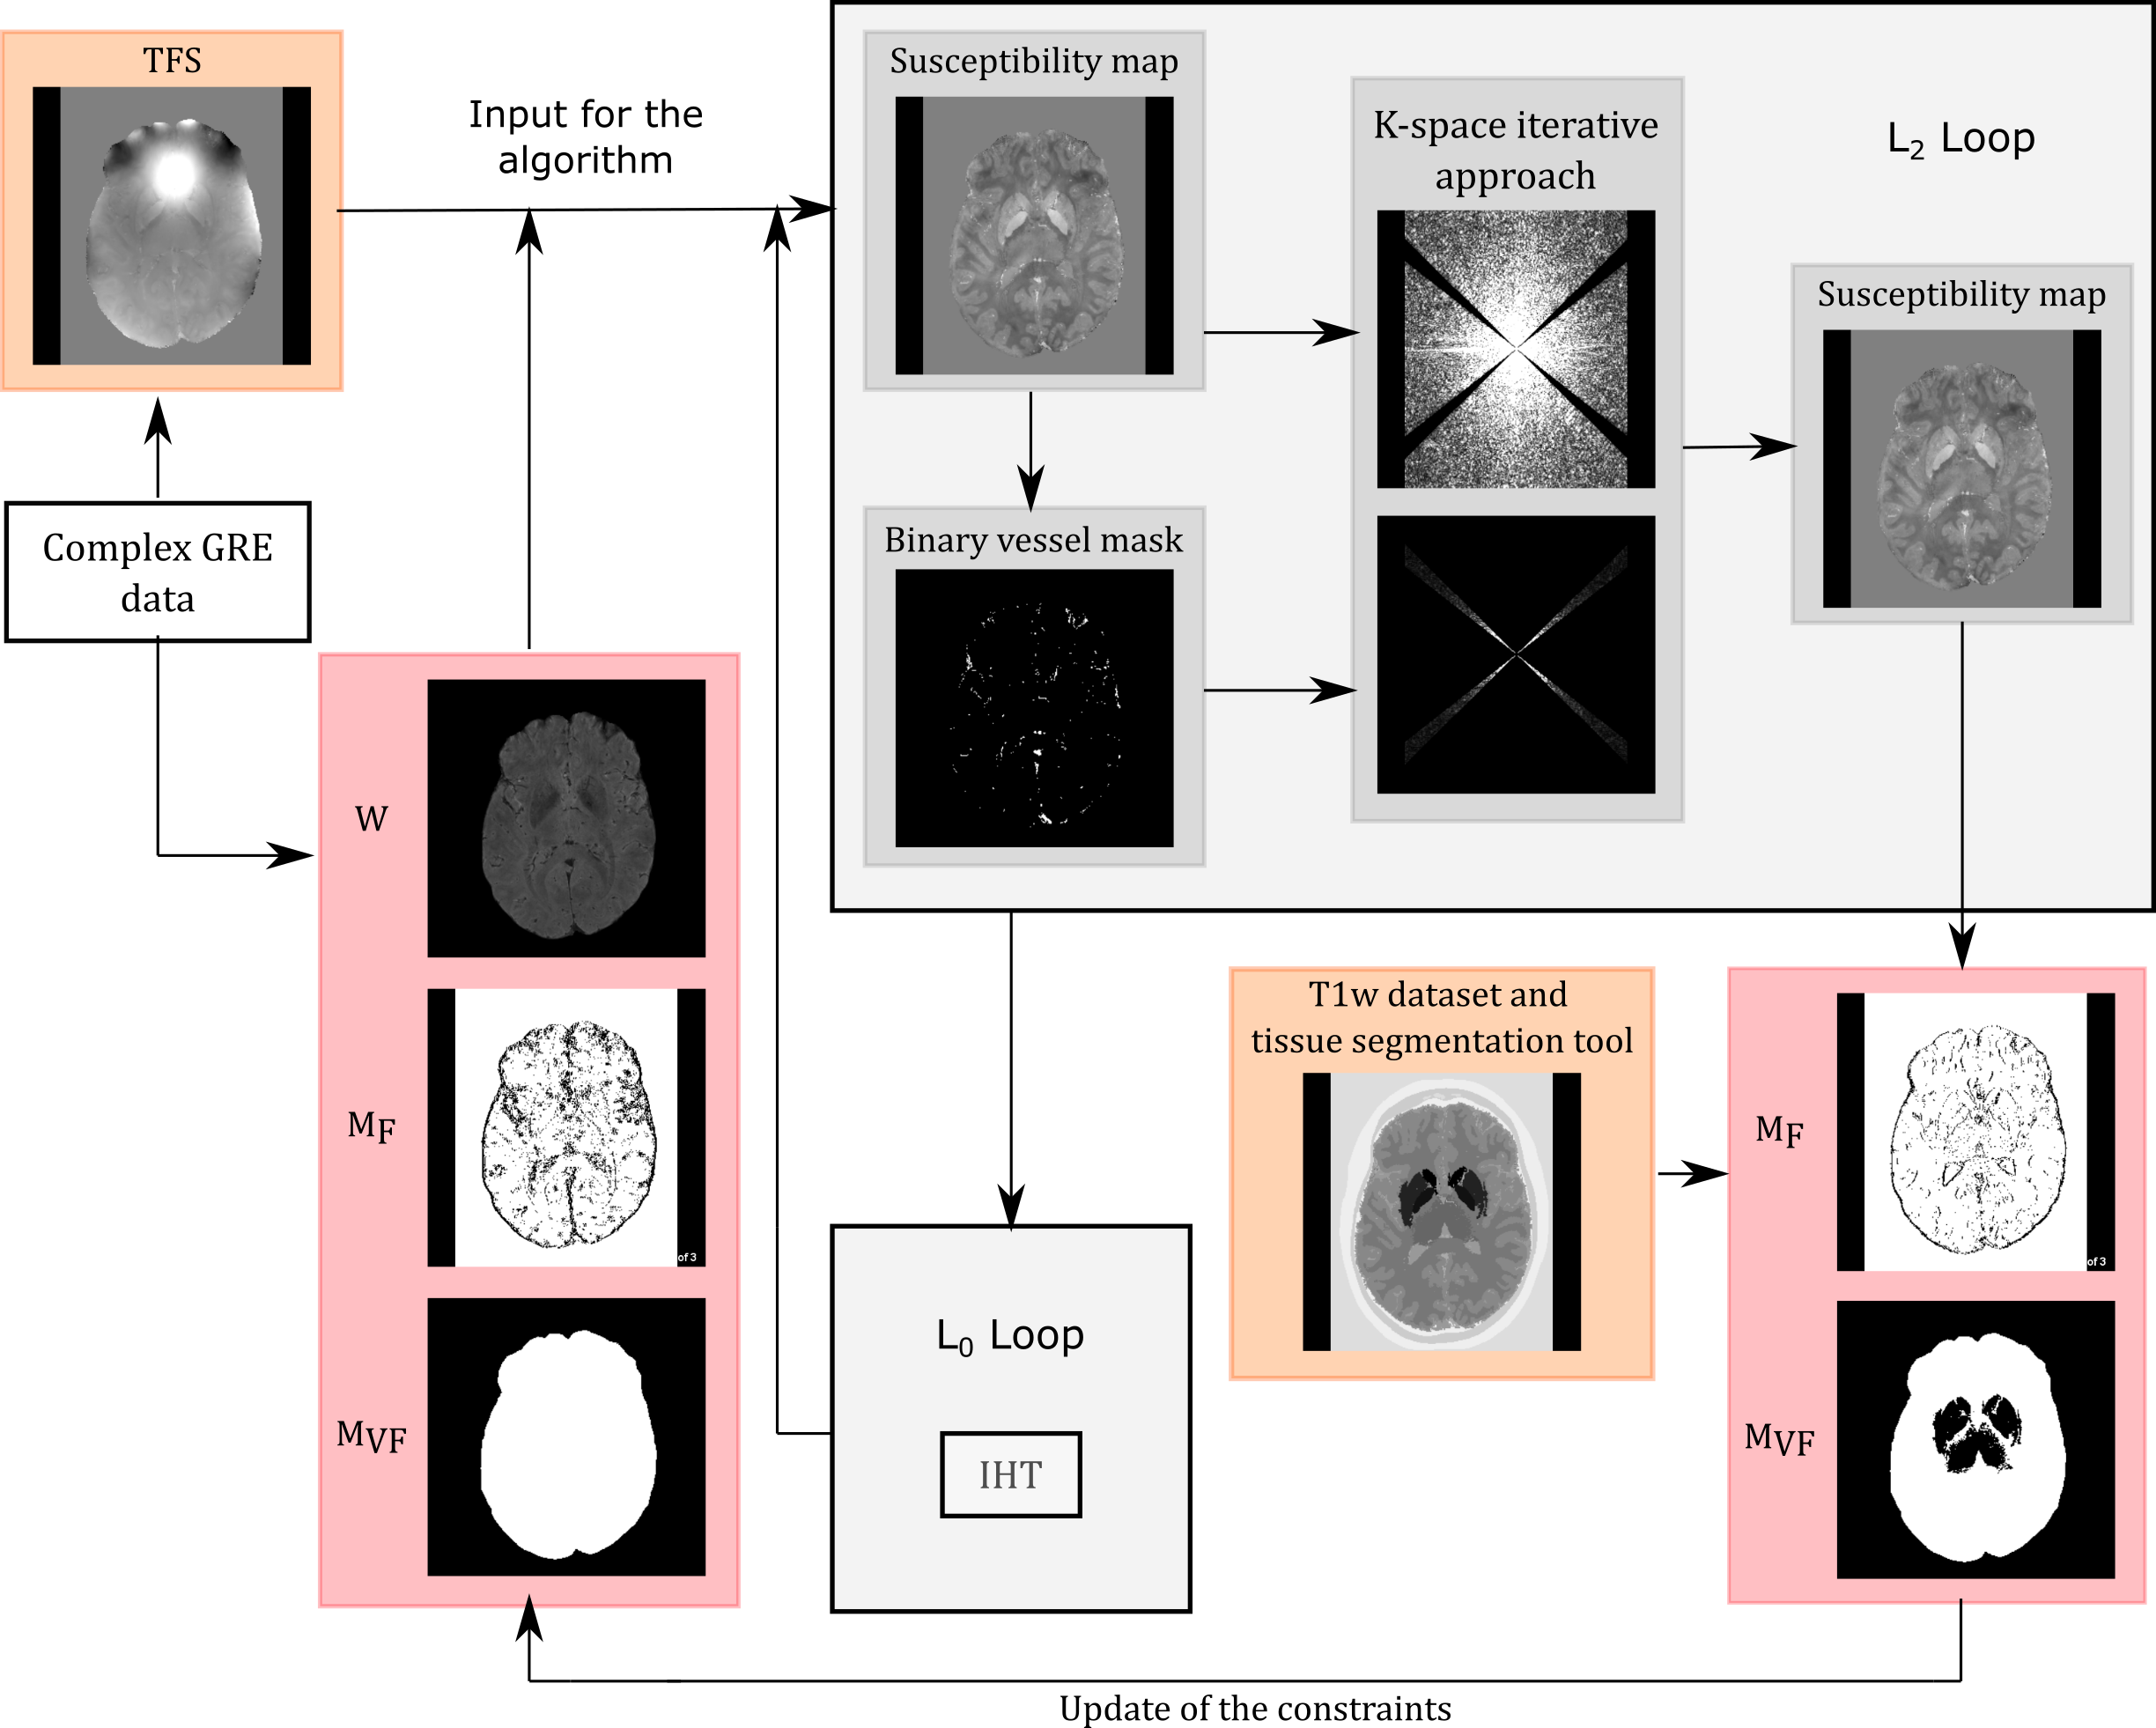
Figure 1: Schematic representation of the operation of the proposed direct inversion method. The figure represents the two loops required to solve the optimization problem (L2-loop and L0-loop) through the variable-splitting algorithm. The figure also represents the inclusion of the k-space iterative solution within the first L2-loop iteration to improve the solution and the update of the constraints $$$M_{F}$$$ and $$$M_{VF}$$$.
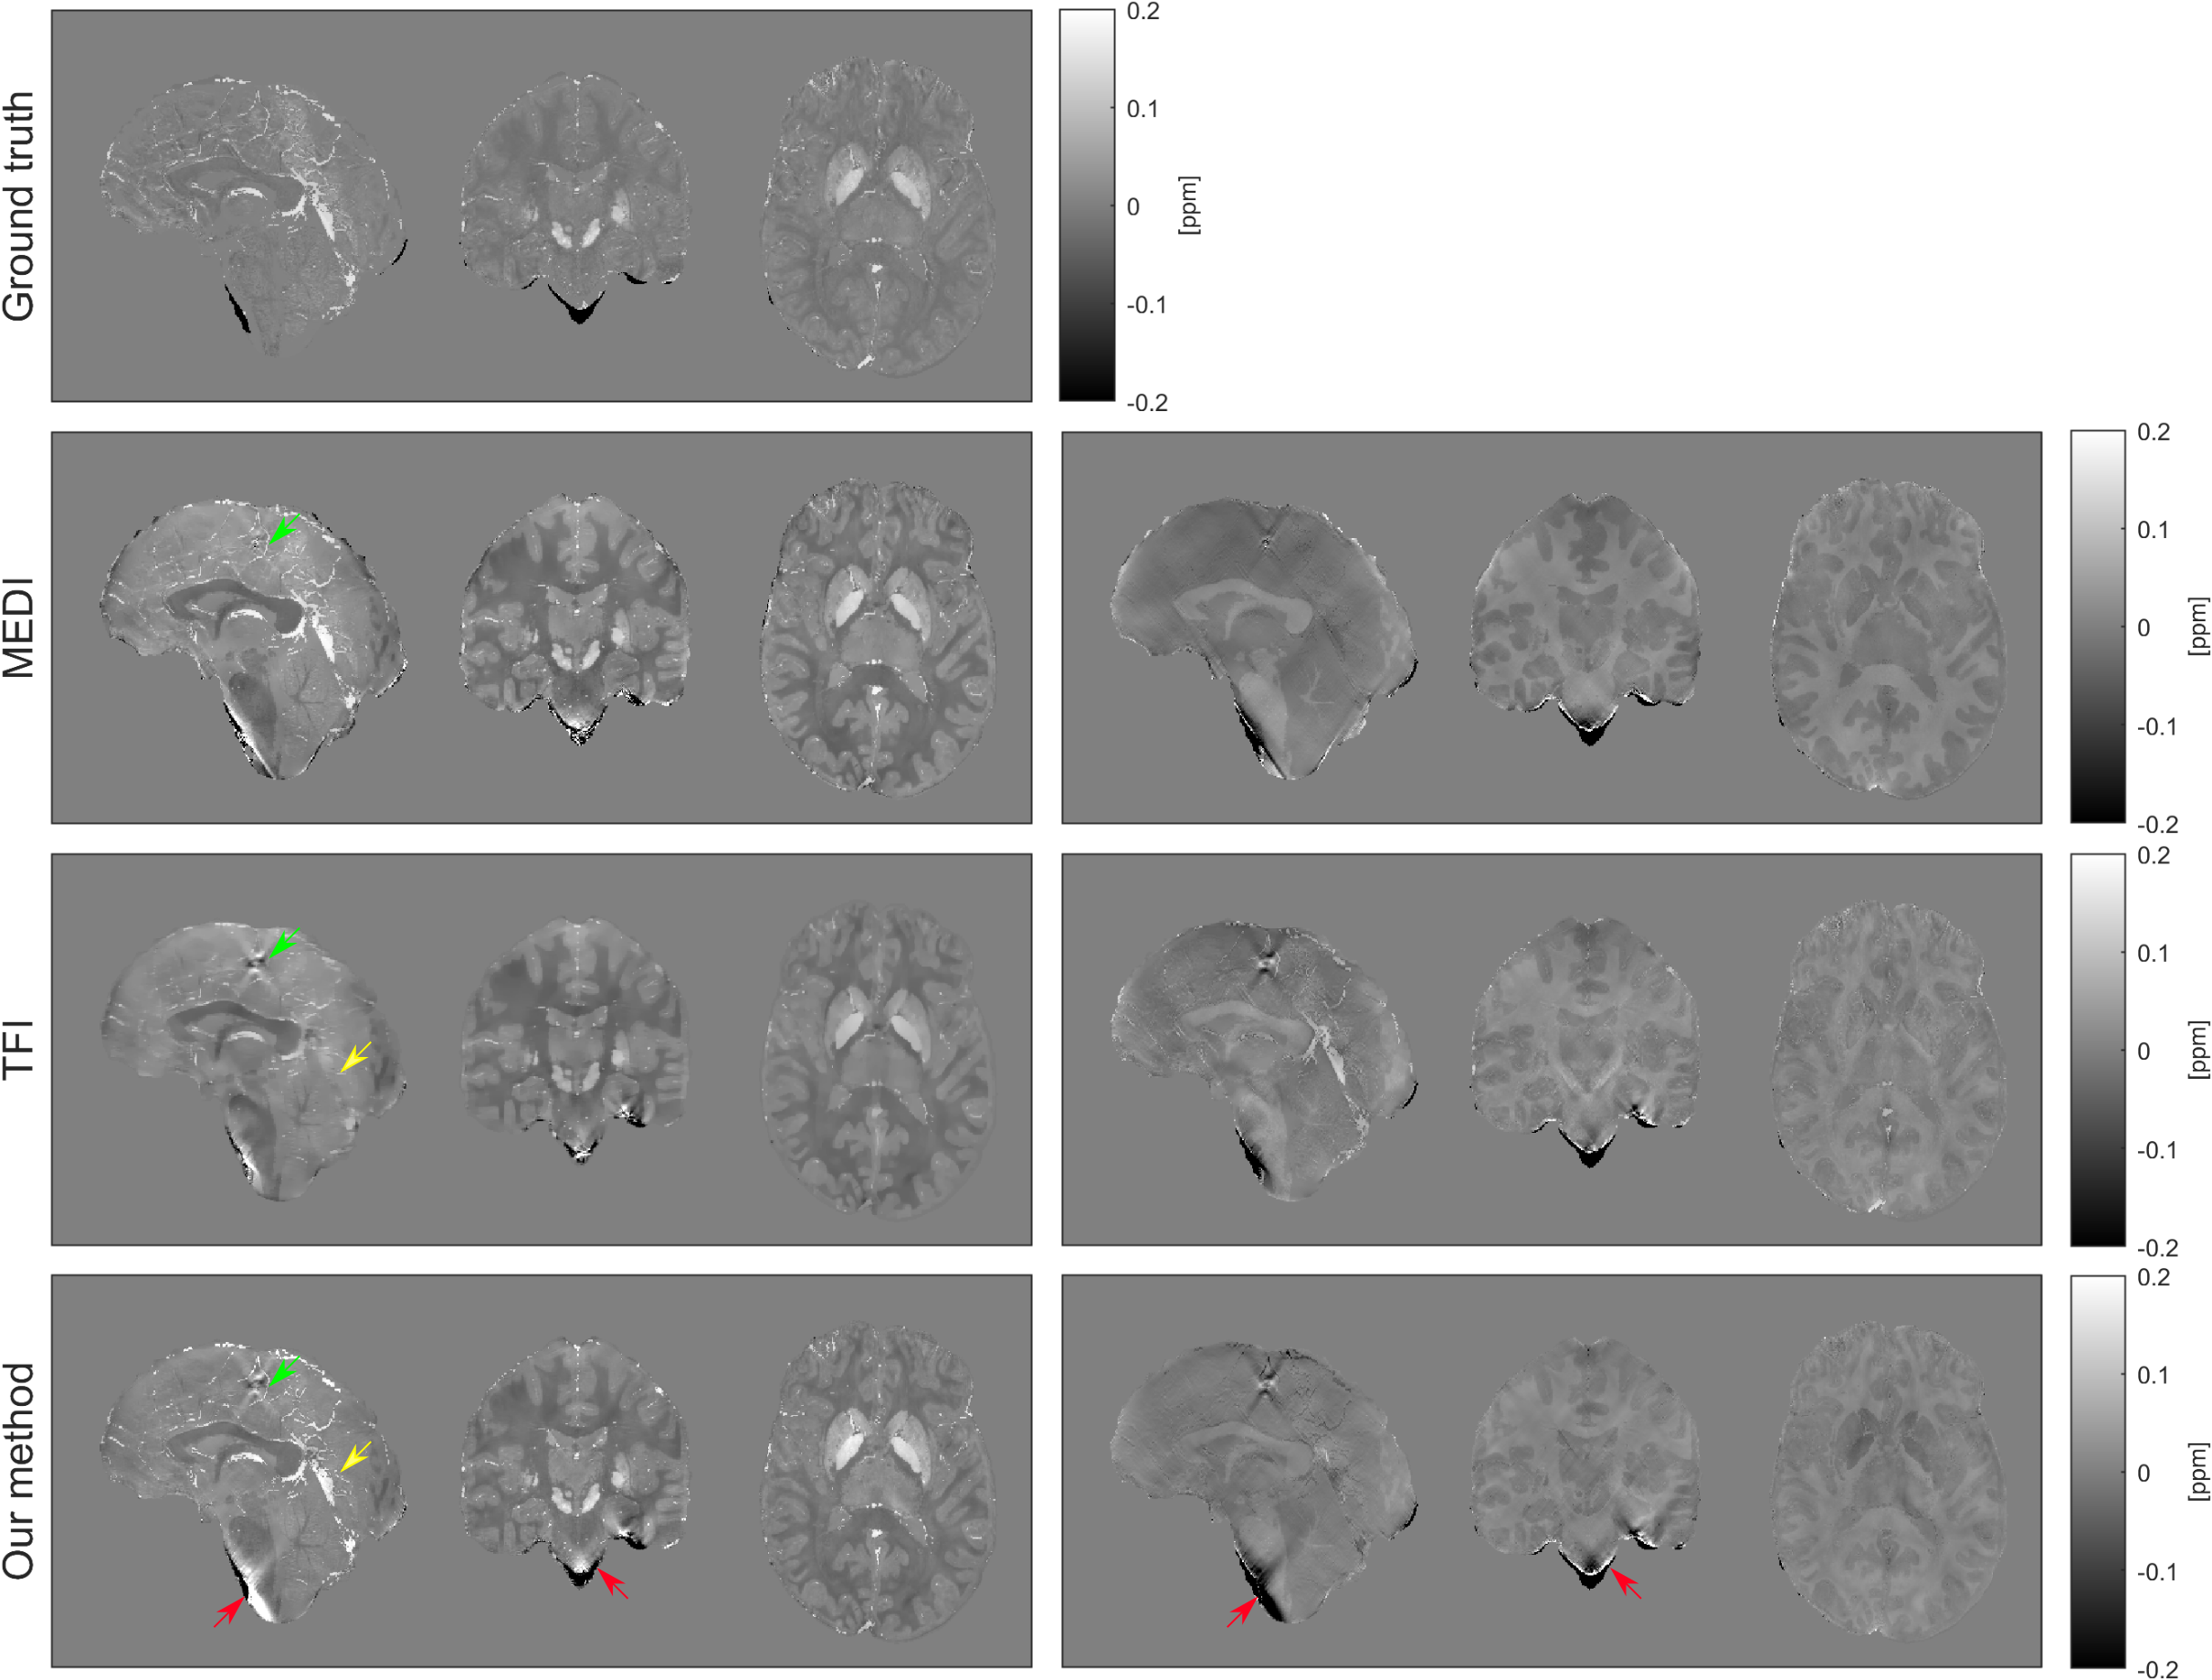
Figure 2: Susceptibility maps (left) and difference maps (right) with the ground truth as reference for MEDI, TFI and the proposed approach. The yellows arrows indicate improve depiction of blood vessels when comparing our solution with TFI. The red arrows indicate the increased number of dark/bright artifacts due to the erroneous inclusion of bone (dark regions) in the brain mask. The green arrows indicate the presence of a calcification.
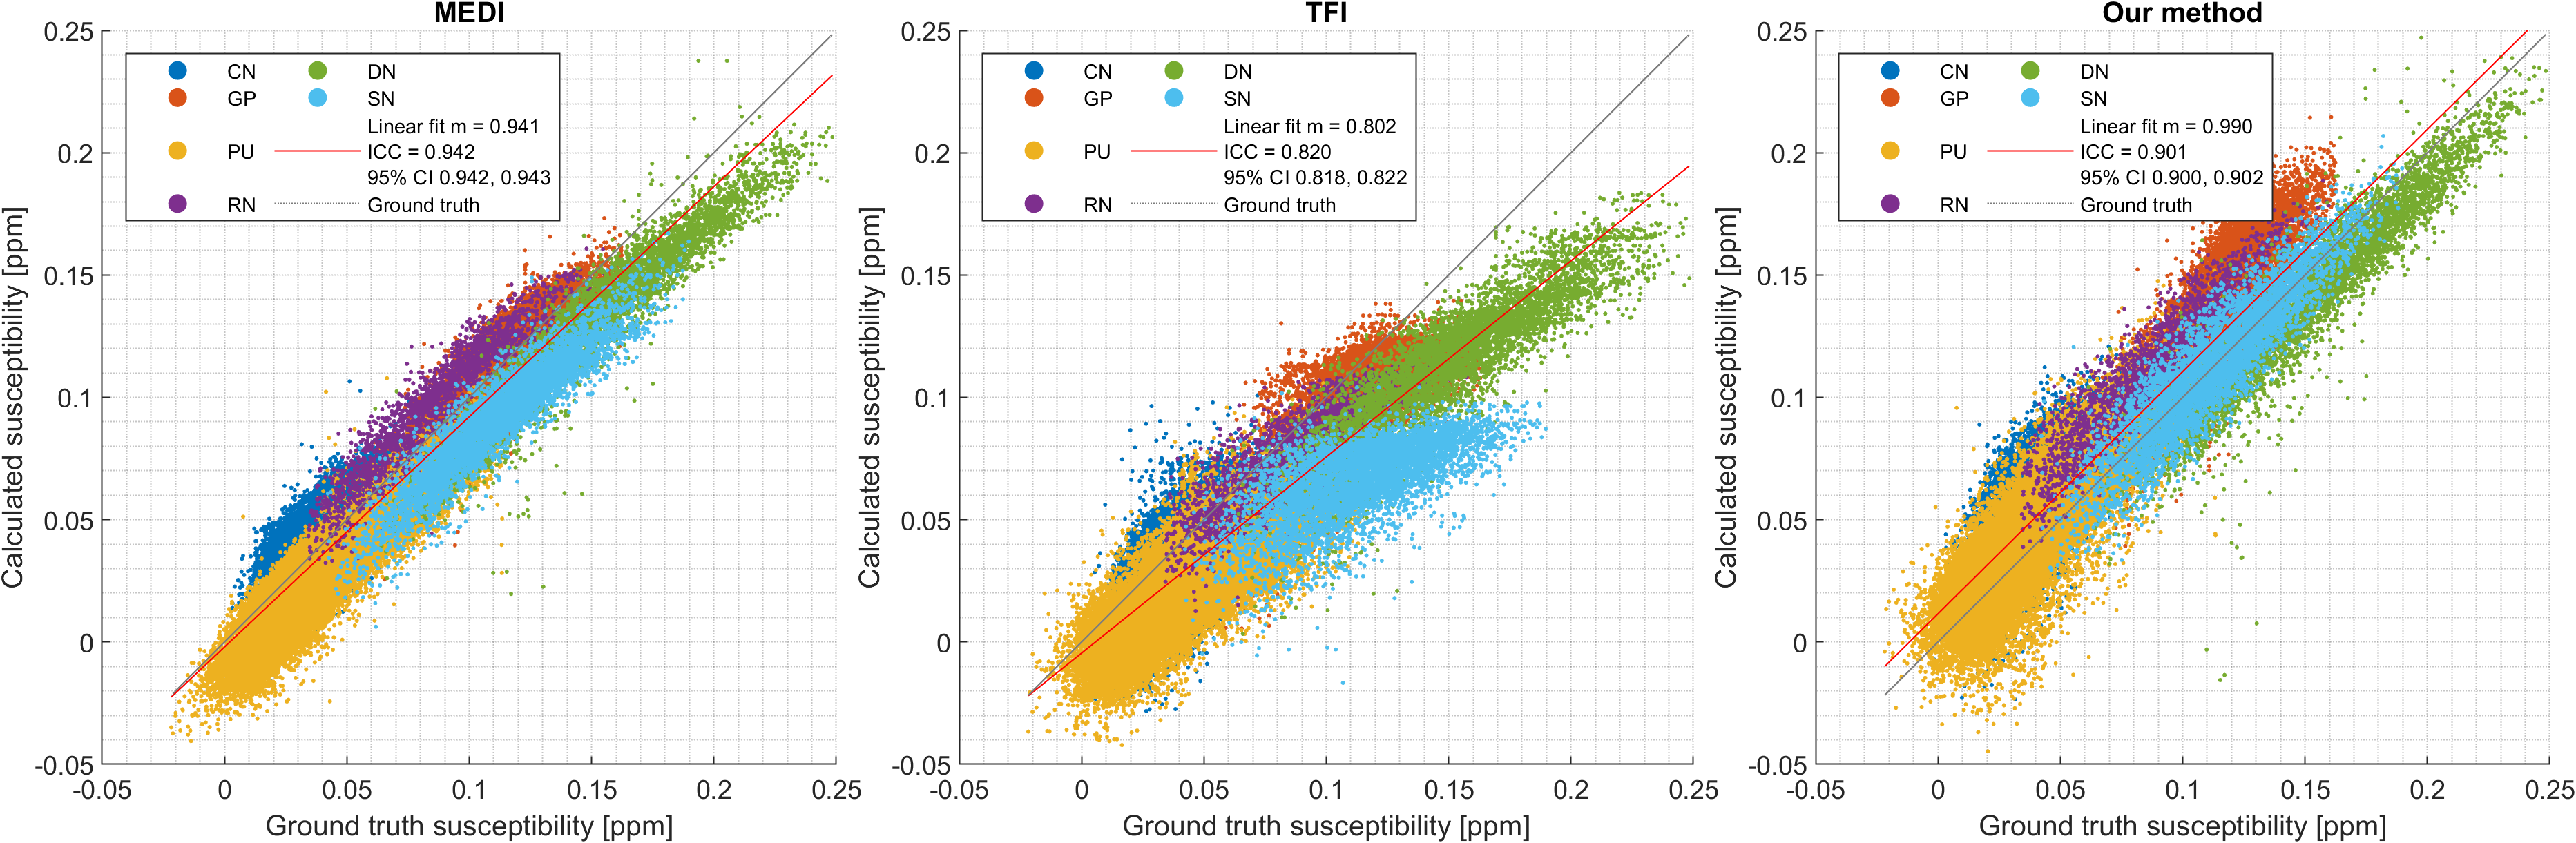
Figure 3: Reconstructed susceptibility per voxel as function of the corresponding values in the ground truth. The values were measured using masks representing the following dGM structures: caudate nucleus (CN), putamen (PU), red nucleus (RN), substantia nigra (SN), globus pallidus (GP), and dentate nucleus (DN). The slope m of the linear fit in each case is presented in the figure. The R2 values for MEDI, TFI, and our method are 0.906, 0.836, and 0.875, respectively.
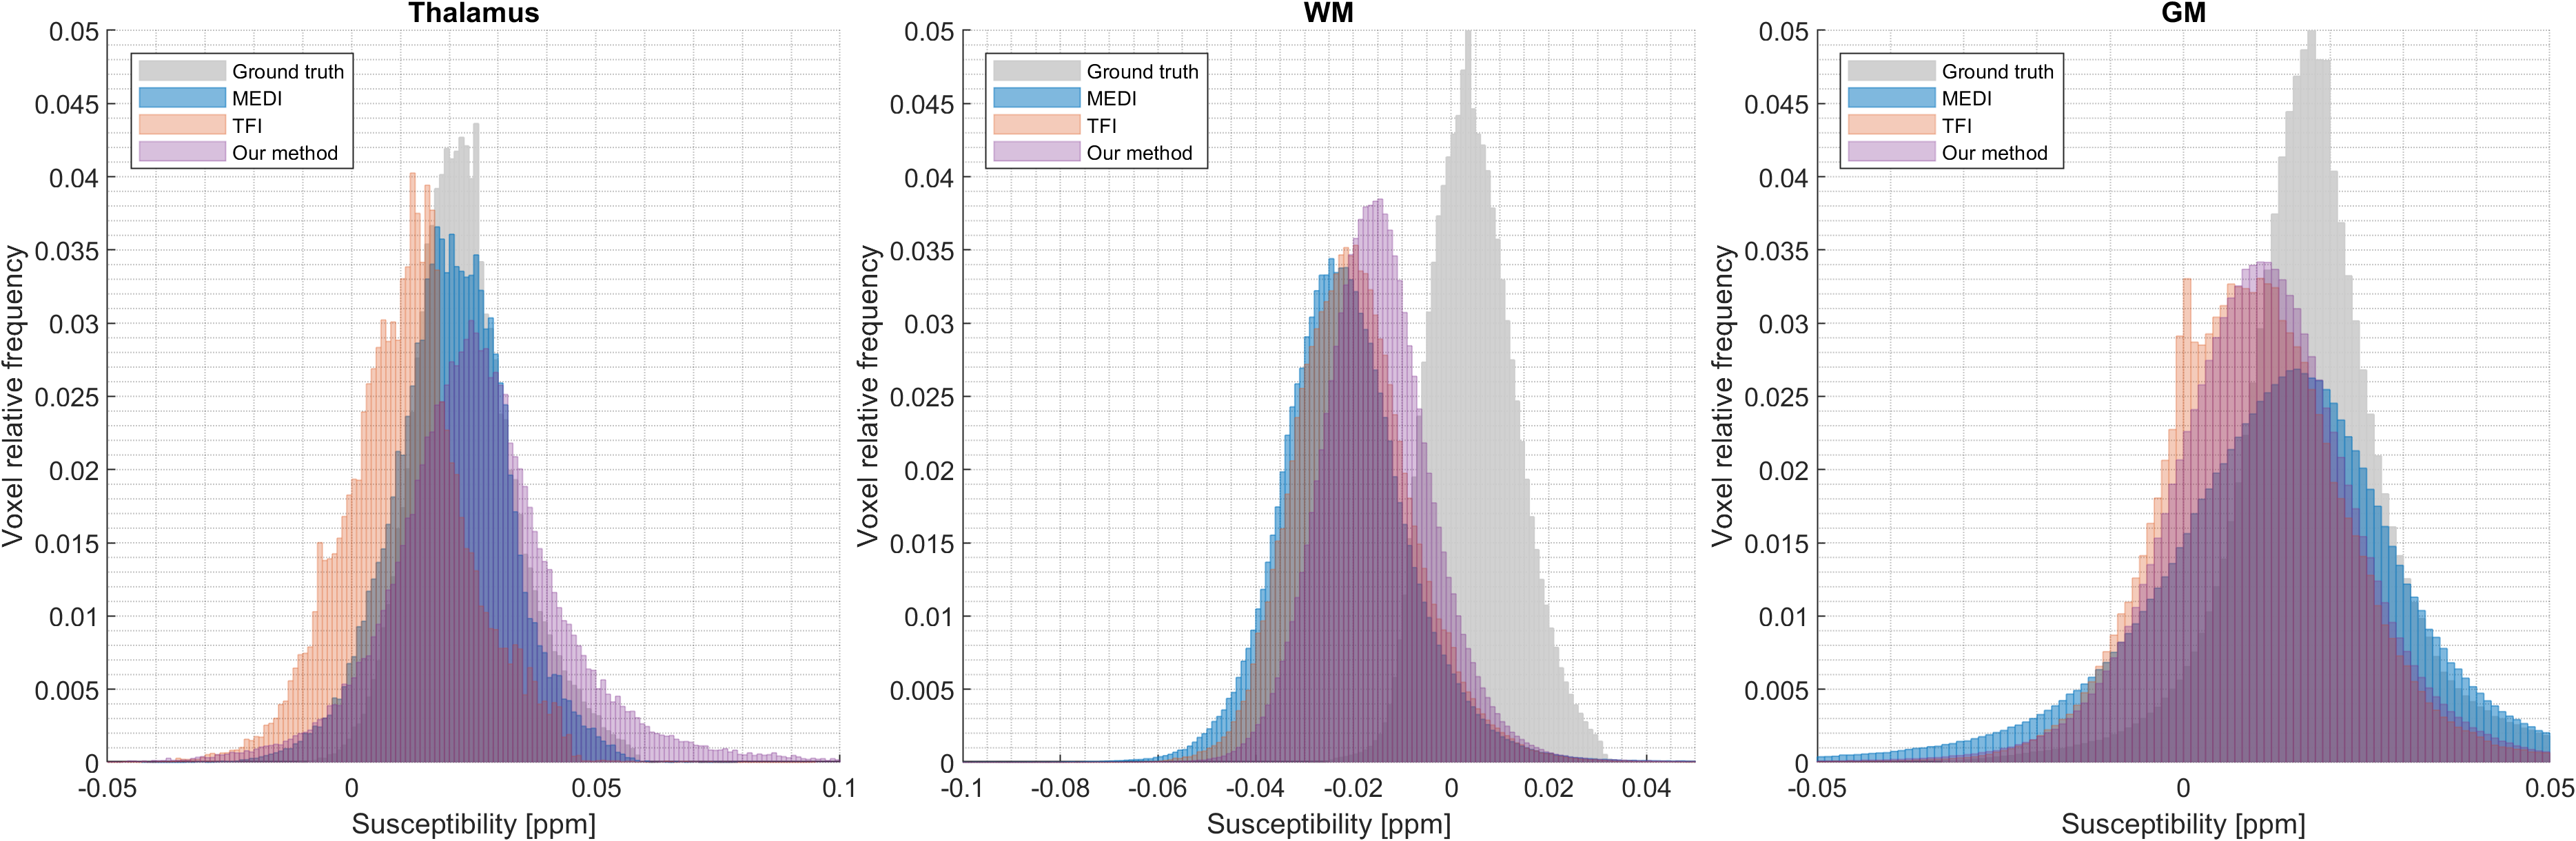
Figure 4: Susceptibility distributions comparing the results for the three methods in the thalamus, white matter (WM), and gray matter (GM) masks. Since the thalamus was also included in $$$M_{VF}$$$, it can be observed that our method overestimates the susceptibility values within this region when compared with other results. Our method is the best performing for WM, which is coherent with the RMSE values reported in Table 1. In the GM mask, our method is comparable with TFI.
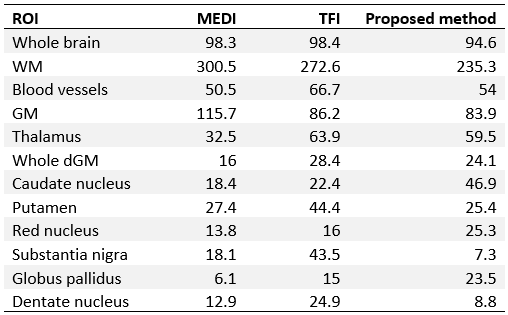
Table 1: Normalized RMSE (%) values for different ROIs. The ROIs were used directly from the segmented model offered as part of the numerical phantom. The “Whole dGM” ROI refers to a mask containing all the individual dGM structures combined.