3305
Validation of the Multicomponent Diffusion Analysis using L1-norm regularized NNLS for Ultra-high b-value Diffusion-weighted MRI protocols1Electrical and Computer Engineering, University of Illinois at Chicago, Chicago, IL, United States, 2Research Resources Center, University of Illinois at Chicago, Chicago, IL, United States, 3Biomedical Engineering, University of Illinois at Chicago, Chicago, IL, United States
Synopsis
Multiple components analysis as a convenient tool to model multiexponential relaxations has been well developed in the applications of T2-weighted MRI. Nevertheless, this analysis is rarely used in diffusion-weighted MRI data and the lack of systematic studies makes the situation worse. Building on our previous studies, to validate the performance of the analysis becomes critical to carry out the ultra-high b-value DWI technique in vivo or translate to the clinical applications. We, therefore, proposed this phantom study to validate the stability and robustness of the multiple components analysis applied in the ultra-high b-value DWI technique.
Introduction
Signal decomposition has been very well developed and been used in multiple fields. As the nuclear magnetic resonance (MR) relaxation data can be modeled as a multiexponential relaxation with a kernel of the exponential function [1], multiple components analysis has drawn a lot of attention in T2-weighted MRI, for example, the application in cartilage [2] and the myelin water imaging technique [3]. Compared to the explosive development of the multiple components analysis in T2-weighted MRI, rare diffusion-weighted MRI (DWI) techniques employ it as the analysis tool to extract the diffusion information. One of the major reasons could be the lack of studies to validate the performance of this method being used in DWI. In our previous ex vivo studies on degenerative spinal cord using ultra-high b-value DWI, we found that the wild type group and the diseased group can be distinguished (P = 0.0388) by the relatively small diffusion coefficients (Ds) range [4] and the L1-norm regularized NNLS algorithm used in the analysis provided even better results of separating the degeneration in ventral and dorsal roots [5]. To further validate the performance of the L1-norm regularized NNLS algorithm in the novel ultra-high b-value DWI technique, we, therefore, propose to study a phantom consisting of water and N-tridecane, 1-butanol and extra-virgin olive oil samples [6,7].Methods
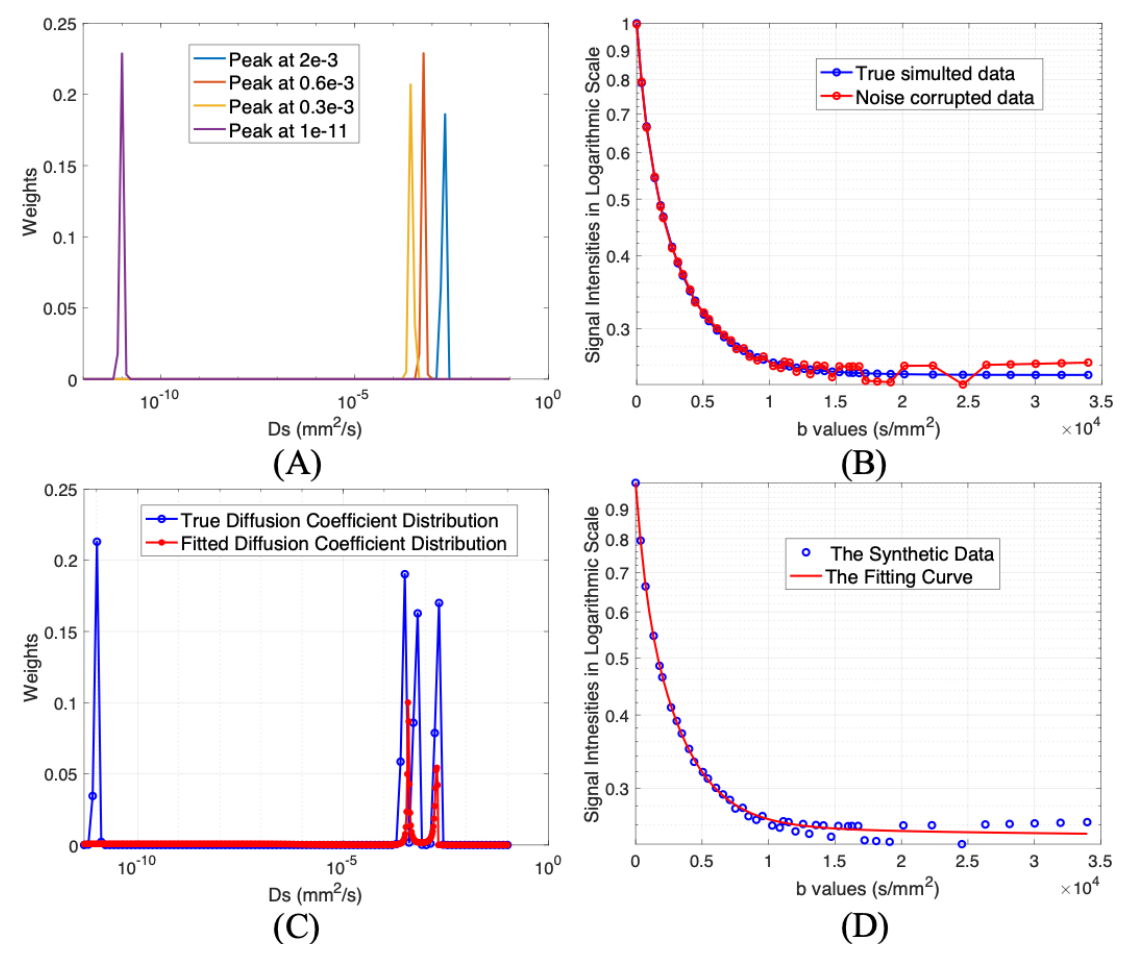
Each of the aforementioned substances was placed in a 1 ml syringe respectively. All MRI scans were performed on a 9.4T Agilent MRI scanner. A diffusion-weighted stimulated-echo sequence was used with thirty-seven b-values ranging from 0 to 3.4*10-4 s/mm2 with the following parameters: TR/TE = 2000/17.6 ms, mixing time = 108.83 ms, diffusion time = 120 ms, maximum diffusion strength = 25 Gauss/cm, diffusion gradient duration = 4 ms, slice thickness = 1 mm, field of view = 25.6 mm × 19.2 mm, matrix = 64 × 64. The diffusion gradient direction is oriented perpendicular to the long axis of the syringes. The bore temperature was measured at 18C to 20C. A simulated Ds distribution was created with four Gaussian peaks. The synthetic data from the simulated Ds distribution was corrupted with noise to ensure SNRs from 20 to 250. All data were analyzed using the L1-norm regularized NNLS algorithm [5] in MATLAB (MathWorks). The toolbox, CVX (version 2.2, CVX Research, Inc.), was used to solve the optimization problem.Results
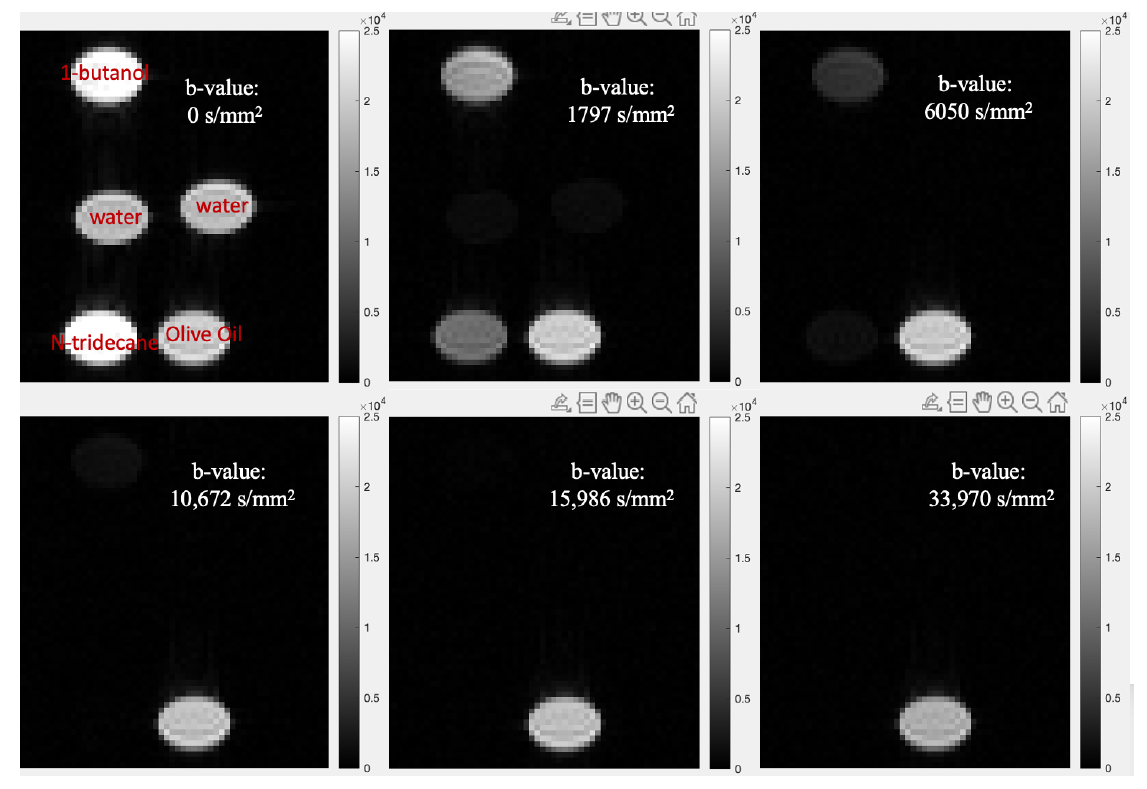
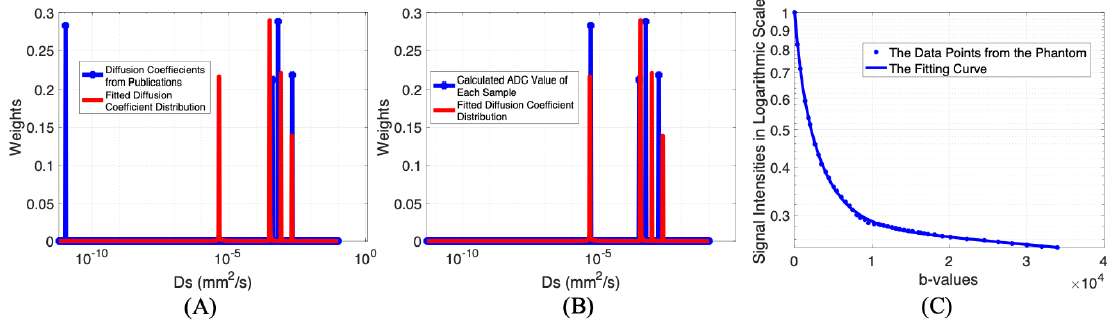
With the synthetic data, the results from the multicomponent analysis (α = 1.02 and γ=0.9 in the L1-norm regularization [5]) missed the olive oil peak at the far left area of the spectrum and also clustered the three peaks into two at the right region of the spectrum (Fig. 1C), even if the fitting curve depicts the synthetic data well (Fig. 1D).Six DW images of the phantom were provided in Fig. 2. as representatives. With the same color bar, signals from water, N-tridecane and 1-butanol vanished one after another. The olive oil signals persist strongly at 33,970 s/mm2 and the signal intensities didn’t drop too much with the b-values increasing. The results on the phantom from the multicomponent analysis (Fig. 2) with the same α and γ behaved much better. In both Fig. 3A and Fig. 3B, the peaks in red in the right region of the span only have minor shifts (x-axis) from the diffusion coefficients (Ds) of the left three peaks with slight variations in the weights (y-axis). The fitted far left peak (oil) in red overlapped with the corresponding calculated ADC peak with a slight shortage in weights (Fig. 3B). Nevertheless, the Ds of the olive oil in publication was at the much smaller region on the span (Fig. 3A).
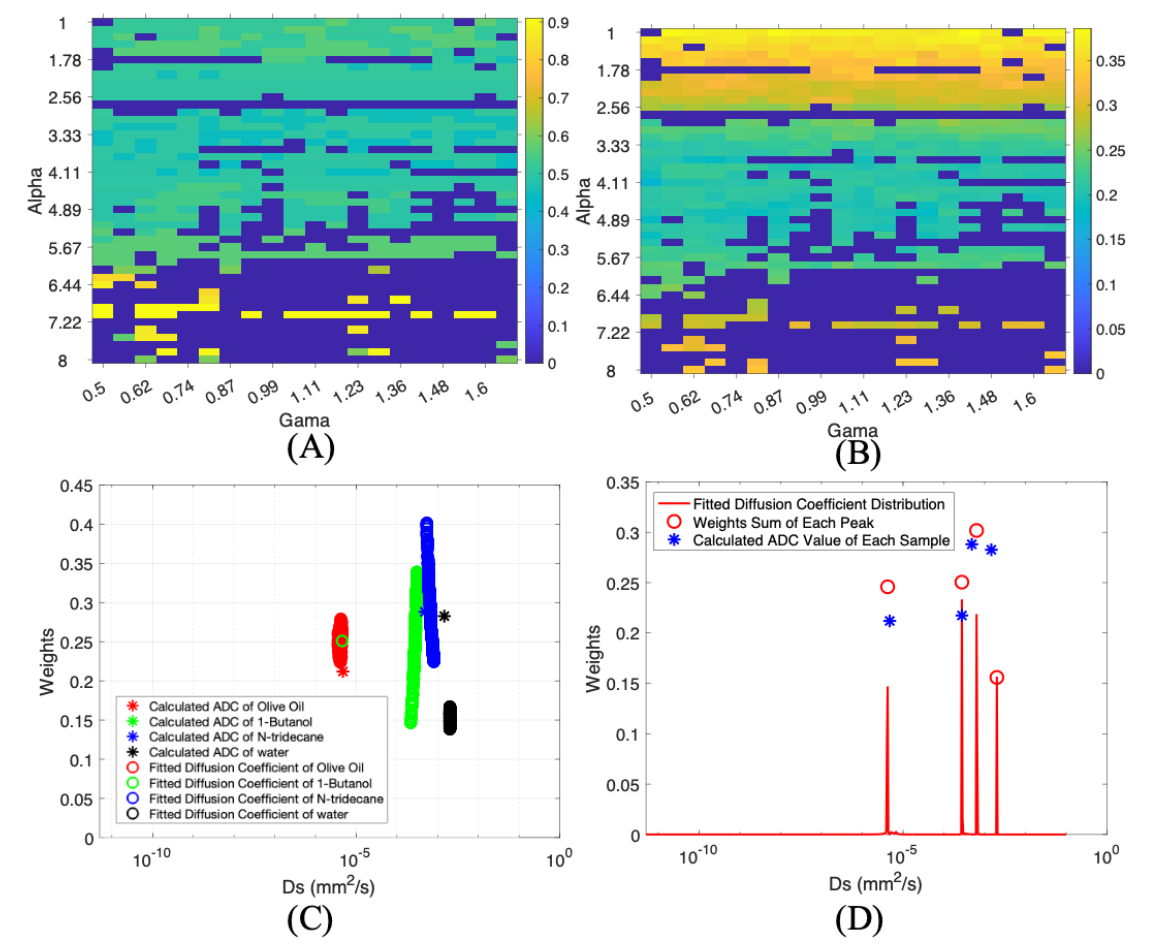
The multicomponent analysis was run with multiple α and γ on the phantom. Fig. 4A provides the fitting errors with the shift on the spectrum and Fig. 4B shows the errors with the weights of peaks. Except for the one outlier of the calculated sum of the 1-butanol peak, all other sums of each peak in each iteration with α and γ varying are robust and stable (Fig. 4C). The optimal results regarding this phantom are shown in Fig. 4D, with α=3.71 and γ=0.84.
Discussion
The missing oil peak and the clustering of Ds at the right region (Fig.1C) in simulation might be caused by the ultra-small diffusion components at 10-11 mm2/s in synthetic data with relatively low SNRs, as the b-values are considered small when compared to the ones used for oil application [7]. This was verified in the analysis of the phantom that both the calculated ADC and the oil peak from the fitted spectrum cannot achieve 10-11 mm2/s (Fig. 3AB). Although the fitting errors in both Ds shifts (Fig. 4A) and weights (Fig. 4B) seem relatively large when α<2.5 and α>6, the overall behaviors of the analysis with varying α and γ are stable and robust. The tendency on the peaks of 1-butanol and N-tridecane getting close might indicate the difficulties to depict significant changes of that range on Ds span [4] due to the various SNRs of different components in one voxel.Acknowledgements
No acknowledgement found.References
1. Whittall KP, MacKay AL. Quantitative interpretation of NMR relaxation data. Journal of Magnetic Resonance (1969) 1989;84:134-152.
2. Reiter DA, Lin P-C, Fishbein KW, Spencer RG. Multicomponent T2 relaxation analysis in cartilage. Magn Reson Med 2009;61:803-809.
3. Zhang J, Kolind SH, Laule C, MacKay AL. Comparison of myelin water fraction from multiecho T2 decay curve and steady-state methods. Magn Reson Med 2015;73:223-232.
4. Gao J, Jiang M, Magin RL, Gatto RG, Morfini G, Larson AC, et al. Multicomponent diffusion analysis reveals microstructural alterations in spinal cord of a mouse model of amyotrophic lateral sclerosis ex vivo. PLOS ONE 2020;15:e0231598.
5. Jin Gao WL, Richard Magin, and Danilo Erricolo. Multicomponent Diffusion Analysis using L1-norm Regularized NNLS for an Accurate and Robust Detection of Alternations in Spinal Cord. In: Proceedings of Proceedings of the 29th Annual Meeting of the ISMRM, virtual conference, 2021. (abstract p. 3440)
6. Tofts PS, Lloyd D, Clark CA, Barker GJ, Parker GJM, McConville P, et al. Test liquids for quantitative MRI measurements of self-diffusion coefficient in vivo. Magnetic Resonance in Medicine 2000;43:368-374.
7. Šmejkalová D, Piccolo A. High-power gradient diffusion NMR spectroscopy for the rapid assessment of extra-virgin olive oil adulteration. Food chemistry 2010;118:153-158.
Figures