3300
Daily Measurement of Prostate ADC in Patients Undergoing SABR and Conventional Treatment for Prostate Cancer on an MR-Linac1CMPE, The Christie NHS Foundation Trust, Manchester, United Kingdom, 2Radiotherapy Services, The Christie NHS Foundation Trust, Manchester, United Kingdom, 3Research and Development, The Christie NHS Foundation Trust, Manchester, United Kingdom, 4University of Manchester, Manchester, United Kingdom
Synopsis
MR-Linacs enable daily functional imaging to be performed in patients being treated with radiotherapy. In this work, the diffusion sequence developed by the MRL Consortium biomarkers working group underwent technical validation, showing accurate and repeatable phantom ADC measurements. Daily, whole-prostate ADC mapping was also performed in patients undergoing treatment for prostate cancer on an MRL. No significant differences were observed in whole-prostate ADC during the course of treatment for conventional and stereotactic ablative body radiotherapy (SABR) treatments. Absence of significant change in ADC could be related to the fact that patients were treated with neo-adjuvant hormone therapy prior to radiotherapy.
Introduction
The MR-Linac (MRL) is the next step in image guided radiotherapy, allowing daily anatomical and functional imaging [1]. Prostate apparent diffusion coefficient (ADC) has been shown to act as a biomarker for radiotherapy treatment effectiveness when measured at treatment follow-up [2], but it is not regularly measured during treatment. If prostate ADC can be measured during treatment then it may be possible to predict the effectiveness of treatment and potentially adapt plans or boost intra-prostatic lesions based on functional information [3].At our institution, MR-Linac prostate treatments are delivered either with 60 Gy in 20 fractions (conventional treatment) or as 36.25 Gy in 5 fractions (SABR treatment). This work set out to compare ADC changes between conventional and SABR treatments.
Methods
The Elekta MRL Biomarkers working group diffusion-weighted imaging (DWI) sequence (single shot EPI, b = 0, 150, 500 s/mm2, TE/TR = 65/2931 ms, voxel size = 1.9 mm x 1.9 mm x 4 mm) [4] was tested for accuracy and repeatability over 6 monthly QA sessions using the quantitative imaging biomarkers alliance (QIBA) diffusion phantom [5].The sequence was run on five patients undergoing conventional treatment and four patients undergoing SABR treatment recruited under the MOMENTUM study [6]. The purpose of the DWI imaging was explained to patients who then provided written consent to undergo imaging for research purposes following their daily treatment. At each treatment, patients had the opportunity to opt out of this additional imaging: after acquiring clinical T2-weighted images and delivering treatment, verbal agreement was sought from patients before proceeding with the DWI scan.
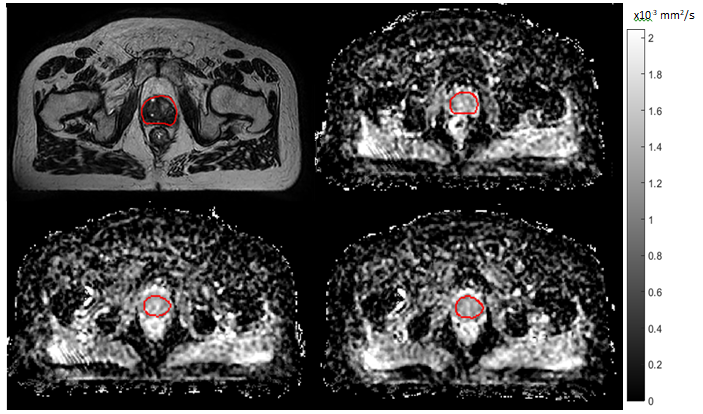
Treatment contours defined on the pre-treatment T2 weighted anatomical planning scans were rigidly registered to the daily T2 weighted images and the ROIs were deformed across in the Monaco treatment planning system [7]. These were then rigidly registered and copied across to the daily DWI weighted b = 0 images. ADC maps were generated from b = 150, 500 s/mm2 images, and median values were extracted from whole prostate regions of interest (ROIs), obtained by eroding the registered treatment contours by 2 voxels to ensure surrounding tissue was not included in the ROI (fig. 1).
ADC maps were generated from b = 150, 500 s/mm2 images, and median values were extracted from whole prostate regions of interest (ROIs), obtained by eroding the registered treatment contours by 2 voxels to ensure surrounding tissue was not included in the ROI (fig. 1).
A 2-sided, paired t-test was used to determine if there were any significant changes in ADC between the start and end of treatment for either conventional and SABR treatments with significance defined as p < 0.05 to reject the null hypothesis.
Results
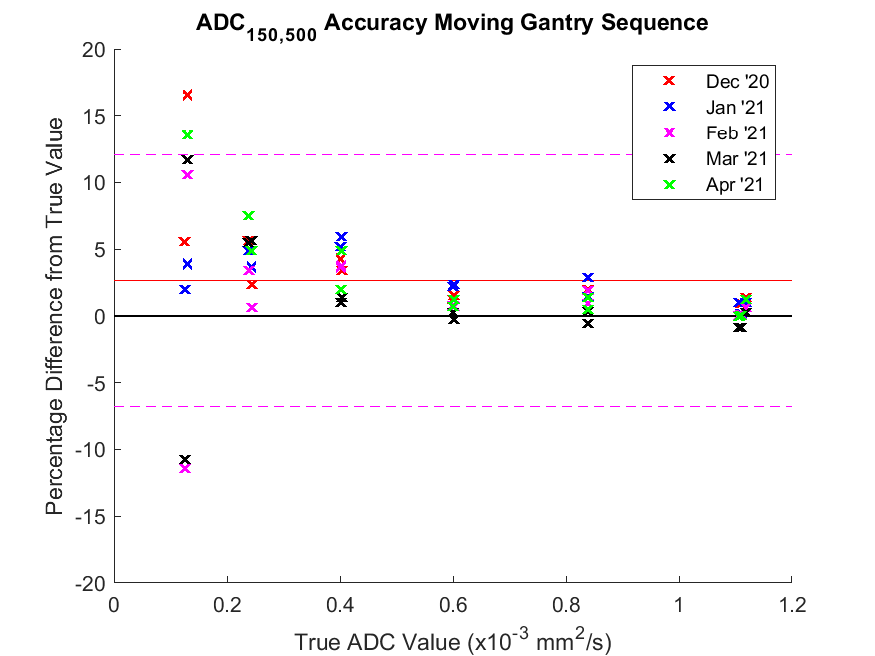
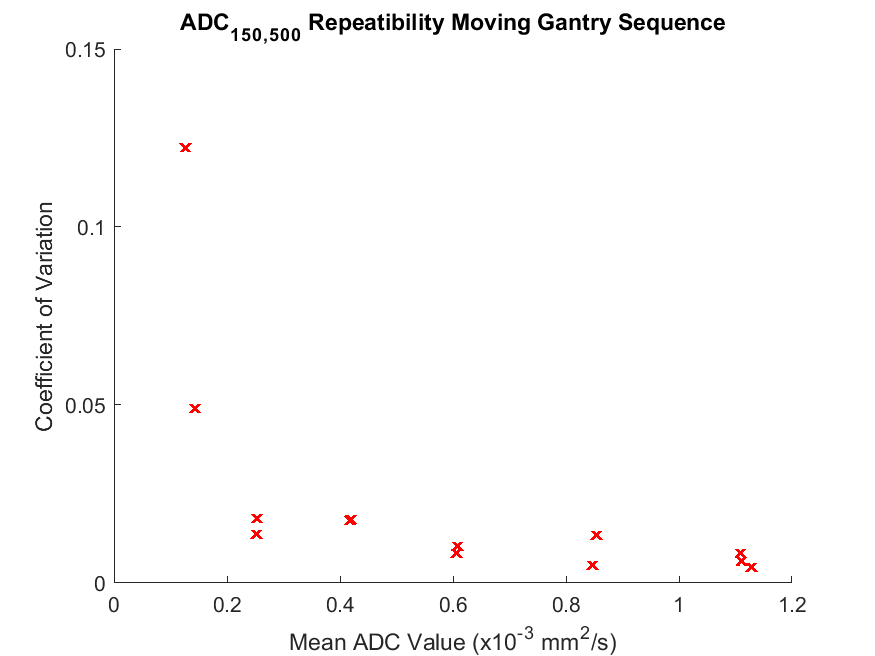
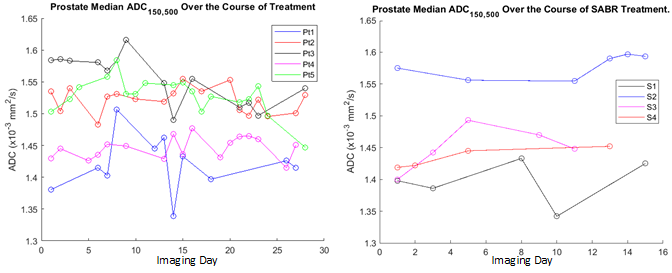
ADC measurements using b = 150 and 500 s/mm2 images were found to be highly accurate (mean % difference < 2.7%) and repeatable (coefficient of variation < 2.0 %, Fig. 3) in the expected clinical range of ADC (ADC > 0.6 x10⁻³ mm2/s), accuracy and repeatability are poorer at lower ADC.There was no significant change between the start and end of treatment for either the conventional treatment (p = 0.81) or the SABR treatment (p = 0.14).
Furthermore, images were suboptimal and it was head to distinguish tumours from healthy prostate tissue in the DWI images and ADC maps.
Discussion
There were no significant changes in whole prostate ADC between the start and end of treatment. This study was limited by the low numbers of patients and the fact that patients underwent neo-adjuvant hormone therapy in addition to their radiotherapy treatment. This neo-adjuvant therapy has been shown to reduce the changes in prostate ADC caused by radiotherapy [8]. Additionally, we were only able to assess the whole prostate, rather than having an individual region of interest for the tumour; this is due to the fact that in the current workflow, the dose is prescribed to the whole prostate.This study did however show that daily DWI measurements on the MRL are feasible and produce accurate and repeatable results in phantoms.
Further optimisation of image resolution and contrast is needed to help distinguish tumour from prostate tissue. Further work is planned to improve the imaging sequence and collect data from a greater number of patients.
Conclusion
Daily DWI imaging is feasible on the MRL using the Elekta biomarkers working group DWI sequence, which produces accurate and repeatable ADC measurements in phantoms.There was no significant difference in prostate ADC between the start of treatment and immediately after the end of treatment for either conventional or SABR treatments.
Acknowledgements
No acknowledgement found.References
| [1] | T. R, “MRI Commisioning of 1.5 T MR-Linac Systems - A Multi-Institutional Study,” Radiotherapy Oncology, vol. 132, pp. 114-120, 2019. |
| [2] | X. Wu, “Diffusion-Weighted MRI Provides a Useful Biomarker for Evaluation of Radiotherapy Efficacy in Patients with Prostate Cancer,” Anticancer Research, vol. 37, no. 9, pp. 5027-5032, 2017. |
| [3] | L. Kerkmeijer and V. Groen, “Focal Boost to the Intraprostatic Tumour in External Beam Radiotherapy for Patients with Localised Prostate Cancer: Results from the FLAME Randomized Phase III Trial,” Journal of Clinucal Oncology, vol. 39, pp. 787-796, 2021. |
| [4] | E. Kooreman, “ADC Measurements on the Unity MR-Linac - A recommendation on behalf of the Elekta Unity MR-Linac Consortium,” Radiotherapya nd Oncology, vol. 153, pp. 106-113, 2020. |
| [5] | K. Keenan, “Recommendations Towards Standards for Quantitative MRI (qMRI) and Outstanding Needs: Recommendations for qMRI Standards,” Journal of Magnetic Resonance Imaging, vol. 49, no. 7, 2019. |
| [6] | S. de Mol van Otterloo, “The MOMENTUM Study: An International Registy for the Evidence-Based Introduction of MR-Guided Adaptive Therapy,” Front. Oncol., 2020. |
| [7] | Elekta, “Monaco Treatment Planning System v5.40.01,” 2019. |
| [8] | A. McPartlin, “Changes in Prostate Apparent Diffusion Coefficient Values During Radiotherapy After Neoadjuvant Hormones,” Therapeutic Advances in Urology, vol. 10, no. 12, pp. 359-364, 2018. |
Figures