3297
Automated Calculation of Optimum z-Shim Gradient Pulses from a Reference Acquisition for Spinal Cord fMRI1Department of Systems Neuroscience, University Medical Center Hamburg-Eppendorf, Hamburg, Germany
Synopsis
Slice-specific z-shimming reduces signal losses caused by through-slice dephasing in spinal cord fMRI acquisitions. Typically, the optimum values are determined from a reference acquisition covering a range of z-shim values by a user who identifies the setting with the least signal loss. However, this procedure requires some experience, is time-consuming, and user-dependent. Here, an automated calculation of the optimum values has been developed, implemented on the MR system, and evaluated in phantoms and in vivo. Without compromising the image quality, the approach is faster and user-independent and, thus, may help to facilitate the application of z-shimming in spinal cord fMRI.
Introduction and Motivation
The spinal cord performs processing of sensory input to and motor output from the central nervous system and has also been shown to play an important role in pain processing, for instance in placebo analgesia1. However, echo-planar imaging (EPI), the standard technique for BOLD-based functional MRI (fMRI) suffers from through-slice dephasing caused by the field inhomogeneities in the spinal cord. Z-shimming2,3 with a single, slice specific compensation gradient pulse, has been shown to reduce these signal losses (see Figure 1). In practice, the optimum z-shim gradient pulse for each slice is usually determined from a reference acquisition covering typical z-shim gradient settings for each slice by the user which not only requires some experience to identify the z-shim settings with the least signal losses but also is time consuming and may be user-dependent. In this study, an algorithm for the automated determination of optimum z-shim gradients that runs on the MR console computer to avoid extra time for data transfer, has been developed, implemented, and tested. It simplifies and speeds up the z-shimming procedure and is user-independent, and, thus, may help to facilitate the application of z-shimming in spinal cord fMRI.Method
Experiments were performed on a 3T whole-body MR system (PrismaFit, Siemens Healthineers) using a 64-channel head-neck coil. A phantom consisting of two 0.5l milk cartons with a gap of 1.6cm in-between and healthy volunteers were investigated after their informed consent was obtained. EPI acquisitions covering 16 slices were performed using a square FOV of 132mm, an in-plane resolution of 1.2x1.2mm2, and a slice thickness of 5mm without a gap. The images were acquired with a TE of 24ms and a TR of 2000ms. The z-shim reference acquisition covered 21 equidistant steps compensating field gradients between ±0.2mT/m for each slice; only the optimum z-shim gradient pulse is then applied during the subsequent fMRI acquisitions (cf. Figure 2).Figure 3 shows the workflow of the user-based (blue) and automated (orange) approaches. In the user-based approach, the user is checking all images of the z-shim reference acquisition to identify the setting with the largest signal intensity for each slice. The corresponding values are then entered into the user interface of the pulse sequence.
The automated method involves the definition of a mask covering the spinal cord voxels in each slice which was realized by multiple steps involving the analysis of pixel intensities, edge detection, and region grow algorithms. First, the maximum intensity projection (MIP) from all z-shim reference images was calculated for each slice to obtain images with a high signal amplitude in all spinal cord voxels. Then, a single intensity histogram of the central region of all slices was calculated (white curve) and smoothed (red curve). Voxels with intensities below a certain threshold were discarded because they do not represent spinal cord voxels; this threshold was defined dynamically based on the first local maximum beyond an intensity of 160 and including a range down to 40 below the local maximum’s intensity (both are empirical values determined from data of six volunteers obtained with the used acquisition protocol). Next, an intensity-threshold region grow algorithm seeded in the spinal cord was used to suppress voxels outside of the spinal cord and CSF regions; the seed voxel was determined from the center of a circle with a diameter of 10mm for which the mean intensity was a maximum which means that most of the spinal cord and CSF voxels are located within the circle. To separate CSF from spinal cord voxels, edge detection was applied in combination with another region grow step to obtain the final spinal cord mask. To obtain the optimum z-shim value, the signal amplitude as a function of the z-shim gradient of the reference acquisition was fitted with a sinc-function, the theoretical signal curve for linear field inhomogeneities, for each voxel. The position of the sinc’s maximum was then taken as the optimum z-shim value (voxels with excessive fit error were discarded). Compared to simply picking the z-shim value with the highest signal intensities, this fit approach can be expected to be less prone to physiological signal fluctuations. Because the observed curves do not match a perfect sinc, in particular often do not show nulls, only the upper half of the sinc-curve was fitted. The z-shim values were averaged over all valid voxels of the mask and rounded to the units used by the pulse sequence and written to a file read by the pulse sequence.
Results and Discussion
Results of the phantom experiments are presented in Figure 4 and show that both, user-based and automated approach, yield similar results in terms of z-shim values as well as signal intensity and image quality for the corresponding optimum values. Figure 5 summarizes in vivo experiments for two of the volunteers. The improvement achieved with z-shimming is clearly visible while user-based and automated approach again show a very similar performance in compensating through-slice dephasing.However, the user-based approach is more time consuming, may be user-dependent, and yield non-optimal results if less experienced users are involved while the automated approach is user-independent and faster and could make z-shimming of spinal cord fMRI easier and more reliable.
Acknowledgements
This research was supported by the German Reseach Foundation DFG (SFB936/A6)References
1. Eippert F, Finsterbusch J, Bingel U, Büchel C. Direct Evidence for Spinal Cord Involvement in Placebo Analgesia. Science. 2009; 326: 404
2. Constable R.T, Functional MRI using gradient-echo echo-planar imaging in the presence of large static field inhomogeneities. J. Magn. Reason. Imaging. 1995; 5: 746-752
3. Finsterbusch J, Eippert F, Büchel C. Single, slice-specific z-shim gradient pulses improve T2*-weighted imaging of the spinal cord. Neuroimage. 2012; 59(3): 2307-2315
Figures
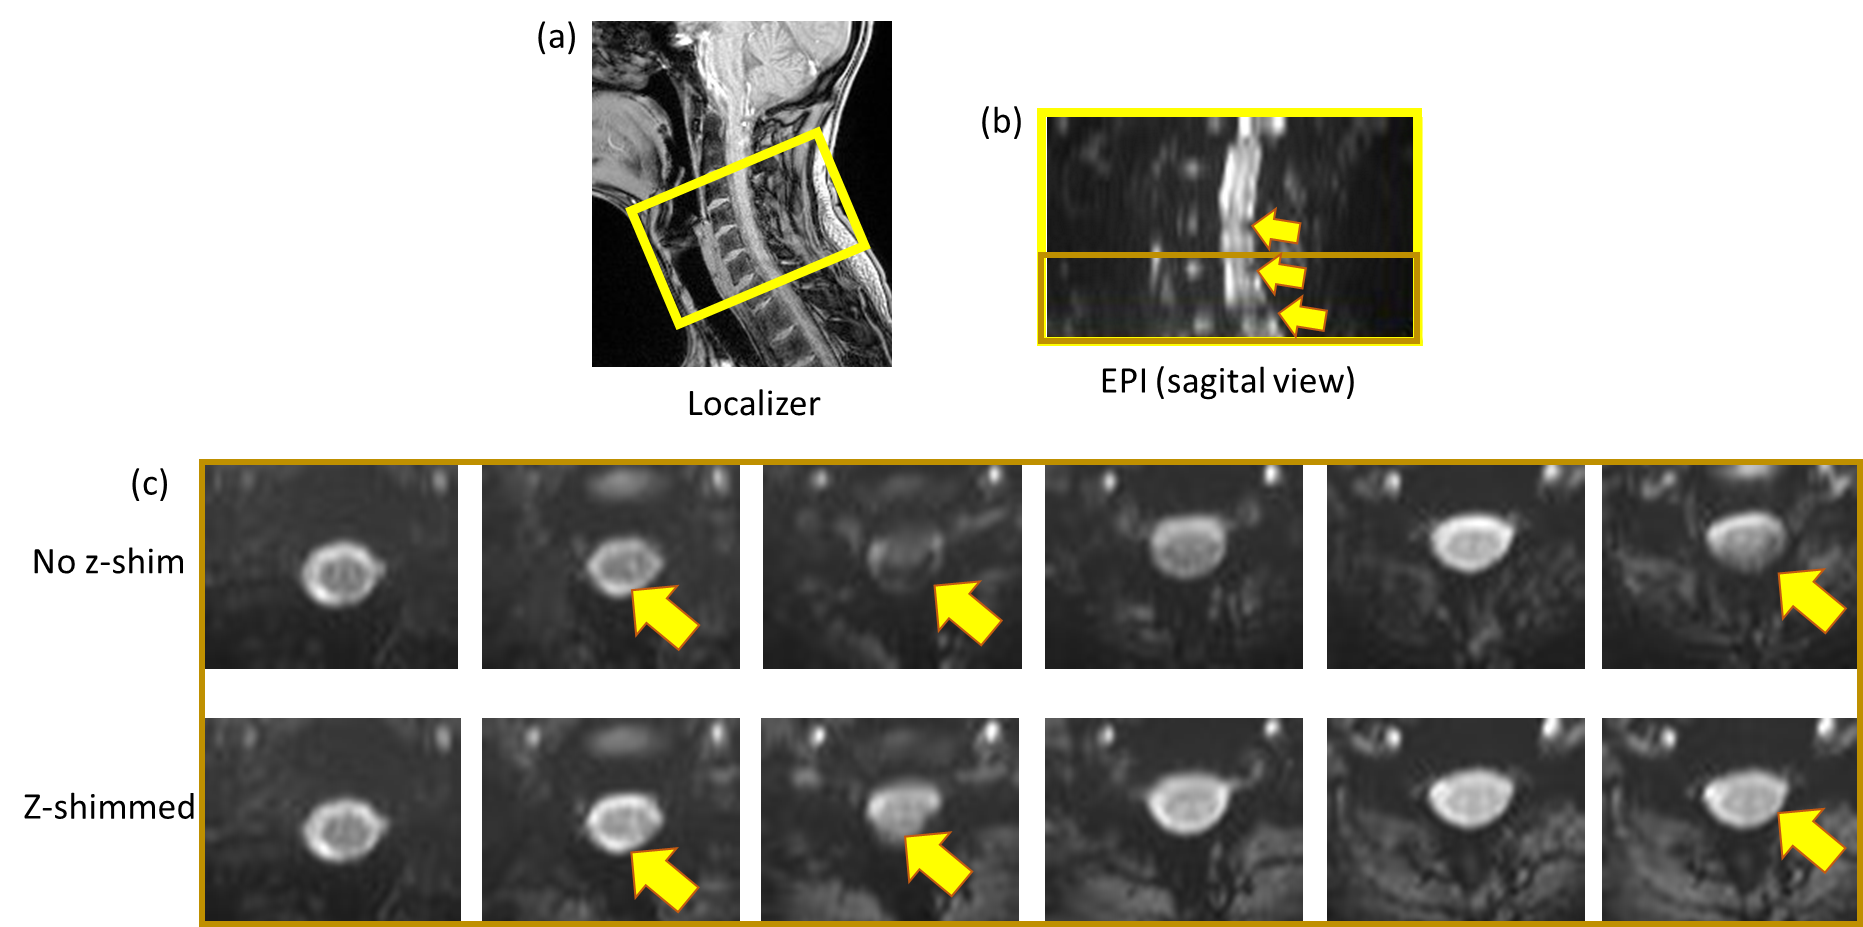
Figure 1: Localizer image (a) showing the location (16 slices) of spinal cord (C3, C4, C5, C6 and part of C7) measured for this experiment. (b) EPI images with sagital view. Signal dropouts can be seen. (c) EPI images (last 6 slices) with transversal view for both no z-shim and z-shimmed.
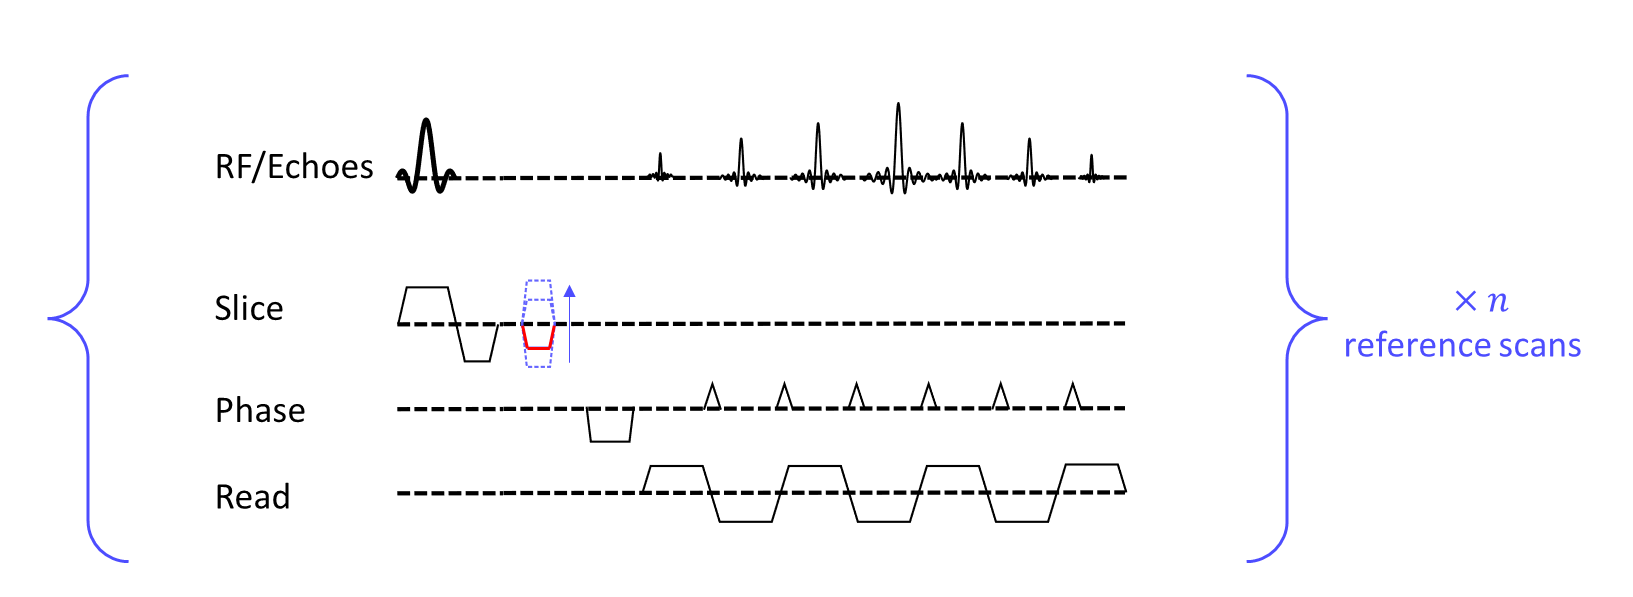
Figure 2: A sequence of EPI with gradient z-shim. A z-shim gradient pulse is activated in the slice selection direction in between the RF pulse and readout period. Different z-shim moments (dashed blue lines) were used for reference scans. The reference scan with the highest intensity (example shown in red) should be used in subsequent scans.
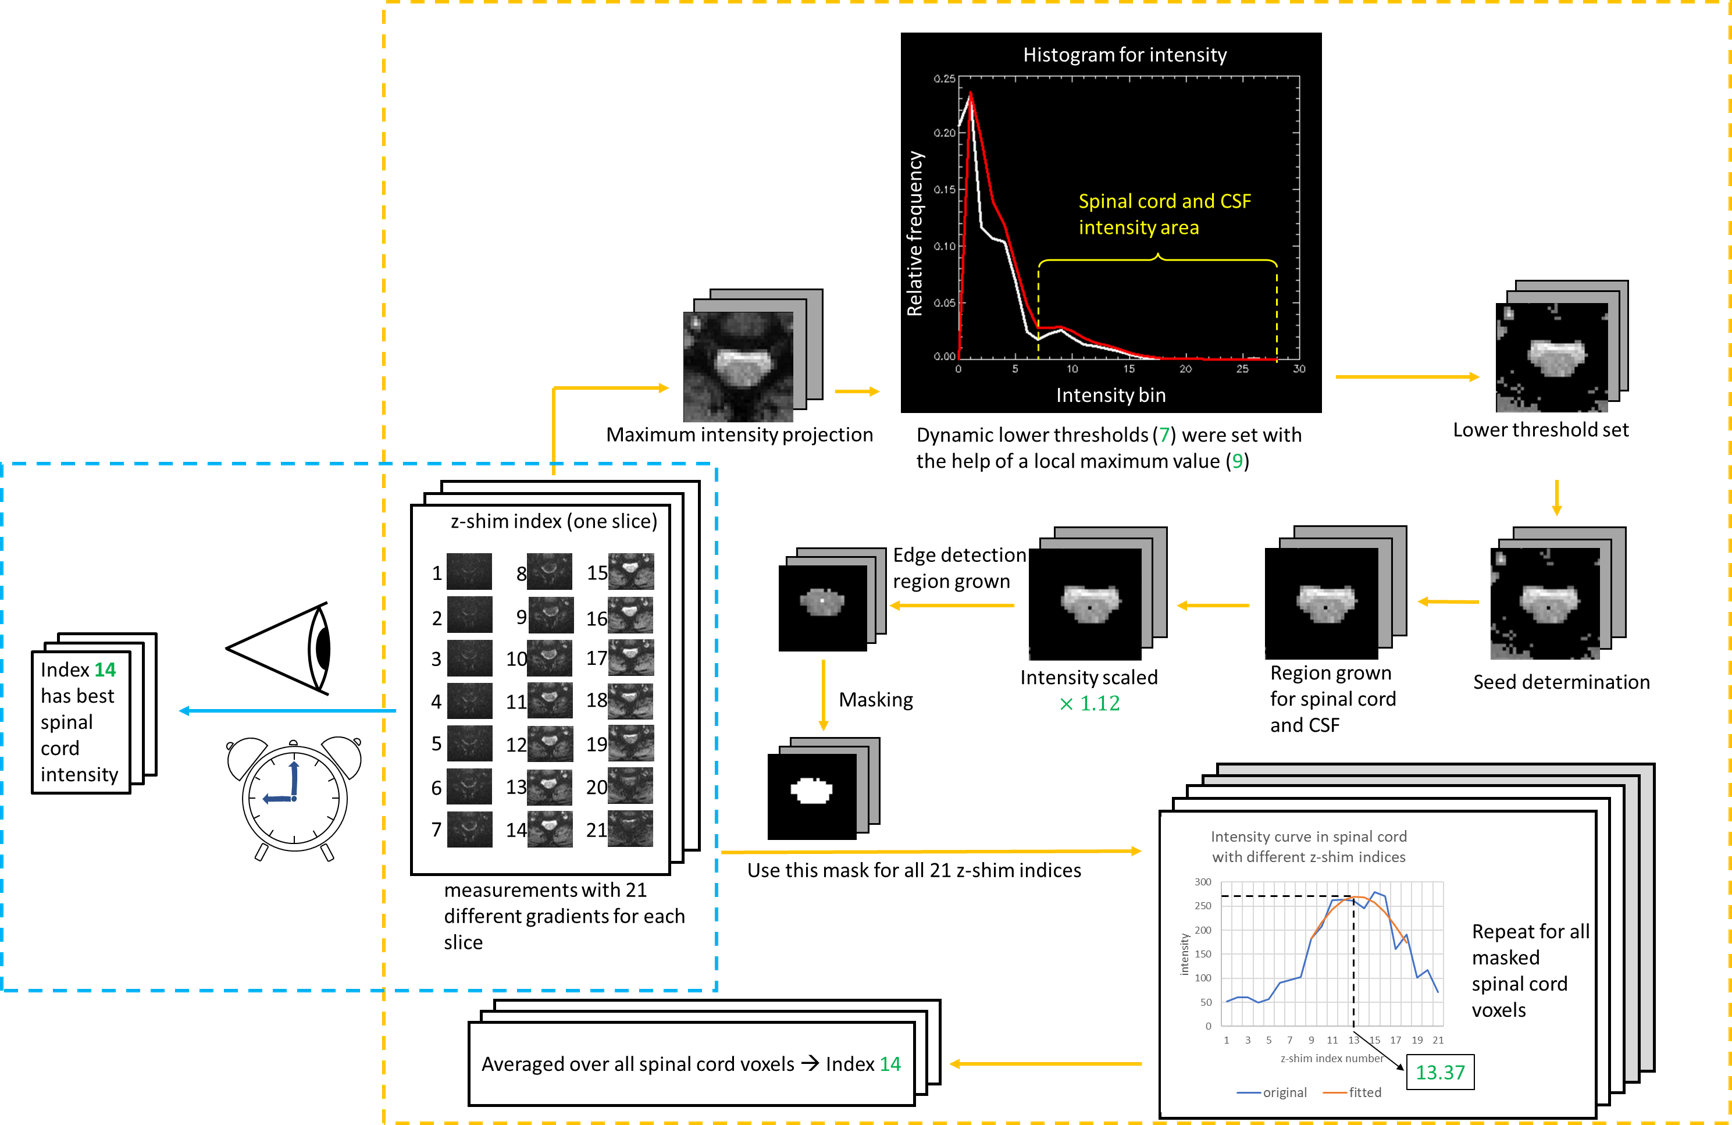
Figure 3: Workflow example for both manual and automated z-shim methods. Both methods start with the measurements with 21 z-shim indices. Steps within the blue box are manual z-shim steps and steps within the orange box are automated z-shim steps. To improve clarity, only 2D mask definitions are shown. Numbers in green vary for each slice.
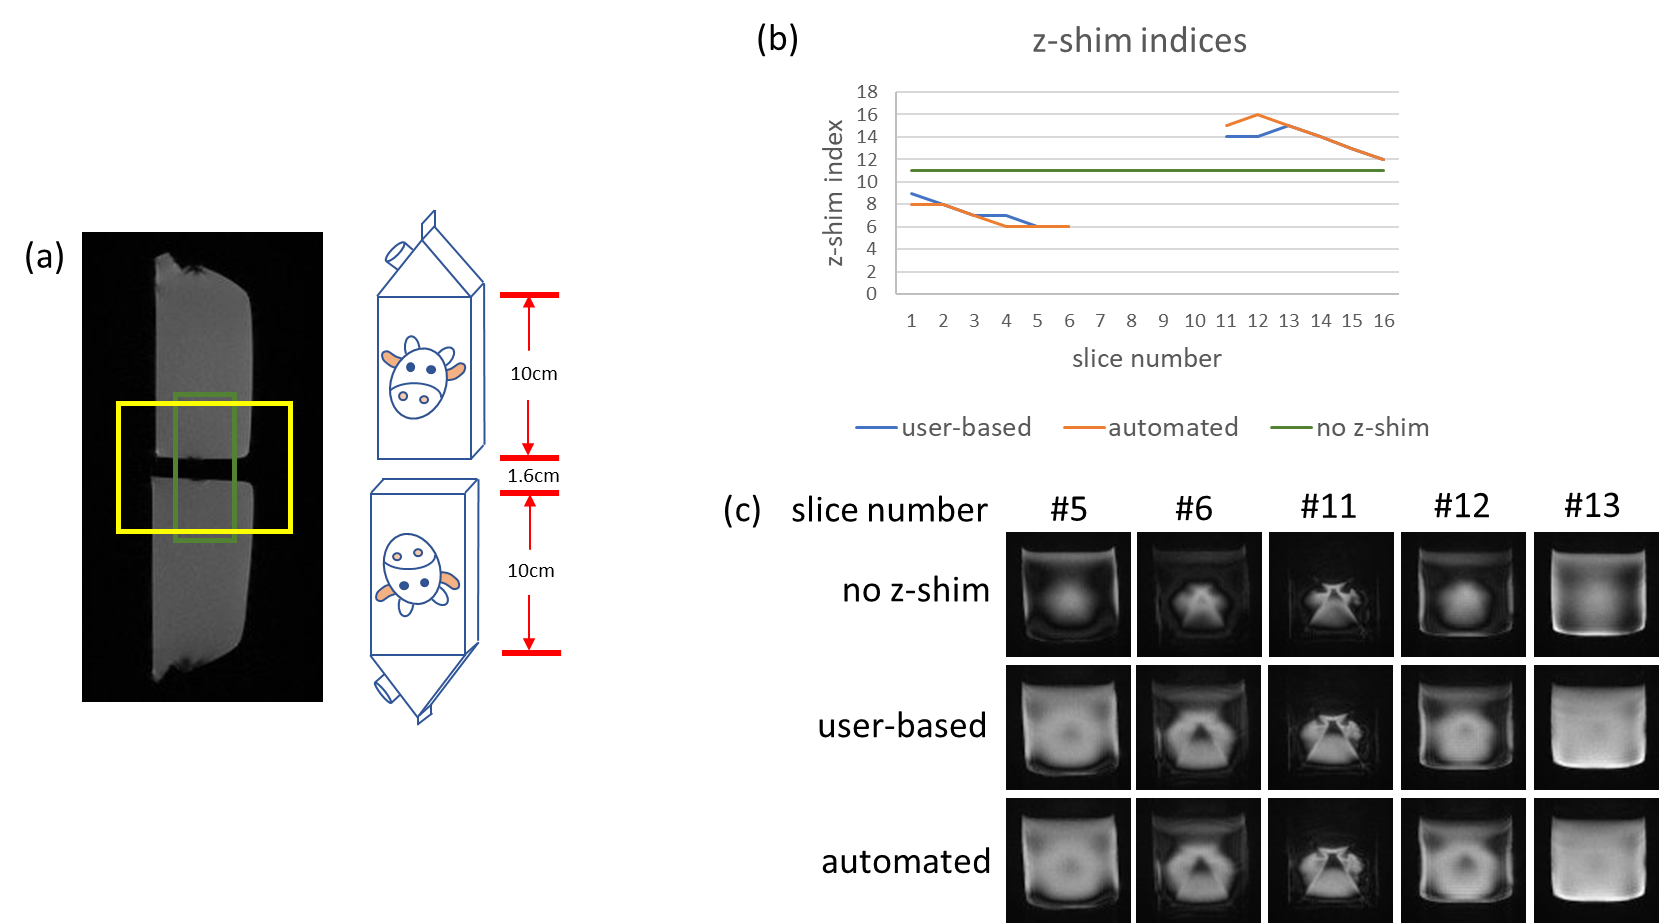
Figure 4: (a) Localizer of the phantom experiment. Two 0.5l milk cartons with a gap of 1.6 cm in-between. (b) Comparison of chosen z-shim indices from user-based and automated method. (c) Transversal slices near the gap with no z-shim, user-based and automated z-shim.
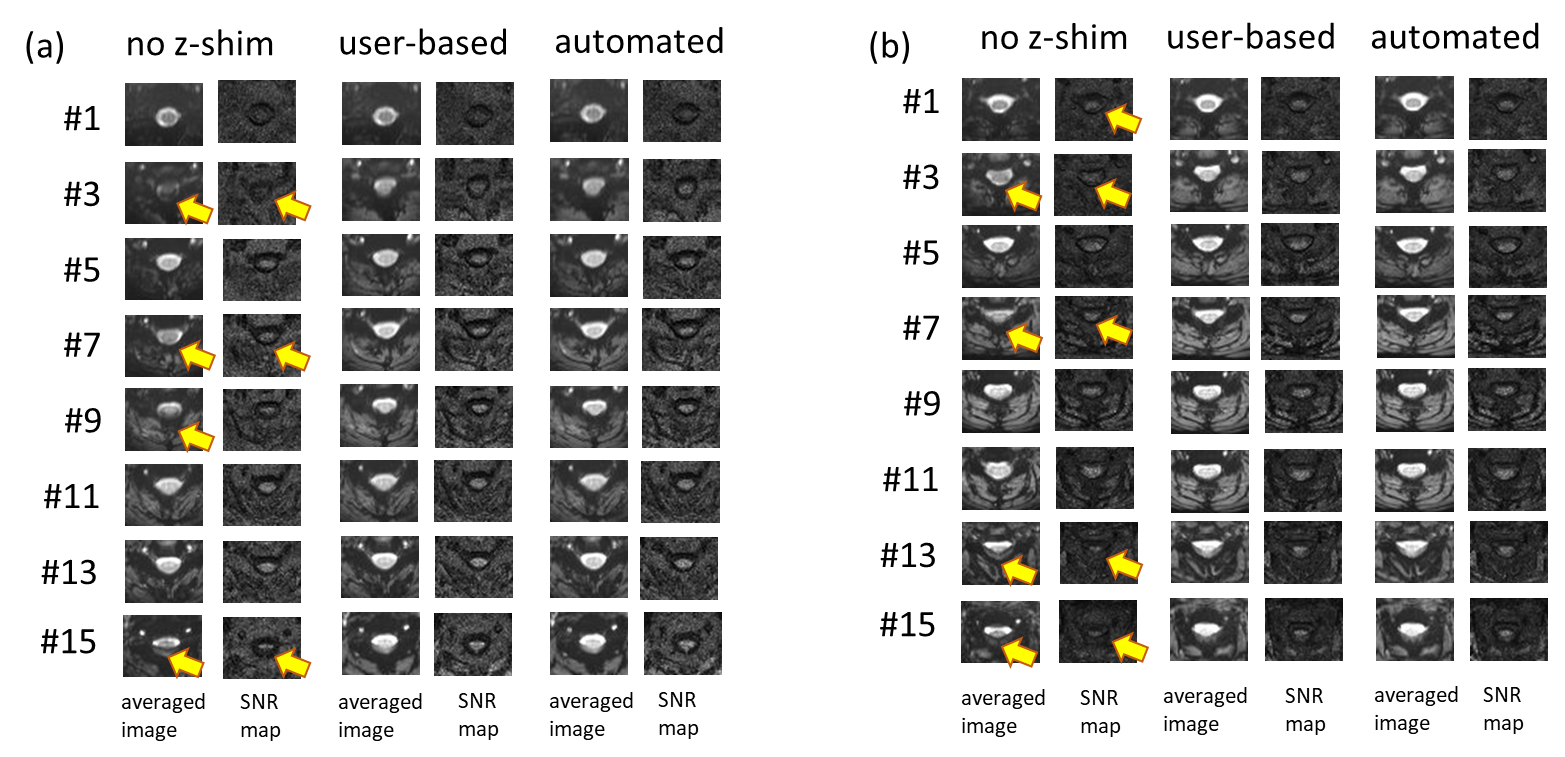
Figure 5: EPI averaged image calculated from 20 successive measurements and temporal SNR maps for 8 out of 16 slices for two (a and b) volunteers. Without z-shim, the signal dropouts are clearly visible in several slices (yellow arrows). Both user-based and automated z-shim methods from this study can compensate for this problem.