3293
Phenotypic associations of magnetic susceptibility in the brain1Wellcome Centre for Integrative Neuroimaging, FMRIB, Nuffield Department of Clinical Neurosciences, University of Oxford, Oxford, United Kingdom, 2Oxford Parkinson’s Disease Centre, University of Oxford, Oxford, United Kingdom, 3Donders Institute for Brain, Cognition and Behaviour, Radboud University, Nijmegen, Netherlands, 4Sir Peter Mansfield Imaging Centre, School of Physics and Astronomy, University of Nottingham, Nottingham, United Kingdom, 5Department of Biomedical and Neuromotor Sciences, University of Bologna, Bologna, Italy, 6Department of Statistics and Actuarial Science, Simon Fraser University, Vancouver, BC, Canada
Synopsis
In this abstract, we describe our findings from the phenotypic association analyses (univariate Pearson correlations) between 17,485 non-imaging phenotypes and QSM (and T2*) measures using data from 35,885 subjects in UK Biobank. In total, we identify statistically-significant associations of 251 phenotypes with QSM IDPs. Here we describe example associations in blood assays, health outcomes, food and drink, and alcohol consumption categories in detail. Our results demonstrate that QSM and T2* contribute complementary information. This new QSM resource provides an opportunity to investigate susceptibility contrast in previously unexplored territory, which might lead to advances in application of QSM in neuroscience.
Introduction
The brain imaging component of UK Biobank (UKB) aims to scan 100,000 participants using multi-modal MRI1,2. Participants have been deeply phenotyped and genotyped, and consent to long-term access to their health records1. We have previously described our work on developing a quantitative susceptibility mapping (QSM) pipeline for the susceptibility-weighted MRI data in UKB, and the subsequent genetic associations with magnetic susceptibility (χ) measures (referred to as imaging-derived-phenotypes, IDPs)3. In this abstract, we extend this work to describe our findings from the phenotypic univariate association analyses between a broad range of UKB non-imaging phenotypes and QSM (and T2*) IDPs.Methods
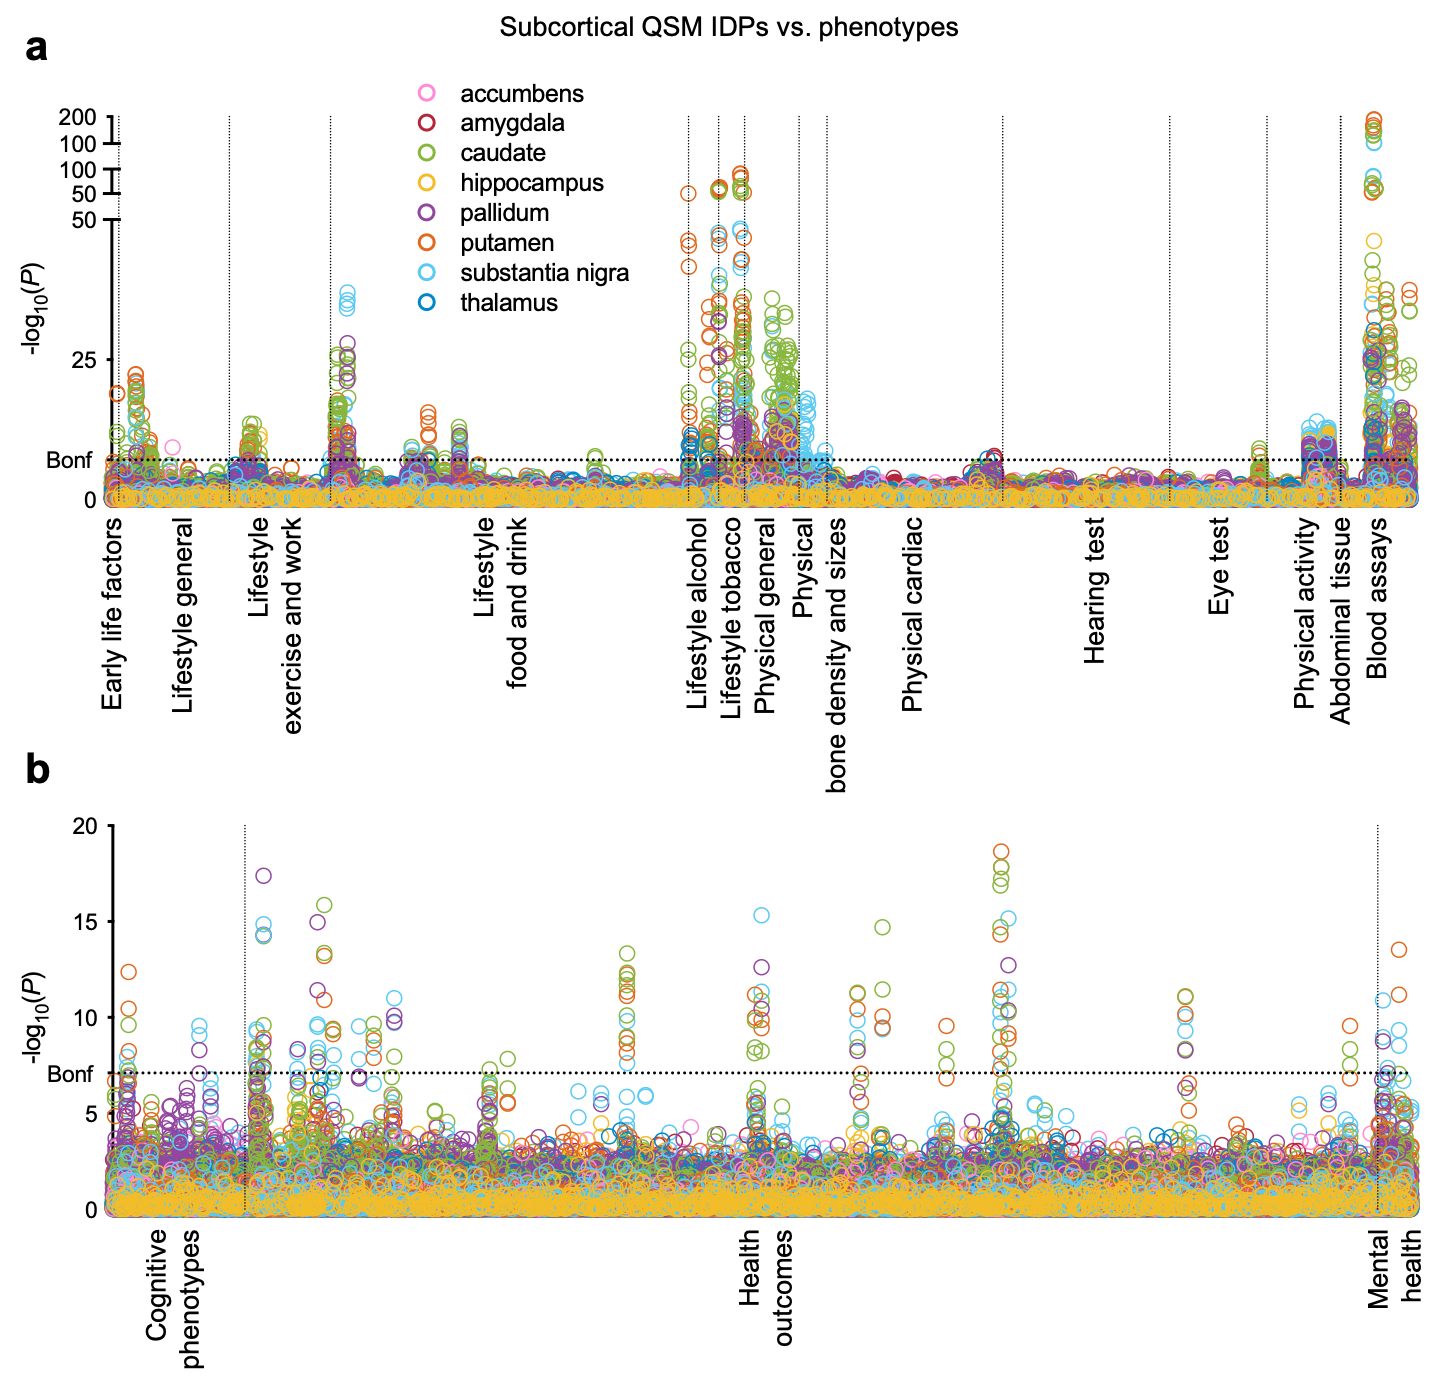
Susceptibility-weighted MRI (gradient echo) data from the current data release of 35,885 UKB subjects (53.11% female), aged 45-82y (mean=64.04y, SD=7.5y) at time of imaging, were processed using our QSM pipeline3. Median χ (referenced to CSF) and T2* were extracted from 8 subcortical structures (Fig. 1), and χ/T2* of white matter hyperintensities (WMH) relative to normal-appearing white matter was measured.To perform the phenotypic analysis, we carried out univariate (pairwise) association analyses between 17,485 UKB non-imaging phenotypes and QSM/T2* IDPs (Fig. 1,2), where Pearson correlation r and P values were calculated. Here we refer to all non-imaging phenotypes as “phenotypes”, to distinguish them from IDPs. Phenotypes are grouped into 17 categories including early life factors (e.g., birth weight), lifestyle (e.g., diet, alcohol consumption), physical/body measures (e.g., BMI, blood assays), cognitive test scores (e.g., numeric memory), health outcomes (e.g., clinical diagnosis) and mental health variables (e.g., major depression).
P values were used to identify the strongest associations, with correlation r value serving as a measure of effect size. The full set of correlations was corrected for multiple comparisons using Bonferroni correction (-log10Puncorrected>7.10). Phenotypes identified to have a significant association with QSM IDPs were further investigated using voxel-wise (univariate Pearson) correlation maps.
Results and Discussion
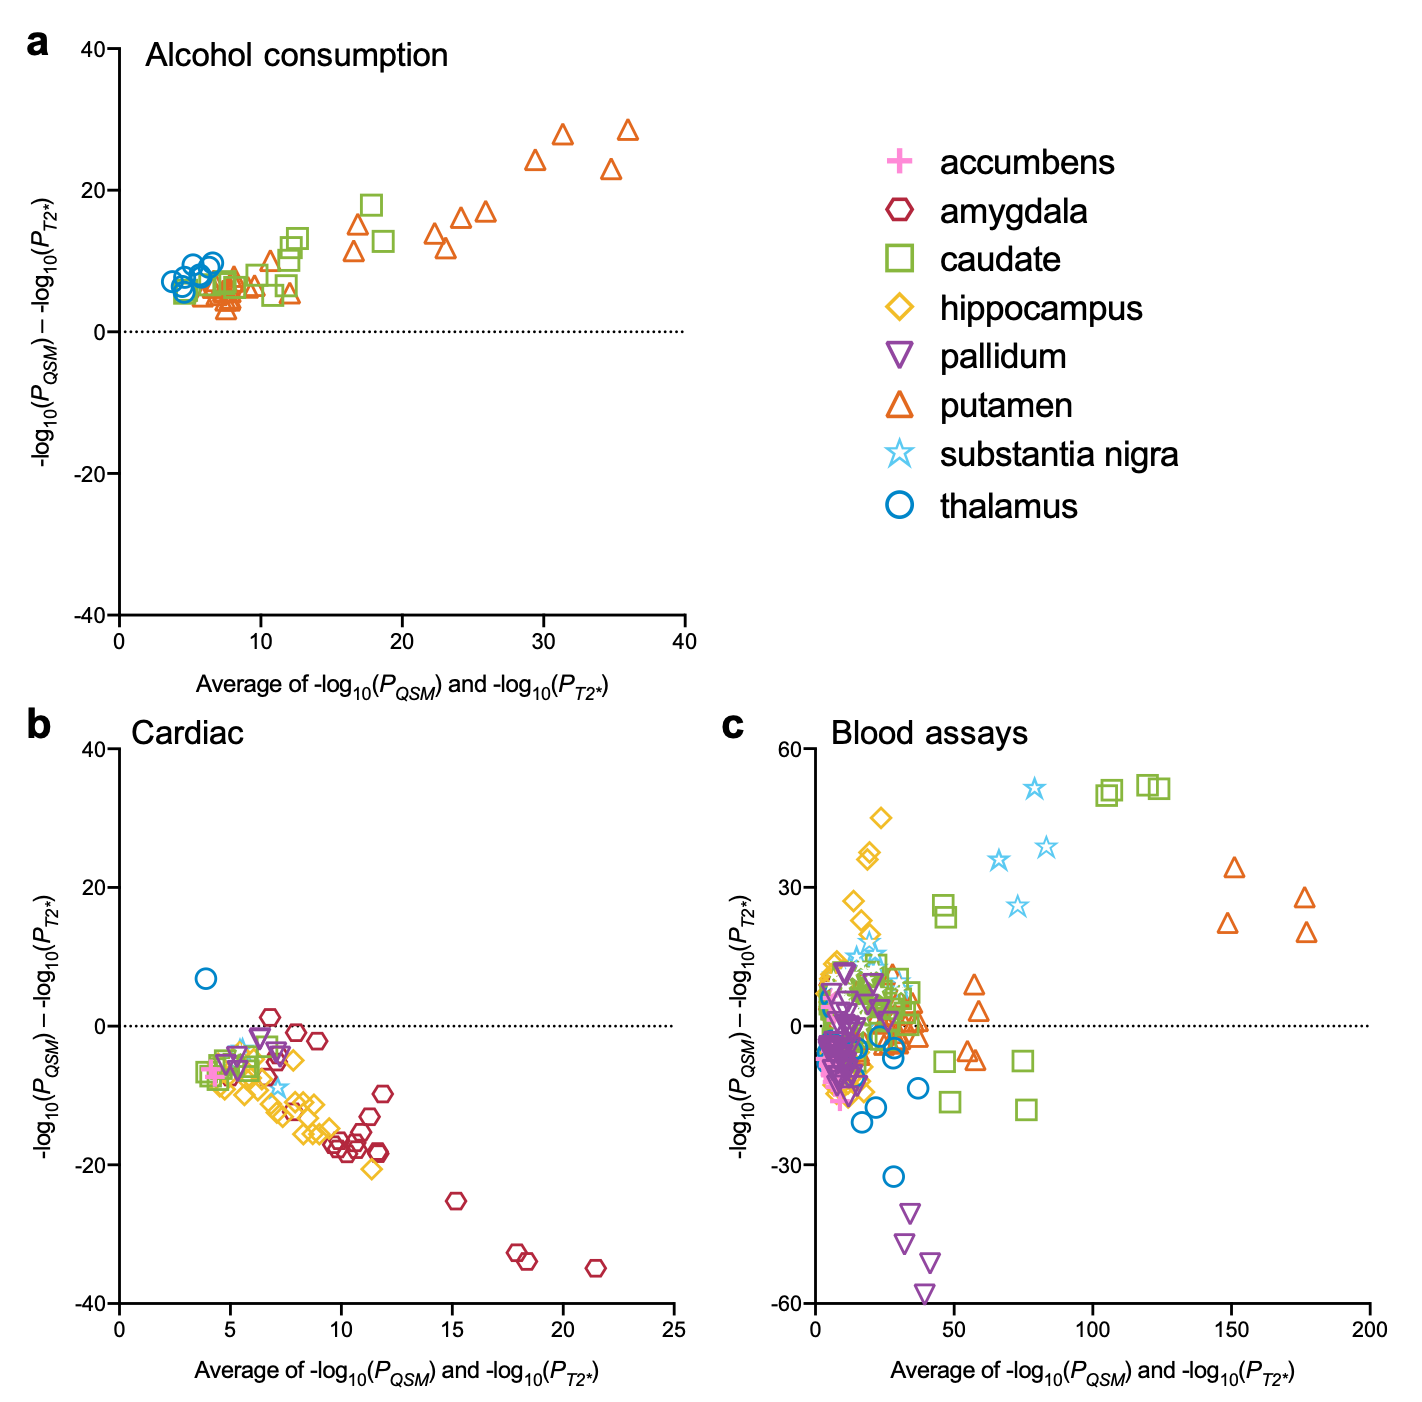
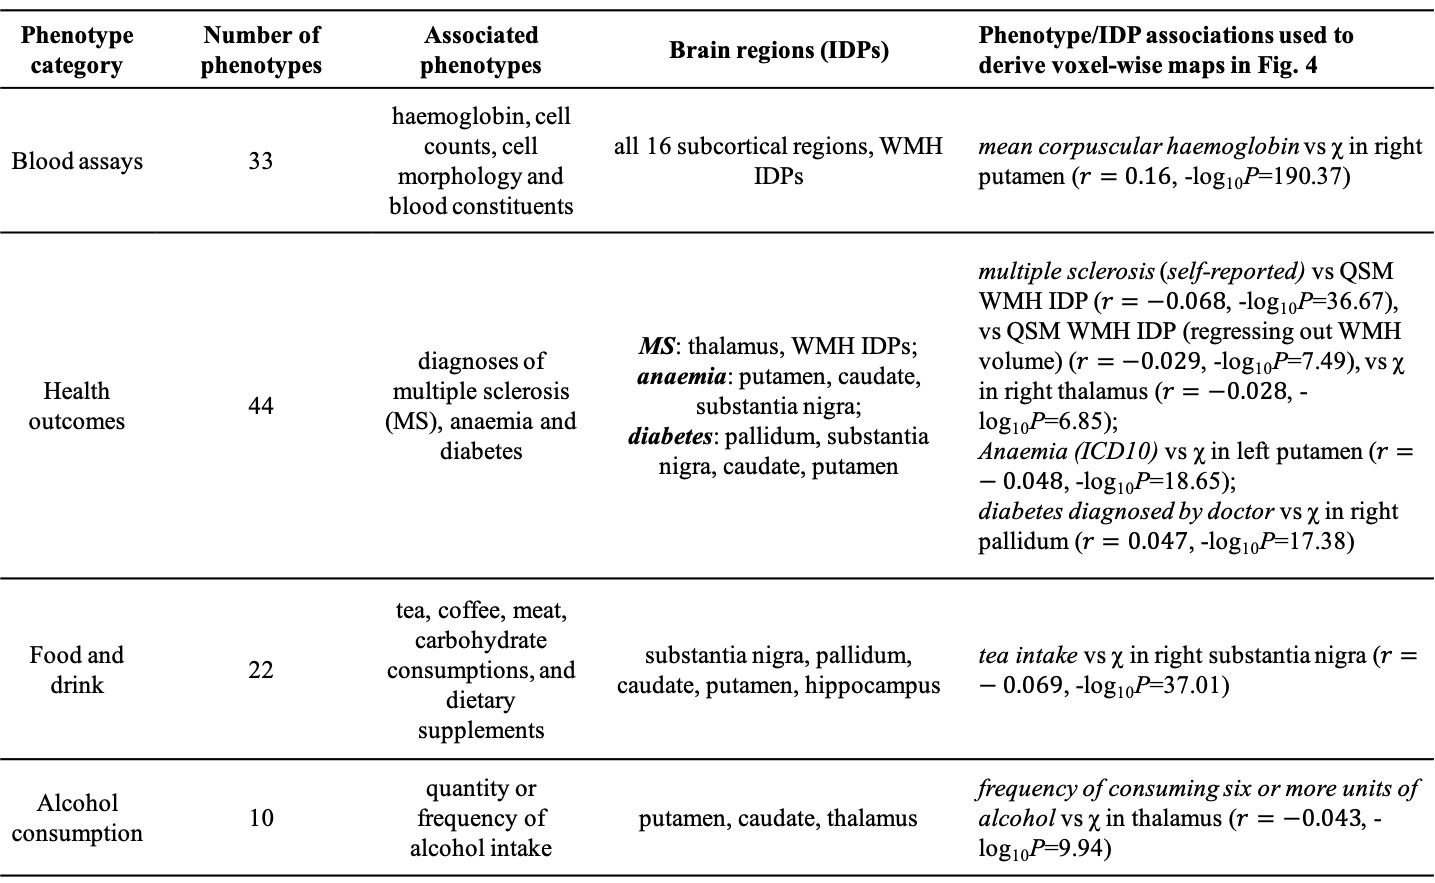
We identified statistically-significant associations of 251 phenotypes with QSM IDPs, and 224 phenotypes with T2* IDPs. We compared the strength of QSM and T2* associations. Associations in some phenotype categories (e.g., alcohol consumption) are more specific to QSM IDPs (Fig. 3a) whereas other categories (e.g., cardiac) are more specific to T2* IDPs (Fig. 3b). However, the majority of phenotype categories show a mixed pattern of associations, including both common and distinct associations (e.g., blood assays) (Fig. 3c)Here we describe a few example associations in four phenotype categories in detail. An overview of these categories is given in Table 1.
Blood assays
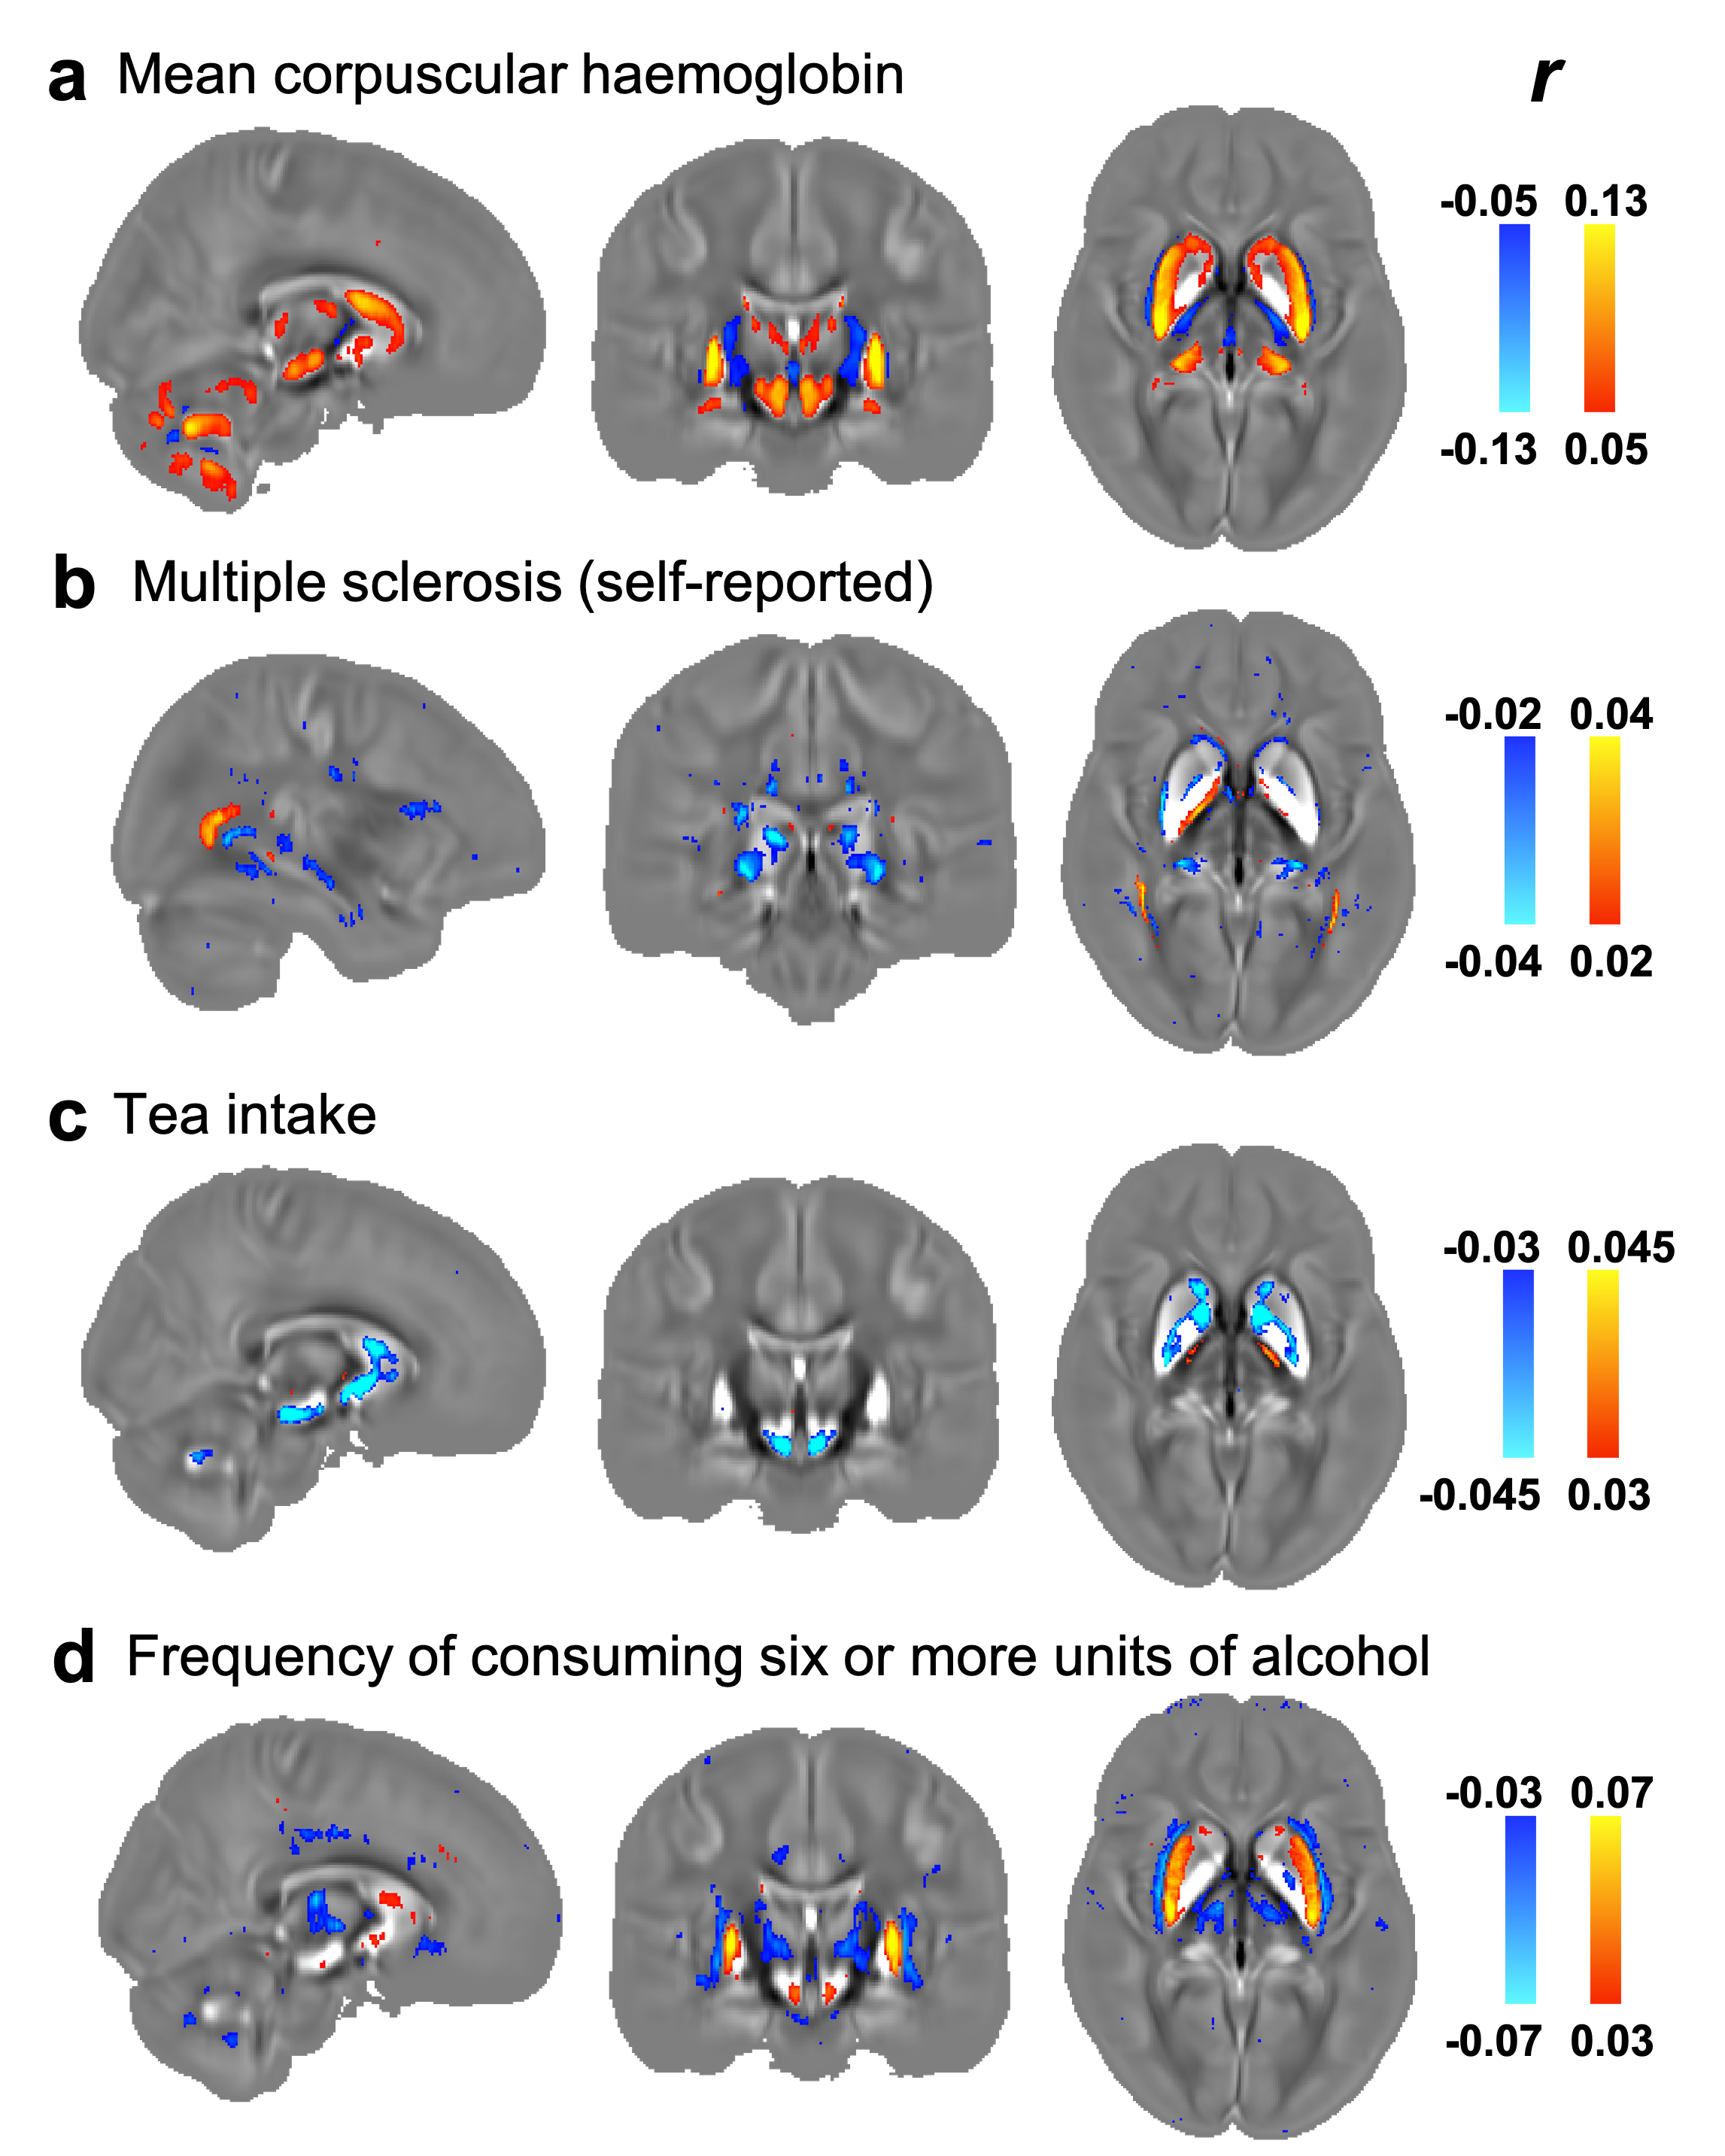
As shown in Fig. 1, the strongest associations are found in the blood assays category. They are haemoglobin-related phenotypes, which show positive correlations with QSM IDPs. This positive correlation is consistent with χ’s established relationship with iron, as haemoglobin-related blood measures are used clinically as a marker for a subject’s iron level4. The voxel-wise correlation map for the strongest correlation (mean corpuscular haemoglobin) is shown in Fig. 4a.
Health outcomes
In this category, the strongest association is found between the QSM WMH IDP and multiple sclerosis (self-reported) (Fig. 2), consistent with previous literature5. Its voxel-wise correlation map (Fig. 4b) reveals spatially contiguous negative associations in sub-regions of thalamus (including the pulvinar nucleus and lateral geniculate nucleus), as well as focal white matter regions such as the optic radiations. Previous literature has reported structural damage of the thalamic lateral geniculate nucleus in multiple sclerosis patients, reflecting potential damage of the visual pathway in multiple sclerosis6,7.
Food and drink
The strongest associations in this category relate to tea consumption, which correlates negatively with χ. Although no direct link between tea intake and χ measures have been described previously, polyphenols in both green and black tea have been reported as brain-permeable, natural iron chelators that have demonstrated neuroprotective effects8,9. The voxel-wise correlation map with tea intake is shown in Fig. 4c. Its spatial pattern of correlations is in line with a previous rodent study in which black tea extract reduced oxidative stress levels in the substantia nigra and striatum8.
Alcohol consumption
Alcohol consumption correlates more strongly with QSM IDPs than T2* IDPs in all cases (Fig. 3a). Voxel-wise correlation map with frequency of consuming six or more units of alcohol (Fig. 4d) reveals spatially contiguous positive associations in the putamen and sub-regions of substantia nigra and caudate, but also negative associations in sub-regions of the thalamus. These results recapitulate a previous study finding higher χ in the putamen, caudate and substantia nigra in subjects with alcohol use disorder, which has been linked to abnormal body iron accumulation10. χ in the thalamus correlated with phenotypes relating to the quantity of alcohol consumption. The thalamus is involved in the frontocerebellar circuit and Papez circuit, which are particularly affected by alcohol consumption11. Although no previous studies have linked χ in the thalamus with alcohol use disorder, neuroimaging studies have reported reductions in thalamic volume and connectivity in alcohol use disorder patients11.
Conclusion
Our results demonstrate that QSM and T2* contribute complementary information, as reflected in distinct patterns of associations. This QSM resource provides an opportunity to investigate χ contrast in previously unexplored territory, which might lead to advances in application of QSM in neuroscience. It is thus expected to be a valuable addition to the UKB neuroimaging resource.Acknowledgements
BCT and KLM contributed equally to this work.
This research was conducted using the UK Biobank Resource under application number 8107. We are grateful to UK Biobank for making the data available and to all UK Biobank study participants, who generously donated their time to make this resource possible.
References
1. Miller, K. L. et al. Multimodal population brain imaging in the UK Biobank prospective epidemiological study. Nature Neuroscience 19, 1523–1536 (2016).
2. Alfaro-Almagro, F. et al. Image processing and Quality Control for the first 10,000 brain imaging datasets from UK Biobank. NeuroImage 166, 400–424 (2018).
3. Wang, C., Martins-Bach, A. B., Alfaro-Almagro, F., Douaud, G., Klein, J. C., Llera, A., ... & Miller, K. L. Phenotypic and genetic associations of quantitative magnetic susceptibility in UK Biobank brain imaging. bioRxiv. (2021)
4. Jolobe, O. M. P. Mean corpuscular haemoglobin, referenced and resurrected. Journal of Clinical Pathology 64, 833 (2011).
5. Chen, W. et al. Quantitative Susceptibility Mapping of Multiple Sclerosis Lesions at Various Ages. Radiology 271, 183–192 (2013).
6. Schweser, F. et al. Mapping of thalamic magnetic susceptibility in multiple sclerosis indicates decreasing iron with disease duration: A proposed mechanistic relationship between inflammation and oligodendrocyte vitality. NeuroImage 167, 438–452 (2018).
7. Papadopoulou, A. et al. Damage of the lateral geniculate nucleus in MS. Neurology 92, e2240 (2019).
8. Chaturvedi, R. K. et al. Neuroprotective and neurorescue effect of black tea extract in 6-hydroxydopamine-lesioned rat model of Parkinson’s disease. Neurobiology of Disease 22, 421–434 (2006).
9. Mandel, S., Amit, T., Reznichenko, L., Weinreb, O. & Youdim, M. B. H. Green tea catechins as brain-permeable, natural iron chelators-antioxidants for the treatment of neurodegenerative disorders. Molecular Nutrition & Food Research 50, 229–234 (2006).
10. Juhás, M. et al. Deep grey matter iron accumulation in alcohol use disorder. NeuroImage 148, 115–122 (2017).
11. Segobin, S. et al. Dissociating thalamic alterations in alcohol use disorder defines specificity of Korsakoff’s syndrome. Brain 142, 1458–1470 (2019).
Figures