3292
Spatial properties of noise in prostate DWI acquired with an endo-rectal coil as critical information for clinical QA1Department of Radiology, The University of Chicago, Chicago, IL, United States, 2Sanford J. Grossman Center of Excellence in Prostate Imaging and Image Guided Therapy, The University of Chicago, Chicago, IL, United States, 3Philips Research NA, Cambridge, MA, United States
Synopsis
Development of quantitative QC methods for prostate DWI is important in clinical practice, necessitating reliable estimates of spatially heterogenous noise. In data obtained at 3T with the use of an endo-rectal coil, we use raw noise measurements to simulate pure-noise k-space datasets that are post-processed to yield noise maps. Good agreement is found between noise levels measured from noise maps in the central prostate and the estimates of noise produced from the anterior rectal ROIs in high TE / high b-value DWI. Thus, noise can be estimated from an anterior rectum region when the endo-rectal coil is used.
INTRODUCTION
Multi-parametric MRI (mp-MRI) is a critical step in prostate cancer diagnosis, with diffusion weighted imaging (DWI) and the resulting apparent diffusion coefficient (ADC) maps being an essential diagnostic tool.1,2 In DWI and ADC maps, variability can arise from both noise in the data and physiological (microscopic) and gross anatomic motion. Efforts to establish quality assurance (QA) processes for prostate mp-MRI are necessary and underway.3-5 For many specific quantitative quality control (QC) techniques, estimates of electronic noise (primarily from lossy coupling of detector arrays to the body) are needed to accurately estimate added contributions to variability from motion and other artifacts. These measurements are difficult due to a priori unknown spatial heterogeneity of noise propagation under SENSE reconstruction.6,7 Here, we propagate Gaussian noise measured from raw signal through the reconstruction pipeline for SENSE-accelerated data to produce spatially heterogeneous noise maps. These maps correspond to noise levels in clinical images and are used here to evaluate suitability of four ROI locations for noise estimation in DWI.METHODS
Patients scheduled for radical prostatectomy underwent mp-MRI of the prostate on a 3T dStream Philips Ingenia scanner, with multi-element anterior and posterior coils and an endo-rectal coil inflated with barium sulfate suspension. The protocol included a hybrid DWI series8-10 that mapped DWI signal dependence over a 4x4 matrix of TE and b values (FOV 180x180x102 mm3, resolution 1.5x1.5x3 mm3, SENSE factor 2.2, 34 slices, b-values(number of averages) (0(1)/150(1)/1000(1)/1500(4) s/mm2; TR 5000 ms; TE 57/70/150/200 ms). Raw data, including from reference and coil sensitivity scans, was captured using the ReconFrame patch (Gyrotools, Zurich, Switzerland) and post-processed using the MRecon Matlab library (Gyrotools).Coil element-specific standard deviation (SD) was measured in raw noise data and used to generate simulated k-space datasets containing only random complex Gaussian noise. Both this ‘pure noise’ and actual acquired k-space data were processed through the MRecon pipeline to produce noise maps (averaged over 12 simulated EPI readouts per slice) and DW images (with high TE / high b-value DW images, where little signal is expected, averaged over 3 directions with 4 averages per direction).
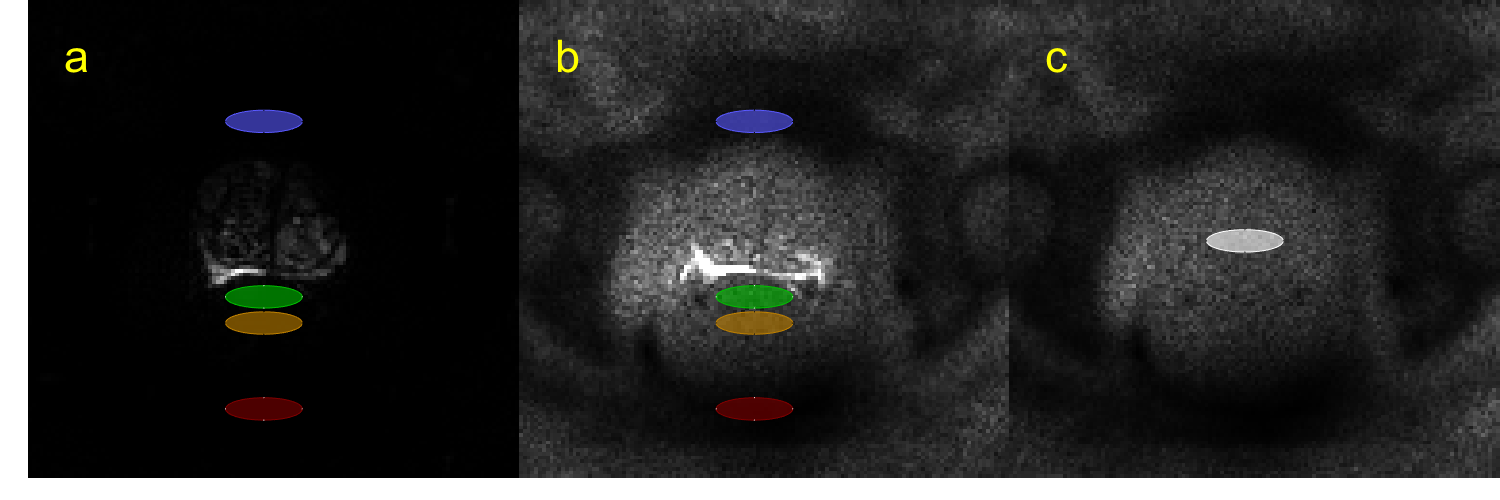
Four ROIs were defined in DW images: two in the rectum (RA, anterior rectum; RP; posterior rectum), and two in pelvic regions with low signal (A, anterior to the prostate; P, posterior to the rectum and the endorectal coil), for slices containing the prostate, but not bladder. Estimates of noise were obtained from DW images as signal SD in the four low-signal ROIs: SDRA, SDRP, SDA, and SDP were calculated in RA, RP, A, and P, respectively. The “ground truth” estimate of noise was obtained from noise maps as SD in one ROI: SDT was calculated in the central prostate (T).
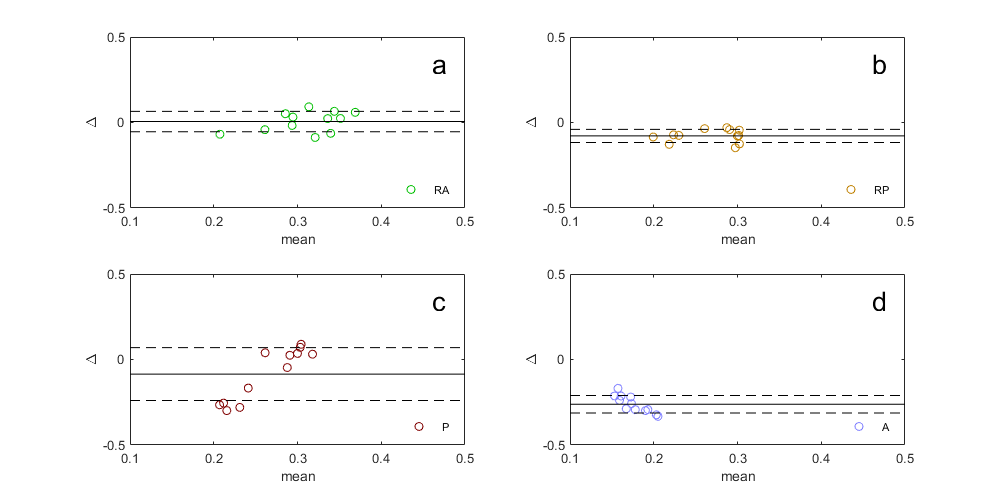
SDs of the signal in the four non-prostate ROIs were compared between noise maps and high TE / high b-value images via the Pearson’s correlation coefficient. Bland-Altman plots were generated to evaluate the suitability of SDRA, SDRP, SDA, and SDP as estimates of SDT.
RESULTS
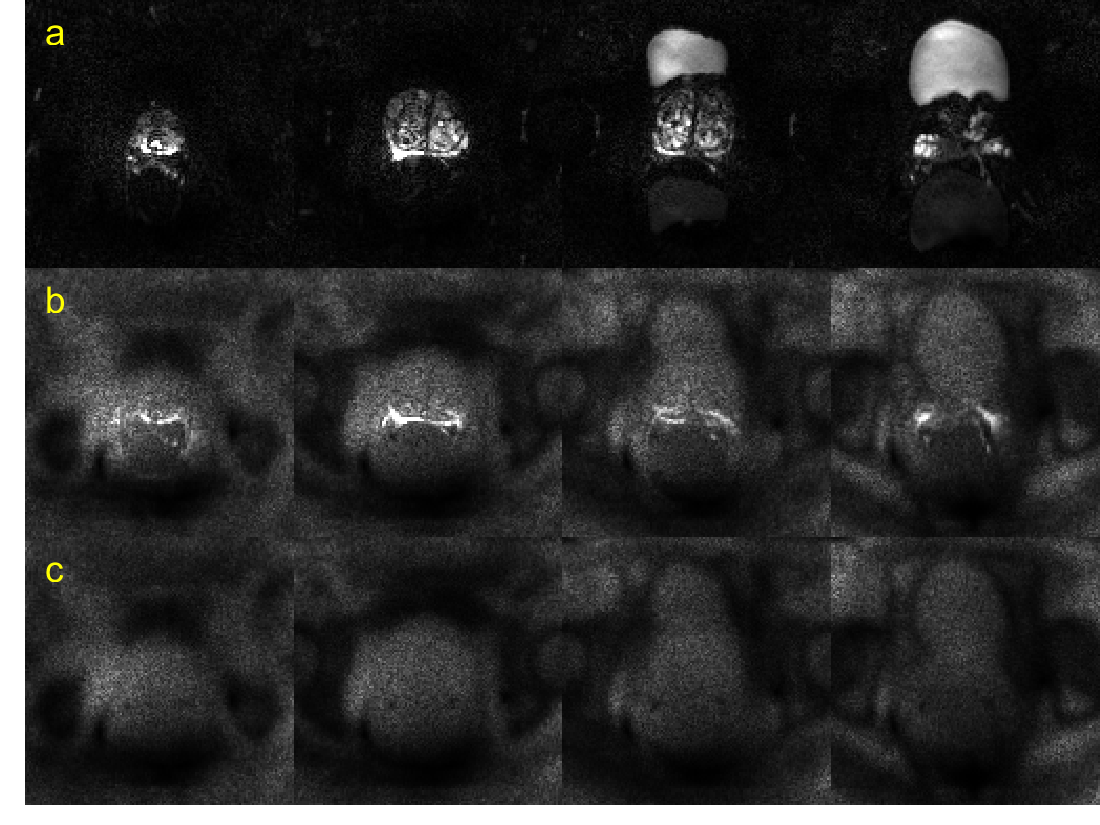
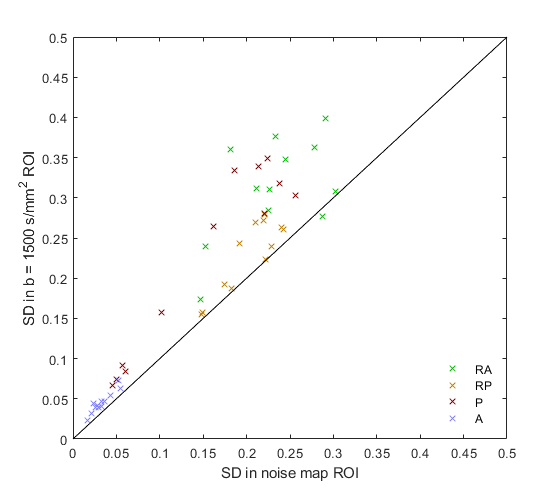
Figure 1 shows actual reconstructed DW images at four levels of the prostate, for TE = 200 ms and b = 0, 1500 s/mm2 (a, b) and the corresponding noise maps (c). Excellent correspondence in spatial distribution of noise is observed between (b) and (c), indicating that the spatial heterogeneity in low signal areas in high TE/ high b-value images arises predominantly through electronic noise propagation.Figure 2 shows the b = 0 and 1500 s/mm2 DW images (a, b) and the corresponding noise map (c), of a representative slice, with ROI locations outlined in color. Figure 3 shows the correlation plot between values measured in noise maps and DW images, for SDRA, SDRP, SDP, and SDA (r = 0.94, p < 0.001, for all ROIs combined). In Figure 4, Bland-Altman plots are shown for SDRA, SDRP, SDP, and SDA as estimates of SDT, with biases of 2%, -29%, -32%, and -149%, respectively. SDRA performs the best as the estimate of noise in the prostate region, with the noise levels being underestimated by ‑2%, 26%, 28%, and 85%, for SDRA, SDRP, SDP, and SDA, respectively.
DISCUSSION AND CONCLUSION
Regions of low signal are sometimes used for noise estimation in DWI and ADC maps, but this method is unreliable due to the spatial heterogeneity resulting from the SENSE-accelerated acquisition using coil elements with varying sensitivity and lossy inductive coupling. Noise mapping using the MRecon post-processing library revealed that the areas of low signal represent mostly noise, even when outlines of organs (e.g., bladder) are visible. Due to the spatial inhomogeneity of the noise levels resulting from the post-processing algorithm, careful selection of the ROI location for noise estimation is necessary. The anterior rectal ROI provided the best estimate of noise in the prostate region, with a minimal bias of 2%. High TE / high b-value images can be easily acquired and can provide noise level data for clinical QC.In conclusion, in prostate DWI acquired with the use of an endo-rectal coil, the anterior rectal region in the high TE / high b-value DW images can be used to estimate noise levels in the prostate tissue. This finding can facilitate development of quantitative QC methods for prostate DWI.
Acknowledgements
This research is supported by the University of Chicago Cancer Research Center and the NIH (R01CA172801; S10OD018448; P30CA014599).References
1. Schoots IG, Padhani AR. Delivering Clinical impacts of the MRI diagnostic pathway in prostate cancer diagnosis. Abdom Radiol (NY). 2020;45(12):4012-22.
2. Westphalen AC. Introduction to the special issue: Prostate Cancer Update. Abdom Radiol (NY). 2020;45(12):3947.
3. Turkbey B, Choyke PL. PI-QUAL, a New System for Evaluating Prostate Magnetic Resonance Imaging Quality: Is Beauty in the Eye of the Beholder? Eur Urol Oncol. 2020;3(5):620-1.
4. de Rooij M, Hamoen EH, Futterer JJ, Barentsz JO, Rovers MM. Accuracy of multiparametric MRI for prostate cancer detection: a meta-analysis. AJR Am J Roentgenol. 2014;202(2):343-51.
5. Giganti F, Allen C, Emberton M, Moore CM, Kasivisvanathan V, group Ps. Prostate Imaging Quality (PI-QUAL): A New Quality Control Scoring System for Multiparametric Magnetic Resonance Imaging of the Prostate from the PRECISION trial. Eur Urol Oncol. 2020;3(5):615-9.
6. Sadinski M, Medved M, Karademir I, et al. Short-term reproducibility of apparent diffusion coefficient estimated from diffusion-weighted MRI of the prostate. Abdom Imaging. 2015;40(7):2523-8.
7. Chatterjee A, Szasz T, Lee G, et al., Physically Implausible Diffusion Signals as a Quantitative Assessment Metric in Prostate Diffusion Weighted MR Imaging, SAR Annual Meeting, Hollywood, FL; 2021.
8. Sadinski M, Karczmar G, Peng Y, et al. Pilot Study of the Use of Hybrid Multidimensional T2-Weighted Imaging-DWI for the Diagnosis of Prostate Cancer and Evaluation of Gleason Score. AJR Am J Roentgenol. 2016;207(3):592-8.
9. Wang S, Peng Y, Medved M, et al. Hybrid multidimensional T(2) and diffusion-weighted MRI for prostate cancer detection. J Magn Reson Imaging. 2014;39(4):781-8.
10. Chatterjee A, Bourne RM, Wang S, et al. Diagnosis of Prostate Cancer with Noninvasive Estimation of Prostate Tissue Composition by Using Hybrid Multidimensional MR Imaging: A Feasibility Study. Radiology. 2018;287(3):864-73.
Figures