3285
Numerical approach to quantify MR imaging artifacts at metallic orthopedic implants at 1.5T, 3T, and 7T1Erwin L. Hahn Institute for MR Imaging, University of Duisburg-Essen, Essen, Germany, 2High-Field and Hybrid MR Imaging, University Hospital Essen, University Duisburg-Essen, Essen, Germany, 3MRI-STaR Magnetic Resonance Institute for Safety, Technology and Research GmbH, Gelsenkirchen, Germany, 4MR:comp GmbH, Testing Services for MR Safety & Compatibility, Gelsenkirchen, Germany
Synopsis
This study evaluates a numerical approach to simulate artifacts due to presence of orthopedic metallic implants in the MR environment. Further to previously published studies, the numerical approach is validated by comparing simulations and measurements of orthopedic implants at three different field strengths (1.5T, 3T, and 7T). Artifact simulations and measurements of the implants show high correlation at all field strengths. The method potentially can be applied to improve the artifacts testing procedure for medical implants according to ASTM F2119. Additionally, the influence of different imaging parameters (echo time and bandwidth) on the artifact size is quantified via numerical simulations.
Introduction
Over the past decades, number of patients with implants who need to be examined with magnetic resonance (MR) imaging increases. In addition to safety-related aspects, MR imaging artifacts are an important factor of MR safety assessments. Therefore, it is important to know the impact of the medical implant on the MR scanning process. The ASTM F2119 standard provides a test method for testing MR related imaging artifacts from medical implants, but a detailed artifact investigation requires a time-intensive measuring effort since different test object (TO) orientations, slice orientations and pulse sequences must be scanned. In previous work1 a numerical simulation tool was published and validated with TOs of simple geometry. In this work, more realistic TOs were used to further test and validate our numerical approach. Simulations of two complex orthopedic implants were compared with the measurements, and the influence of different MR imaging parameters on the MR image artifact2 was quantified with the help of the numerical simulation tool.Materials & Methods
Artifacts of two orthopedic implants were simulated and measured at three different magnetic field strengths: 1.5T, 3T, and 7T. The TOs were an orthopedic titanium acromioclavicular joint hook plate and a titanium distal radius plate (Fig 1.). Simulations were performed by using a numerical framework1 to create the imaging artifacts of the two TOs. The TOs were represented in simulations by geometrically accurate 3D CAD-data and known magnetic susceptibility values (182 ppm). For the simulations, the TOs were then sequentially placed inside a phantom in three different orthogonal orientations in relation to the static magnetic field. For each of these TO orientations, a set of gradient echo and a spin echo sequences was acquired according to ASTM F21193 employing three different slice orientations. Within the simulations, imaging parameters such as bandwidth or echo time were changed to quantify the influence of these parameters on the MR image artifact. For the measurements, the two TOs were sequentially placed inside a phantom (Fig. 1 C/D) (fixed with fishing lines) filled with vegetable oil (ε = 0.40, σ = 6.6 mS/m) under the same configuration as in the numerical part and scanned in each of the three MRI systems (MAGNETOM Aera/Skyra/Terra, Siemens Healthcare GmbH, Germany)Artifact Evaluation:
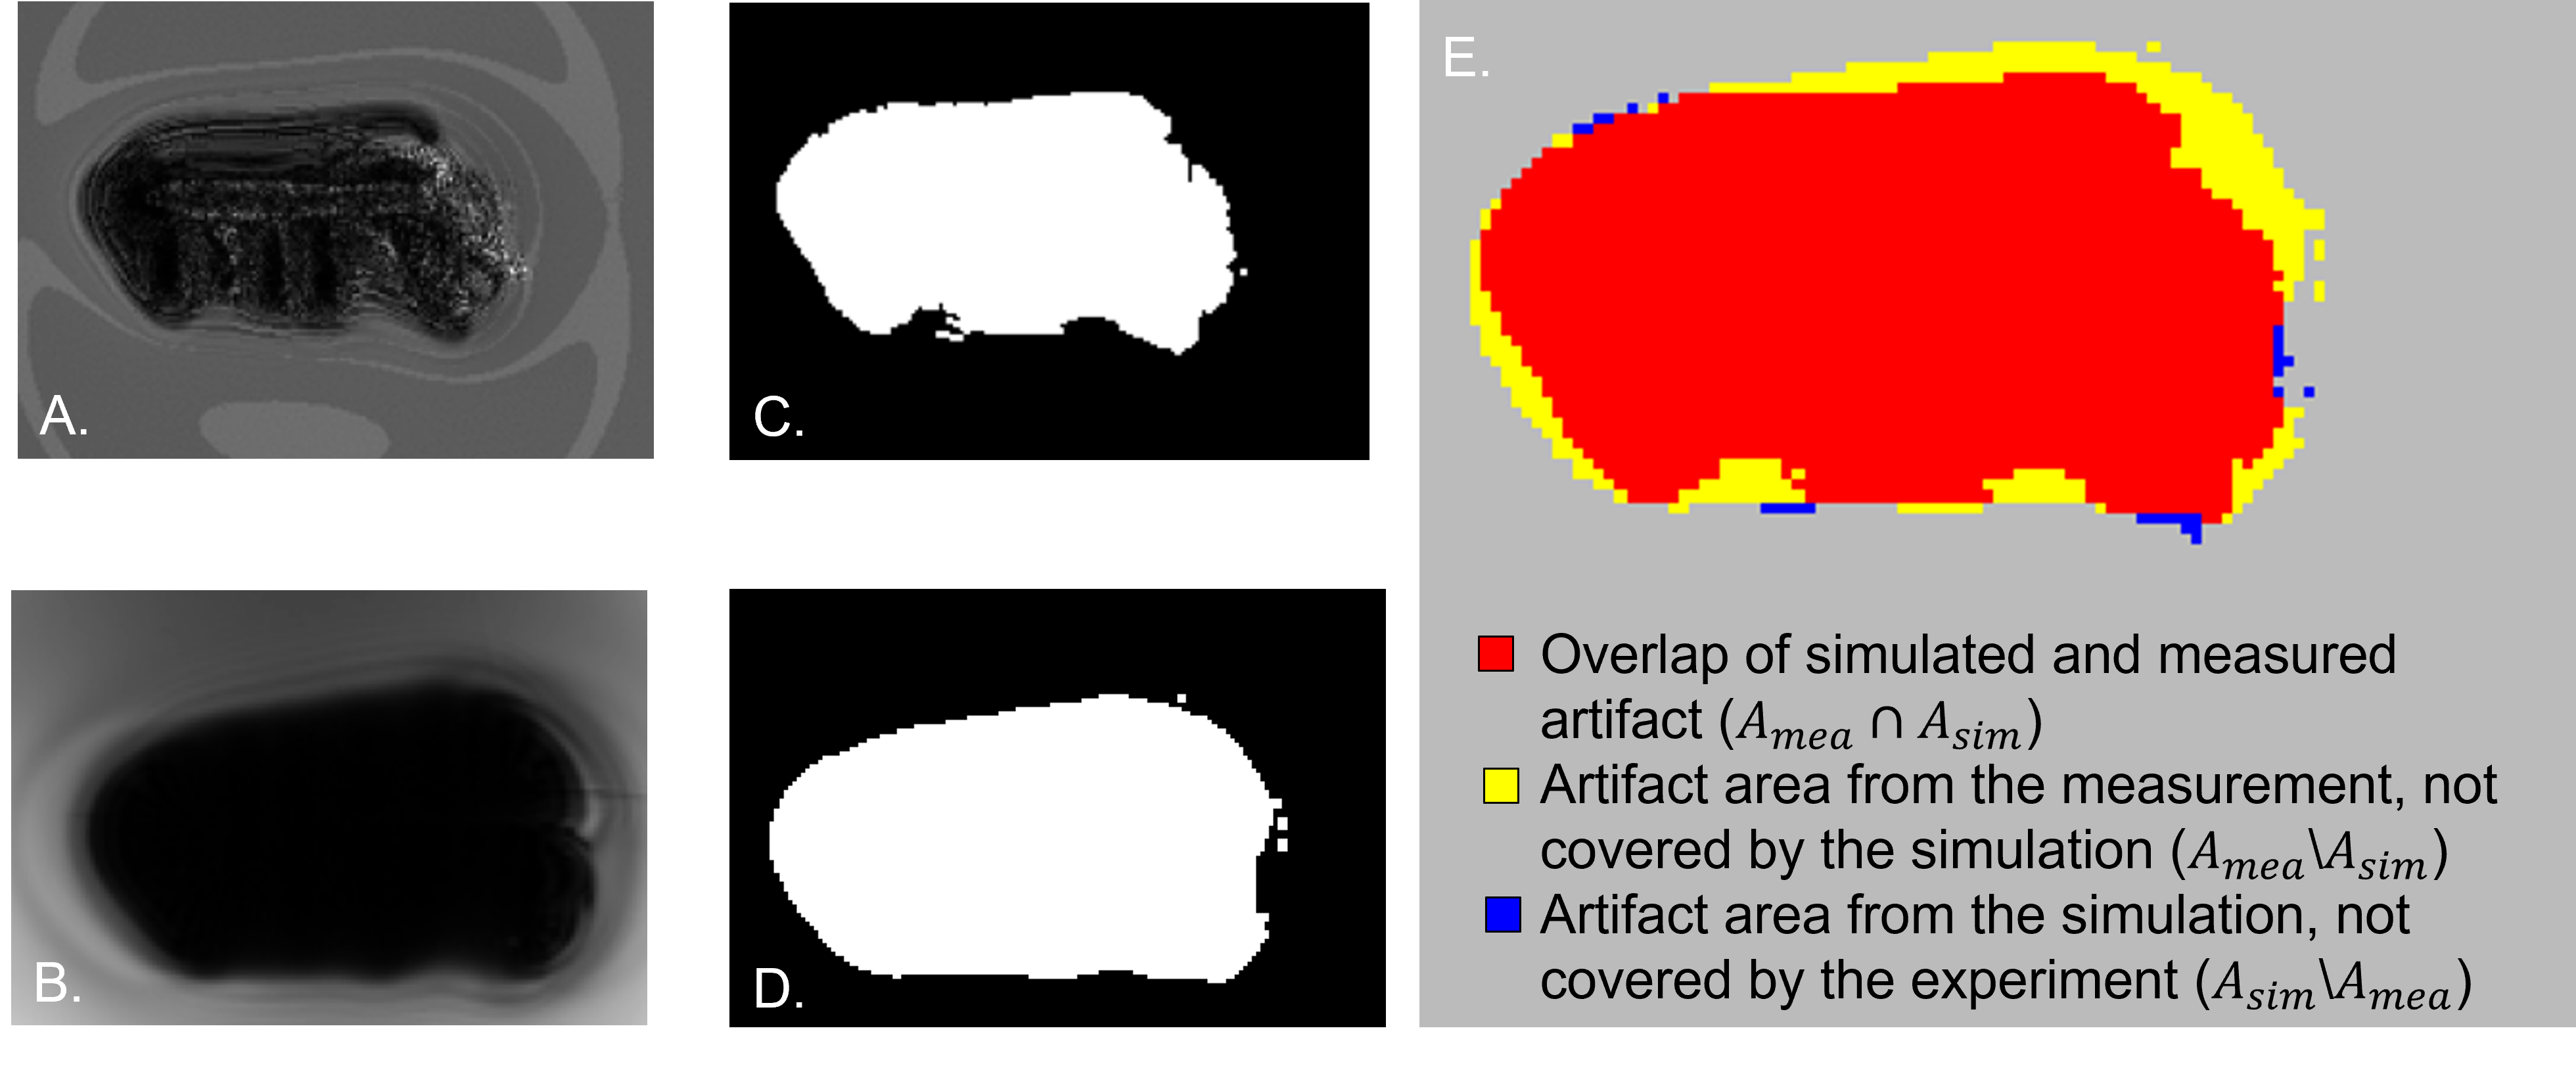
Validation of the accuracy of the simulated artifacts was performed by a pixel-wise comparison of the artifact shape of the simulated and measured images. According to ASTM F2119, an artifact is declared as a 30 % signal change compared to a reference image without the TO (Fig. 2). The calculation of the image artifact was performed for different scanning conditions of the simulated and measured images. Based on this set of artifact masks, the different configurations were overlaid as shown in Fig. 2. To evaluate the similarity between the simulated (Asim) and the measured (Amea) artifact area, the dice similarity coefficient (DSC) was used, which is calculated as follow:
$$DSC=\frac{2\left\lvert A_{mea}*A_{sim}\right\rvert}{\left\lvert A_{mea}\right\rvert+\left\lvert A_{sim} \right\rvert }$$
Results
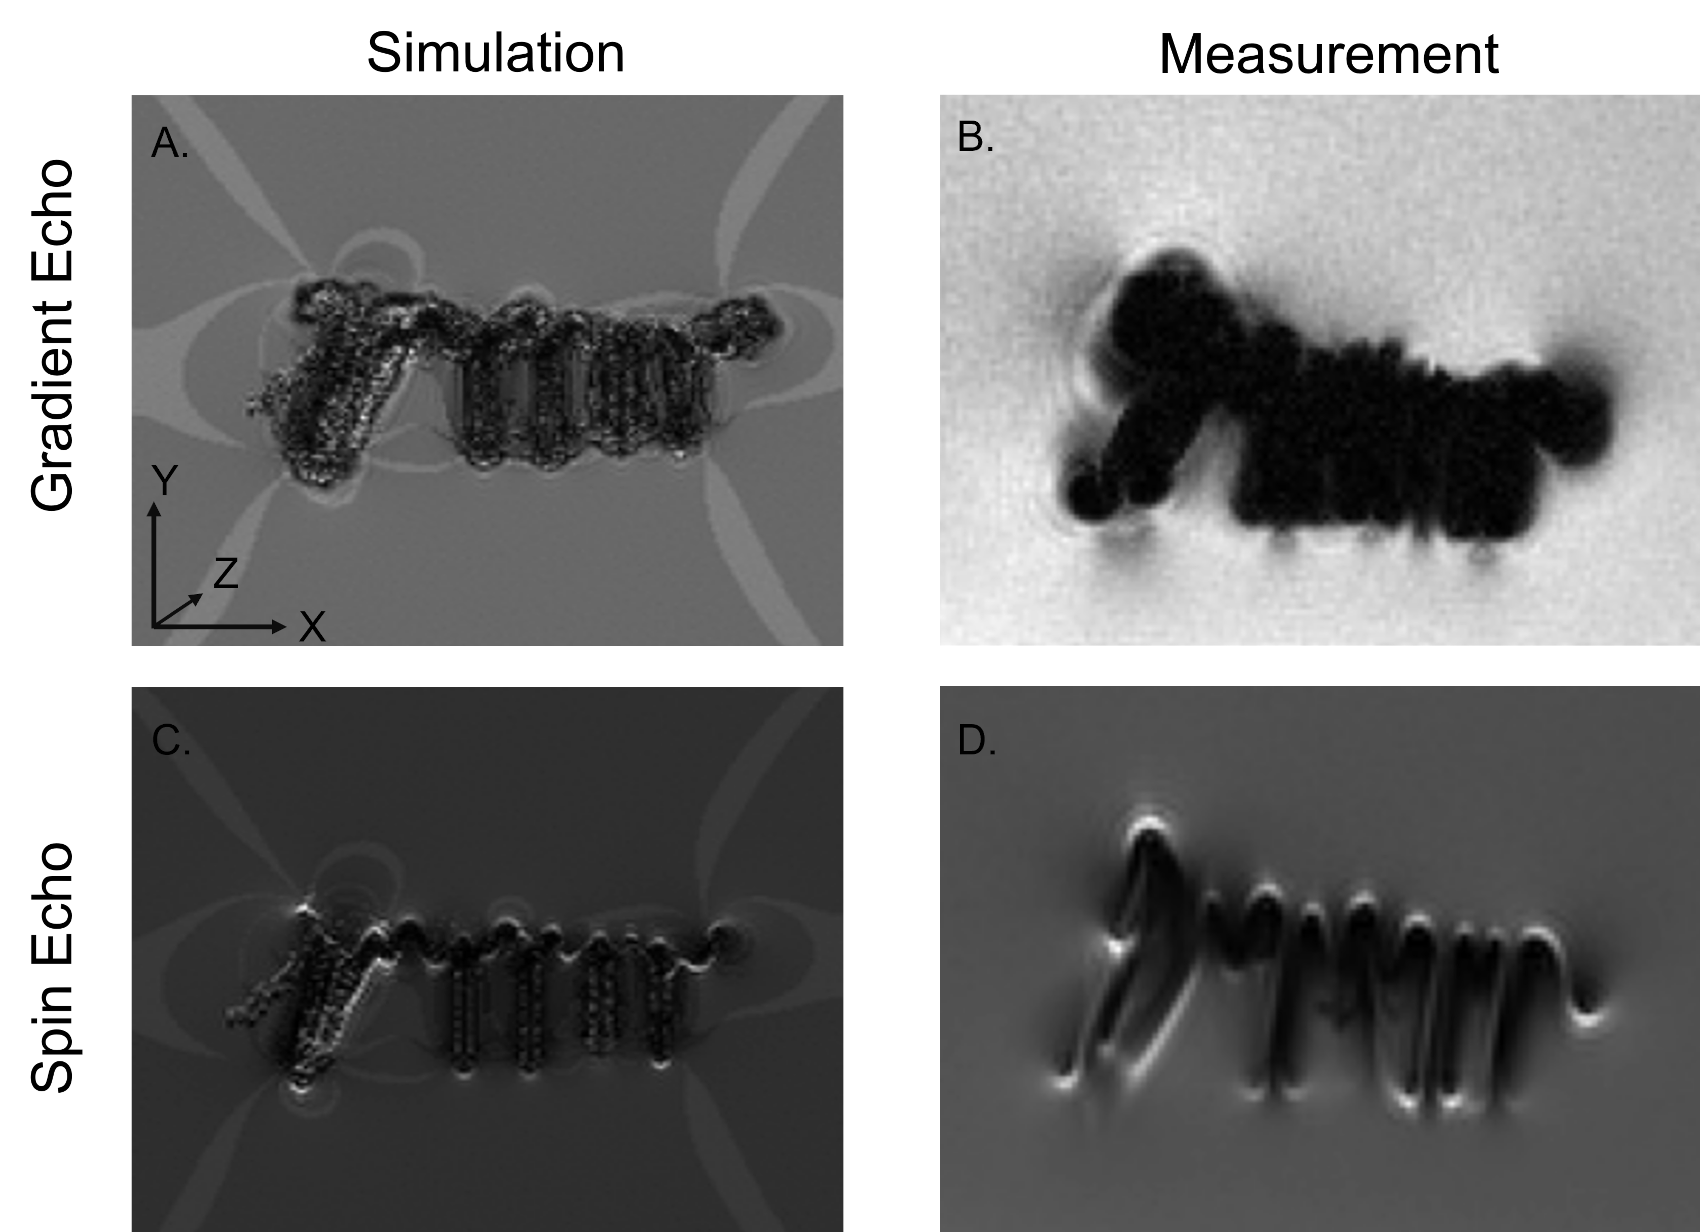
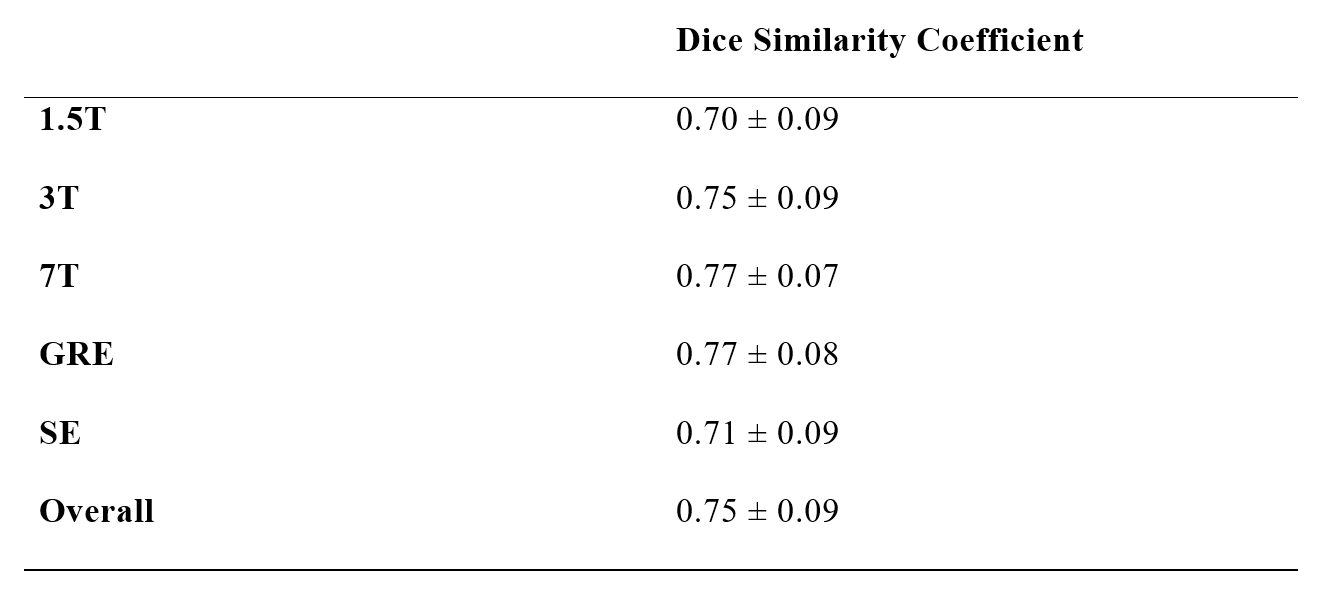
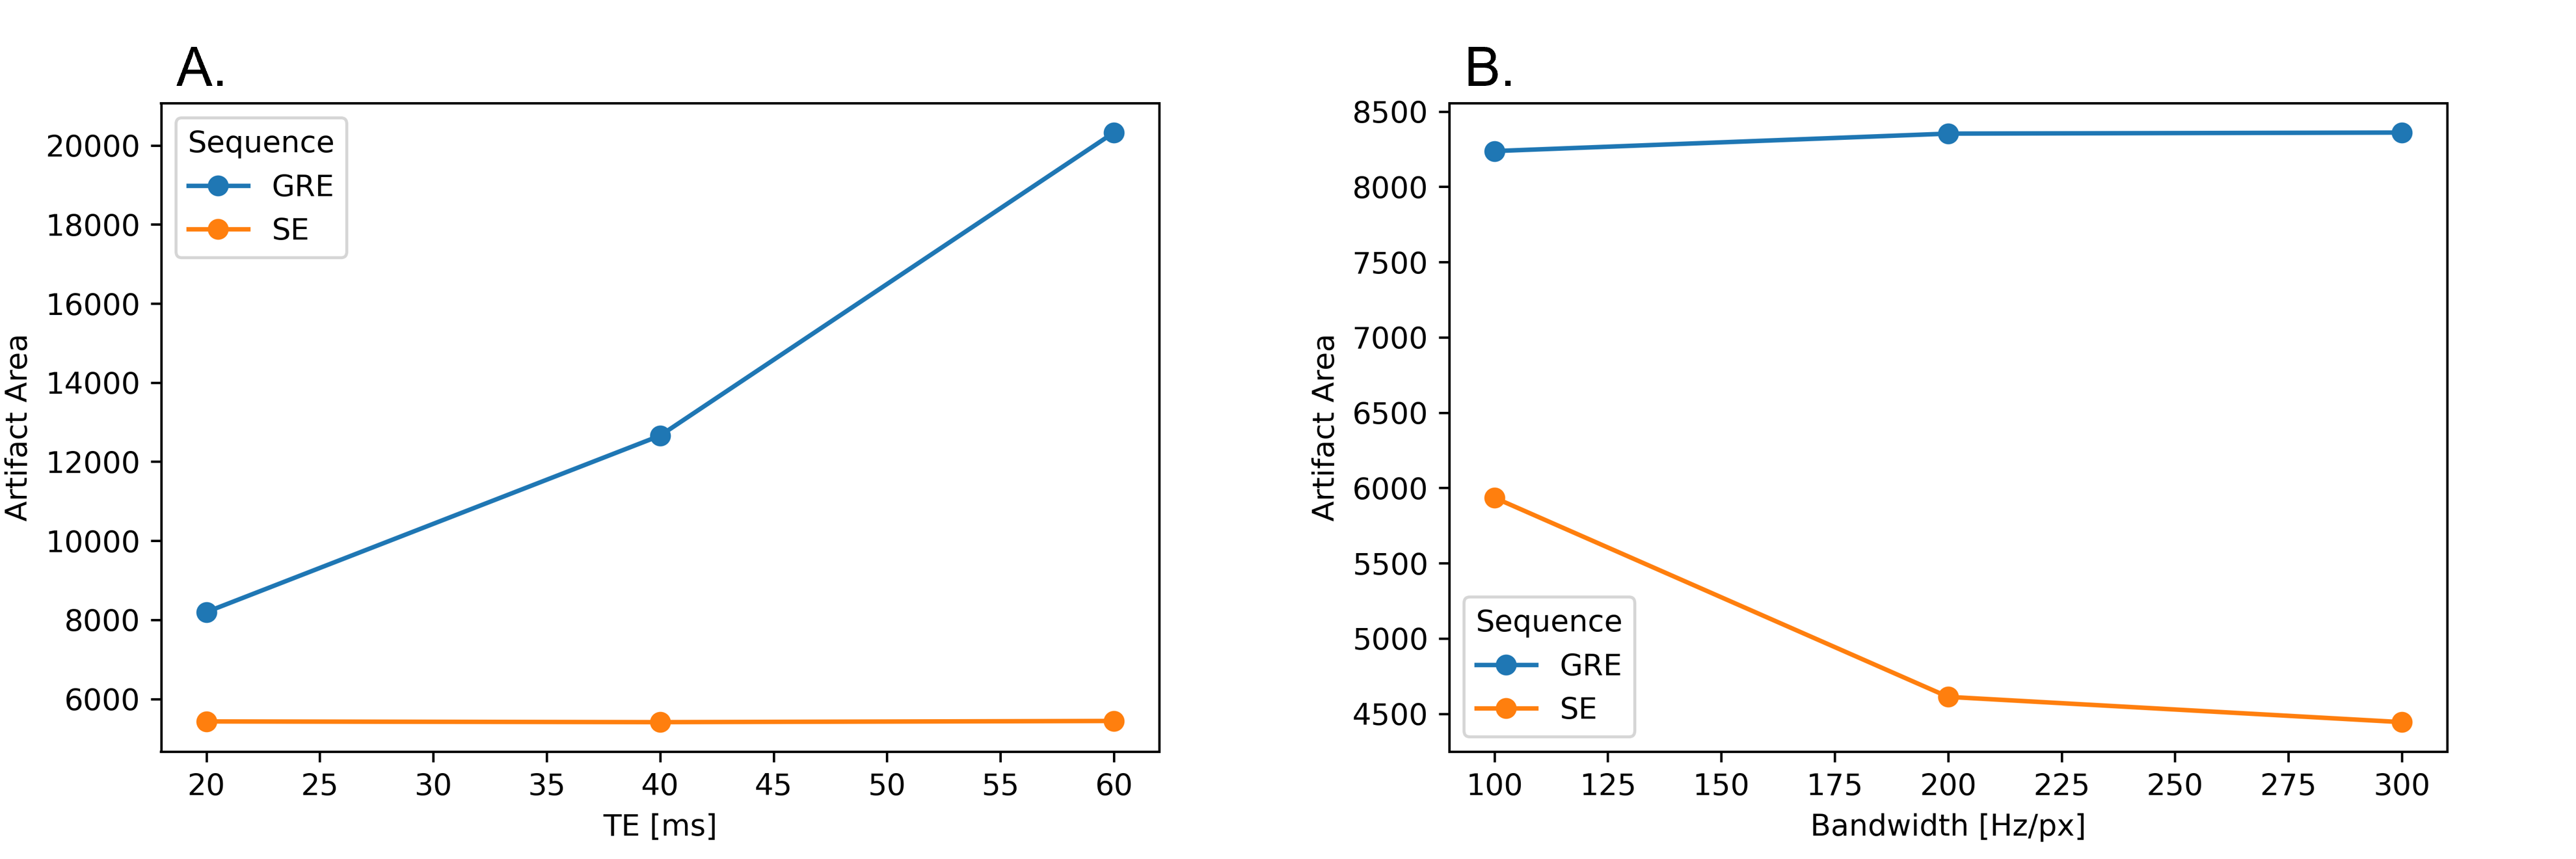
Figure 3 shows that the artifact simulation matches the general shape of the artifact measurements, which is also shown for all simulations by the usage of the DSC. The average DSC over all configurations is 0.75 ± 0.09. Figure 4 also shows that the DSC increases with the field strength. Whereas the DSC at 1.5T is only 0.70 ± 0.09, the DSC at 7T increases to 0.77 ± 0.07. It can also be seen that the DSC of the gradient echo images is higher (0.77 ± 0.08) than for the spin echo sequences (0.71 ± 0.09). The second part of the evaluation focuses on numerical simulation to show the influence of different scanning parameters on the artifact size. Figure 5 presents the simulated influence of the echo time (TE) and the bandwidth on the artifact size. As expected, an increase of the echo time in the gradient echo sequence leads to an increase of the artifact area, which is not observed in the spin echo sequence (Fig 5A). On the other hand, an increase of the bandwidth leads to a decrease of the artifact size while this parameter has no noticeable influence on the gradient echo sequence (Fig 5B).Discussion
As shown by the DSC, the simulations match with the measurements (> 0.75). Nevertheless, there is a difference between the simulated and the measured MR image artifacts, which may be explained by inaccuracies in the exact placement of the TO and the selection of the correct slice position. In the next step of this research, this numerical approach will allow for an easy adjustment of imaging parameters (e.g., flip angle, TE, or bandwidth) and TO parameters (choice of material and/or TO orientation). This could help to quantify the influence of these parameters on the MR image artifact for sequence protocol optimization without requiring time-consuming MR measurements which helps. Further, this research work may help developing a guideline that provides quantitative recommendations for optimizing the imaging parameters leading to a certain artifact size change for various implants and at various magnetic field strengths.Conclusion:
This work presents a framework which allows simulating artifacts from medical implants at different field strengths and, furthermore, to simulate the influence of MR imaging parameters on artifact size.Acknowledgements
No acknowledgement found.References
1. Spronk T, Kraff O, Kreutner J et al. (2021) Development and evaluation of a numerical simulation approach to predict metal artifacts from passive implants in MRI. Magn Reson Mater Phy. https://doi.org/10.1007/s10334-021-00966-5
2. Port JD, Pomper MG (2000) Quantification and minimization of magnetic susceptibility artifacts on GRE images. J Comput Assist Tomogr 24:958–964. https://doi.org/10.1097/00004728-200011000-00024
3. ASTM F2119-07(2013), Standard Test Method for Evaluation of MR Image Artifacts from Passive Implants, ASTM International, West Conshohocken, PA, 2013, www.astm.org
Figures