3279
Apolipoprotein-E (APOE) Deficiency Leads to Neuronal Network Remodeling Characterized by Diffusion MRI and Graph Theory1Developmental Biology, University of Pittsburgh, Pittsburgh, PA, United States, 2Department of Experimental Neurology, Charite University Medicine Berlin, Berlin, Germany
Synopsis
Allelic difference in Apolipoprotein-E (APOE) is a well-known risk factor for the late-onset Alzheimer’s disease (AD) but how APOE affects brain functions and the subsequent cognitive declination remains unclear. Diffusion MRI followed by network topology analysis found that APOE deficiency in knockout mice resulted in altered neuronal network in the brain regions known to be affected by Alzheimer’s Disease. This study suggests the possible role of APOE in neuronal network organization, which might predispose brains to differential AD vulnerability.
Introduction
It is estimated that over 5.8 million Americans have Alzheimer’s disease (AD) making it the fifth leading cause of death in people over 65 years of age, a number increasing with time. It is a national concern, as patients and families face the increased emotional, physical and monetary stress of long term care as the disease’s onset is slow [1]. Apolipoprotein E (APOE), a class of lipoproteins involved in lipid and lipoprotein metabolism, is the strongest genetic risk factor for the late-onset Alzheimer Disease (LOAD) [2, 3] with allelic differences [4]. However, how APOE influences brain function and subsequent cognitive declination is unknown. We hypothesize that APOE, known to affect synaptic plasticity [5], is important for establishing neuronal network. APOE deficiency might lead to neuronal network remodeling which can attenuate vulnerability for AD. The aim of this study is to test this hypothesis in APOE knockout (KO) mice, using diffusion MRI and graph theory to characterize the neuronal network topology.Method
A. Animal Model: 10 male APOE KO mice and age-matched wild-type (WT) C57BL/6J controls were subjected to diffusion MRI followed by topological analysis with graph theory.B. Diffusion Tractography: Diffusion MRI was acquired at 7-Tesla (Bruker Biospec USR 70/30) with the following parameters: 156-micrometer isotropic resolution, 30 diffusion directions, diffusion gradient length 4 msec, diffusion separation 8 msec, b = 1200 s/mm2. Neuronal fiber tracking without assigning any region of interest (ROI) or region of avoidance (ROA) were conducted using generalized deterministic fiber tracking with 100,000 seeding points using the open source DSI Studio with a q-space diffeomorphic reconstruction method.
C. Segmentation and Parcellation: Allen brain atlas was used to register the 3D T2WT anatomical imaging with 78-micrometer isotropic resolution and DTI as previous described [6] to parcellate the whole brain into 72 regions.
D. Network analysis: Connectivity matrices counting the connecting tracts between brain regions, graph theoretical analysis, and diffusion parameters were calculated using DSI studios, then averaged for 8 APOE KO and 8 WT mice. Only connecting regions that contributed greater than 3% of the total tracts were including in connectivity matrices. Statistics were calculated using student’s t-test. Network parameters were calculated based on graph theory [7].
Results
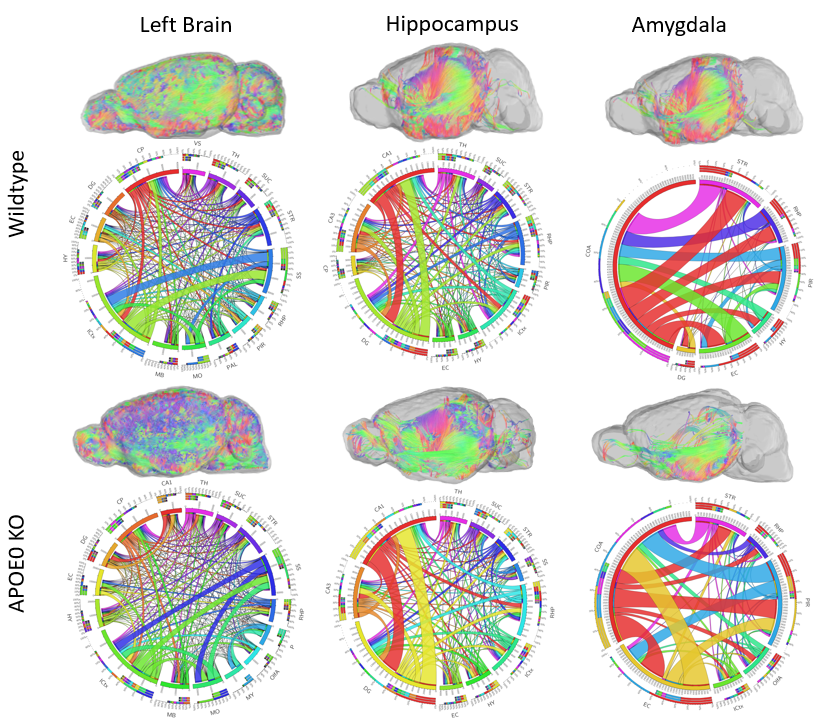
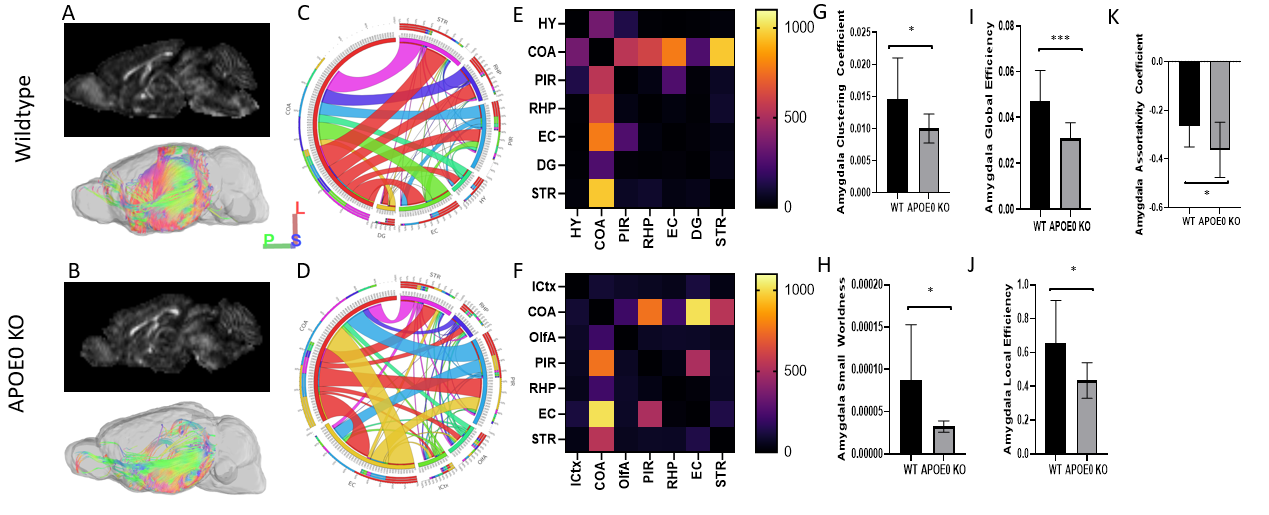
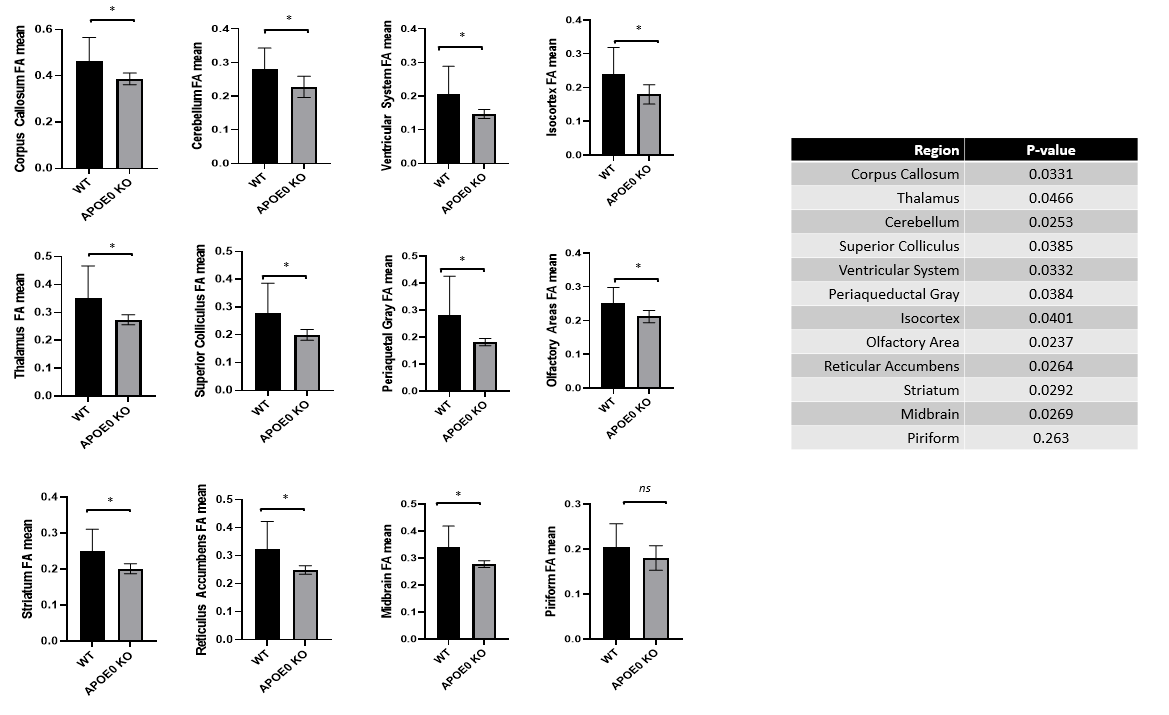
Analysis of the left hemisphere showed differences in the distribution of connections between regions. Visually, a representative image of each animal shows that the majority of tract direction differs, with wildtype mice fiber organization in the anterior/posterior direction and APOE KO fiber in the medial/lateral direction. Differences in fiber organization are prevalent in connections between the rest of the brain and hippocampus or amygdala. Connectivity in the hippocampus, which plays a role in learning and memory, differs in number of fiber connections, with wildtype averaging 115,858 connections while APOE0 KO averaged 111,131 connections. Number of connections in the amygdala, a region also known for memory processing as well as emotional response and decision making, differed with wildtype averaging 25,628 connections and APOE KO averaging 20,147. Differences in the distribution of these fibers for left brain, hippocampus, and the amygdala are visible in the circular tables. (Figure 1) Deeper analysis into the amygdala proved that the number and distribution of fiber connections as well as network measures were different between APOE KO and wildtype. Network measures represent various conditions of the fiber tractography, such as the likelihood that connections cannot be attributed to random chance, potential for information flow between regions, and local connectedness. Wildtype mice were found, on average, to have significantly higher network measures in the amygdala than APOE KO mice suggesting that connectedness between the amygdala and other regions of the brain was more efficient, less random, and more connected than APOE0 KO (Figure 2). Fractional anisotropy (FA) in each brain region provided an insight into the organization of diffusion in fiber tracts. Higher FA values indicate that diffusion is less random in fiber tracts, suggesting that the fiber tracts could be denser and more myelinated. 11 of 36 regions in wildtype brains had an average FA value significantly higher than APOE KO. (Figure 3)Conclusion
Our study showed that the APOE deficiency in mice resulted in altered neuronal network organization. Compared to APOE KO, WT brain networks showed higher levels of fiber tracts in brain regions relevant to AD, more organized fiber distribution and higher fractional anisotropy. Our study suggests the potential role of APOE in neuronal network organization which may influence AD vulnerability.Acknowledgements
MCS and YLW are supported by funding from NIH-R21-EB023507, AHA-18CDA34140024, and DoD-W81XWH1810070. Funding to SM, SPK and PBS was provided by the German Federal Ministry of Education and Research under the ERA-NET NEURON scheme (BMBF 01EW1811), and the German Research Foundation (DFG, Project BO 4484/2-1 and EXC NeuroCure).References
1. 2020 Alzheimer's disease facts and figures. Alzheimer's & Dementia, 2020. 16(3): p. 391-460.
2. Hersi, M., et al., Risk factors associated with the onset and progression of Alzheimer's disease: A systematic review of the evidence. Neurotoxicology, 2017. 61: p. 143-187.
3. Yu, J.T., L. Tan, and J. Hardy, Apolipoprotein E in Alzheimer's disease: an update. Annu Rev Neurosci, 2014. 37: p. 79-100.
4. Holtzman, D.M., et al., Expression of human apolipoprotein E reduces amyloid-beta deposition in a mouse model of Alzheimer's disease. J Clin Invest, 1999. 103(6): p. R15-r21.
5. Kim, J., et al., Apolipoprotein E in synaptic plasticity and Alzheimer's disease: potential cellular and molecular mechanisms. Mol Cells, 2014. 37(11): p. 767-76.
6. Koch, S., et al., Atlas registration for edema-corrected MRI lesion volume in mouse stroke models. J Cereb Blood Flow Metab, 2019. 39(2): p. 313-323.
7. Rubinov, M. and O. Sporns, Complex network measures of brain connectivity: uses and interpretations. Neuroimage, 2010. 52(3): p. 1059-69.
Figures