3276
Phase-Based T2 Mapping for Assessment of Liver Fibrosis in a Porcine Model
Ruvini Navaratna1,2, Daiki Tamada2, Sarvesh Periyasamy2,3, Jennifer J Meudt4, Paul Laeseke2,3, Dhanansayan Shanmuganayagam4,5,6, Scott B Reeder1,2,3,7,8, and Ali Pirasteh1,2
1Medical Physics, University of Wisconsin-Madison, Madison, WI, United States, 2Radiology, University of Wisconsin-Madison, Madison, WI, United States, 3Biomedical Engineering, University of Wisconsin-Madison, Madison, WI, United States, 4Animal and Dairy Sciences, University of Wisconsin-Madison, Madison, WI, United States, 5Surgery, University of Wisconsin-Madison, Madison, WI, United States, 6Center for Biomedical Swine Research and Innovation, University of Wisconsin-Madison, Madison, WI, United States, 7Medicine, University of Wisconsin-Madison, Madison, WI, United States, 8Emergency Medicine, University of Wisconsin-Madison, Madison, WI, United States
1Medical Physics, University of Wisconsin-Madison, Madison, WI, United States, 2Radiology, University of Wisconsin-Madison, Madison, WI, United States, 3Biomedical Engineering, University of Wisconsin-Madison, Madison, WI, United States, 4Animal and Dairy Sciences, University of Wisconsin-Madison, Madison, WI, United States, 5Surgery, University of Wisconsin-Madison, Madison, WI, United States, 6Center for Biomedical Swine Research and Innovation, University of Wisconsin-Madison, Madison, WI, United States, 7Medicine, University of Wisconsin-Madison, Madison, WI, United States, 8Emergency Medicine, University of Wisconsin-Madison, Madison, WI, United States
Synopsis
Fibrosis is the sequela of and the most important outcome predictor in chronic liver disease. MRI T2 mapping can provide safe and noninvasive detection/staging of liver fibrosis. However, current T2 mapping techniques suffer from prolonged acquisition times, prohibiting widespread clinical utilization. To address this unmet need, we evaluated the feasibility of a whole-liver, single-breath-hold, phase-based T2 mapping technique to assess liver fibrosis in a human-sized porcine model of liver fibrosis. We demonstrated a strong correlation between our phase-based liver T2 values and liver uptake of the fibroblast activation protein inhibitor on PET as well as the reference spin-echo T2 estimates.
Introduction
Liver fibrosis, a distinguishing feature of almost all chronic liver diseases, is a prognosticator to characterize extent of liver injury1. Appropriate diagnosis and treatment of many chronic liver diseases relies on accurate liver fibrosis staging, which is currently assessed via biopsy. However, biopsy is invasive and prone to sampling/interpretation variability2–8. Noninvasive methods such as MRI are gaining traction as promising methods to stage liver fibrosis9–20.MR elastography is an established technique for quantifying liver stiffness, a biomarker of fibrosis, but is limited by narrow liver coverage and the need for additional hardware11,12,15–17,19–21. T2 mapping methods do not require additional hardware and can serve as a quantitative imaging biomarker of fibrosis21,22, but the standard spin-echo T2 method requires lengthy acquisition times. Therefore, there is an unmet need for rapid, whole-liver T2 mapping to noninvasively assess liver fibrosis.
A novel phase-based T2 mapping method in which T2 is encoded into the phase of a 3D gradient echo (GRE) has demonstrated potential to image whole-liver T2 within a single breath-hold23. However, the ability of this method to serve as an imaging biomarker of fibrosis is unknown. Therefore, the purpose of this work is to study the feasibility of phase-based T2 mapping in a porcine model of alcohol-induced liver fibrosis24, using positron emission tomography (PET) and spin-echo T2 mapping as reference.
Methods
Animals: Animal experiments were conducted under protocols approved by local Institutional Animal Care and Use Committee in accordance with published NIH and USDA guidelines. Four age- and sex-matched male pigs (breed blinded) underwent liver embolization by administering an emulsion of 1:3 (by volume) ethanol:ethiodized oil (Lipiodol, Guerbet, France) through the proper hepatic artery, followed by daily oral alcohol intake for 8 weeks. Imaging was performed before embolization (baseline) and after 8 weeks of oral alcohol intake (endpoint).Imaging: Imaging was performed on a 3.0T PET/MR system (Signa PET/MR, GE Healthcare, Waukesha, WI) using 16-channel anterior array and 14-channel embedded posterior coils, with animals under general anesthesia. Two-point Dixon (for MRI-based attenuation correction), phase-based T2 mapping, multi-echo spin-echo T2 mapping (for reference T2 measurements), and post-contrast T1-weighted (for anatomic localization) sequences were acquired. Table 1 summarizes the T2 mapping image acquisition parameters.
Gallium-68-labeled fibroblast activation protein inhibitor (68Ga-FAPI-46, herein: FAPI) was administered intravenously (0.1 mCi/kg). FAPI targets the fibroblast activation protein expressed on the surface of liver stellate cells (which cause liver fibrosis) in vivo. PET and MRI were acquired in the same session. A static PET image was generated at 60 minutes post radiotracer injection, using the PET data at 60-69 min.
Analysis: Phase-based T2 maps were generated using the method described by Wang et al. with a T1 of 1000 ms used for the lookup table23. Due to the heterogeneity of liver fibrosis in this model (due to preferential liver arterial flow carrying different volumes of the embolic emulsion to different liver regions), elliptical regions of interest (ROIs) were placed on the phase-based T2 maps, spin-echo T2 maps, and PET images in the following manner: one in the right lobe of the liver at baseline, one in a fibrotic area at endpoint, and one in a spared area at endpoint (as determined by PET). Since phased-based T2 maps were acquired at different breath-hold positions than PET and at different slice locations than spin-echo T2 maps, care was taken to place the ROIs in the same anatomical region. Average T2 value and FAPI uptake on PET as measured by SUVmean (herein SUV) for each ROI were recorded. Linear regression was performed to compare phase-based T2 to reference spin-echo T2 and SUV.
Results
Figure 1 demonstrates PET/MR images in a single animal at baseline and endpoint; the fibrotic area demonstrates increased FAPI uptake and T2 values relative to both normal liver at baseline and to spared liver regions at endpoint. Linear regression demonstrates good correlation between liver phase-based T2 and reference spin-echo T2 (Figure 2). Similarly, a strong linear correlation was noted between liver phase-based T2 and SUV, across the range of normal liver at baseline and spared and fibrotic liver regions at endpoint (Figure 3).Discussion and Conclusions
We successfully demonstrated the feasibility of phase-based T2 mapping for assessment of liver fibrosis in a porcine model of alcohol-induced liver fibrosis. To the best of our knowledge, T2 mapping for fibrosis has not been previously demonstrated in a porcine model of liver fibrosis. In addition, simultaneous FAPI PET data allowed for additional correlation between functional information regarding liver fibrosis and our phase-based T2 mapping results.Limitations of this work include small number of subjects and utilization of only a 3.0T platform for T2 mapping. This study is further limited by using multi-echo spin-echo (prone to motion artifacts) as a reference for T2, using FAPI PET as a reference for fibrosis, and absence of histologic staging; however, success of this model in achieving liver fibrosis has been demonstrated in the literature19. Future studies will be designed to correlate T2 with histologic stage of fibrosis. This study demonstrates the possibility of phase-based T2 mapping as a rapid, accurate imaging biomarker of fibrosis stage. Further studies in patients with chronic liver disease and fibrosis are needed.
Acknowledgements
The authors wish to acknowledge support from the NIH (R01-DK100651, UL1-TR00427, R01-DK117354), as well as GE Healthcare who provides research support to the University of Wisconsin. Ruvini Navaratna is supported by an NIH Metabolism and Nutrition Training Program (MANTP) T32 Fellowship (T32-DK007665). Sarvesh Periyasamy is supported by NIH funding through an NCI F30 fellowship (F30CA250408) and an NIGMS T32 Award (T32GM140935). Dr. Reeder is a Romnes Faculty Fellow and has received an award provided by the University of Wisconsin-Madison Office of the Vice Chancellor for Research and Graduate Education with funding from the Wisconsin Alumni Research Foundation. Finally, the authors also wish to acknowledge SOFIE who provided the FAPI-46 precursor.References
- Angulo P, Kleiner DE, Dam-Larsen S, et al. Liver Fibrosis, but no Other Histologic Features, Associates with Long-term Outcomes of Patients With Nonalcoholic Fatty Liver Disease. Gastroenterology. 2015;149(2):389-397.e10. doi:10.1053/j.gastro.2015.04.043
- Sumida Y, Nakajima A, Itoh Y. Limitations of liver biopsy and non-invasive diagnostic tests for the diagnosis of nonalcoholic fatty liver disease/nonalcoholic steatohepatitis. World J Gastroenterol WJG. 2014;20(2):475-485. doi:10.3748/wjg.v20.i2.475
- Rousselet M-C, Michalak S, Dupré F, et al. Sources of variability in histological scoring of chronic viral hepatitis. Hepatol Baltim Md. 2005;41(2):257-264. doi:10.1002/hep.20535
- Soloway RD, Baggenstoss AH, Schoenfield LJ, Summerskill WH. Observer error and sampling variability tested in evaluation of hepatitis and cirrhosis by liver biopsy. Am J Dig Dis. 1971;16(12):1082-1086. doi:10.1007/BF02235164
- Goldin RD, Goldin JG, Burt AD, et al. Intra-observer variation in the histopathological assessment of chronic viral hepatitis. J Hepatol. 1996;25(5):649-654. doi:10.1016/S0168-8278(96)80234-0
- Maharaj B, Leary WP, Naran AD, et al. Sampling variability and its influence on the diagnostic yield of percutaneous needle biopsy of the liver. The Lancet. 1986;327(8480):523-525. doi:10.1016/S0140-6736(86)90883-4
- Regev A, Berho M, Jeffers LJ, et al. Sampling error and intraobserver variation in liver biopsy in patients with chronic HCV infection. Am J Gastroenterol. 2002;97(10):2614-2618. doi:10.1111/j.1572-0241.2002.06038.x
- Bedossa P, Dargère D, Paradis V. Sampling variability of liver fibrosis in chronic hepatitis C. Hepatology. 2003;38(6):1449-1457. doi:10.1016/j.hep.2003.09.022
- Faria SC, Ganesan K, Mwangi I, et al. MR Imaging of Liver Fibrosis: Current State of the Art. RadioGraphics. 2009;29(6):1615-1635. doi:10.1148/rg.296095512
- Wegrzyniak O, Rosestedt M, Eriksson O. Recent Progress in the Molecular Imaging of Nonalcoholic Fatty Liver Disease. Int J Mol Sci. 2021;22(14):7348. doi:10.3390/ijms22147348
- Singh S, Venkatesh SK, Wang Z, et al. Diagnostic performance of magnetic resonance elastography in staging liver fibrosis: a systematic review and meta-analysis of individual participant data. Clin Gastroenterol Hepatol Off Clin Pract J Am Gastroenterol Assoc. 2015;13(3):440-451.e6. doi:10.1016/j.cgh.2014.09.046
- Yin M, Talwalkar JA, Glaser KJ, et al. Assessment of Hepatic Fibrosis With Magnetic Resonance Elastography. Clin Gastroenterol Hepatol. 2007;5(10):1207-1213.e2. doi:10.1016/j.cgh.2007.06.012
- Yin M, Glaser KJ, Talwalkar JA, Chen J, Manduca A, Ehman RL. Hepatic MR Elastography: Clinical Performance in a Series of 1377 Consecutive Examinations. Radiology. 2016;278(1):114-124. doi:10.1148/radiol.2015142141
- Huwart L, Sempoux C, Salameh N, et al. Liver Fibrosis: Noninvasive Assessment with MR Elastography versus Aspartate Aminotransferase–to-Platelet Ratio Index. Radiology. 2007;245(2):458-466. doi:10.1148/radiol.2452061673
- Huwart L, Peeters F, Sinkus R, et al. Liver fibrosis: non-invasive assessment with MR elastography. NMR Biomed. 2006;19(2):173-179. doi:10.1002/nbm.1030
- Rouvière O, Yin M, Dresner MA, et al. MR elastography of the liver: preliminary results. Radiology. 2006;240(2):440-448. doi:10.1148/radiol.2402050606
- Yin M, Woollard J, Wang X, et al. Quantitative assessment of hepatic fibrosis in an animal model with magnetic resonance elastography. Magn Reson Med. 2007;58(2):346-353. doi:10.1002/mrm.21286
- Talwalkar JA, Yin M, Fidler JL, Sanderson SO, Kamath PS, Ehman RL. Magnetic resonance imaging of hepatic fibrosis: Emerging clinical applications. Hepatology. 2008;47(1):332-342. doi:10.1002/hep.21972
- Huwart L, Salameh N, ter Beek L, et al. MR elastography of liver fibrosis: preliminary results comparing spin-echo and echo-planar imaging. Eur Radiol. 2008;18(11):2535-2541. doi:10.1007/s00330-008-1051-5
- Huwart L, Sempoux C, Vicaut E, et al. Magnetic resonance elastography for the noninvasive staging of liver fibrosis. Gastroenterology. 2008;135(1):32-40. doi:10.1053/j.gastro.2008.03.076
- Hoffman DH, Ayoola A, Nickel D, Han F, Chandarana H, Shanbhogue KP. T1 mapping, T2 mapping and MR elastography of the liver for detection and staging of liver fibrosis. Abdom Radiol N Y. 2020;45(3):692-700. doi:10.1007/s00261-019-02382-9
- Luetkens JA, Klein S, Träber F, et al. Quantification of Liver Fibrosis at T1 and T2 Mapping with Extracellular Volume Fraction MRI: Preclinical Results. Radiology. 2018;288(3):748-754. doi:10.1148/radiol.2018180051
- Wang X, Hernando D, Reeder SB. Phase-based T2 mapping with gradient echo imaging. Magn Reson Med. 2020;84(2):609-619. doi:https://doi.org/10.1002/mrm.28138
- Gaba RC, Mendoza-Elias N, Regan DP, et al.
Characterization of an Inducible Alcoholic Liver Fibrosis Model for
Hepatocellular Carcinoma Investigation in a Transgenic Porcine Tumorigenic
Platform. J Vasc Interv Radiol JVIR. 2018;29(8):1194-1202.e1.
doi:10.1016/j.jvir.2018.03.007
Figures

Table 1. MR
T2-mapping image acquisition parameters. All acquisitions were performed at 3.0T. ARC =
Autocalibrating reconstruction for cartesian imaging. FOV = field of view.
TR = repetition time. TE = echo time.
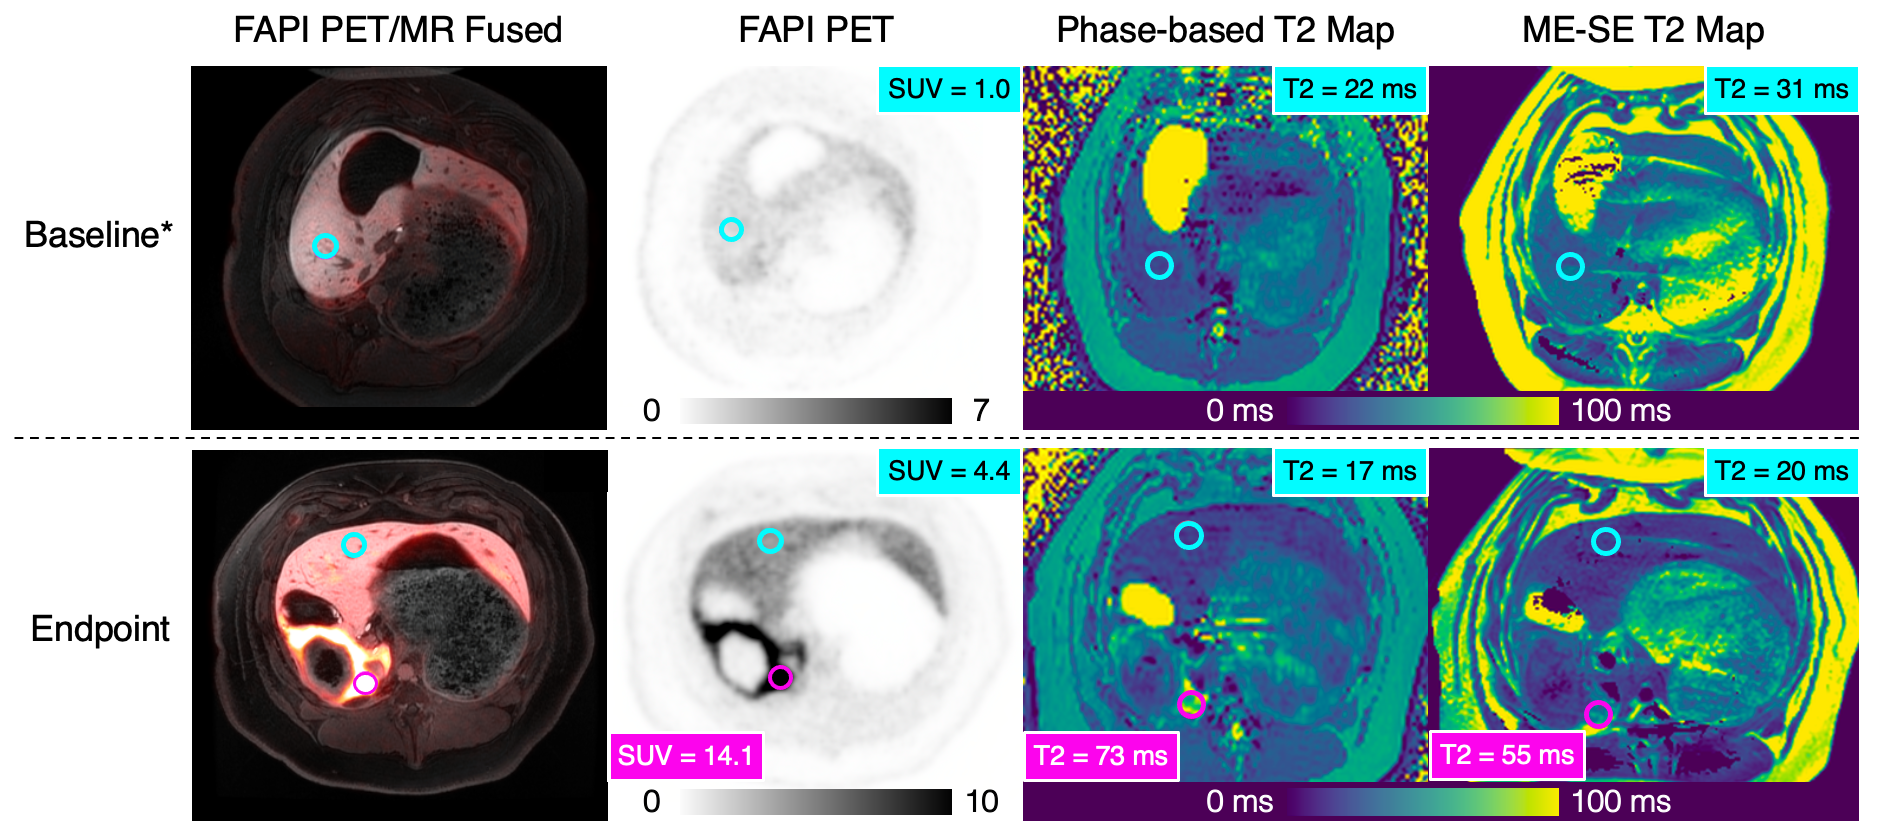
Figure 1. FAPI
PET and MR T2 mapping detect liver fibrosis. Top row: FAPI PET images demonstrate low-level FAPI
uptake in the liver at baseline. Bottom row: At endpoint, PET images
demonstrate avid FAPI uptake in the embolized region (SUV = 14.1) and only
slightly increased uptake in spared regions (SUV = 4.4). Phase-based and multi-echo
spin-echo (ME-SE) T2 maps demonstrate increased T2 values in the fibrotic
region with relatively unchanged T2 values in the spared regions. *Animal tilt
occurred in-between T2 mapping and PET acquisitions.

Figure 2.
Phase-based T2 values demonstrate good linear correlation with reference
spin-echo T2 values across normal and fibrotic liver regions. Phase-based T2 average ROI values were
plotted against corresponding reference multi-echo spin-echo average T2 ROI values
for all animals. For each animal, three ROIs were drawn: one in the right lobe
of the liver at baseline (green triangle), one in a spared area at endpoint
(yellow circle), and one in a fibrotic area at endpoint (red square).
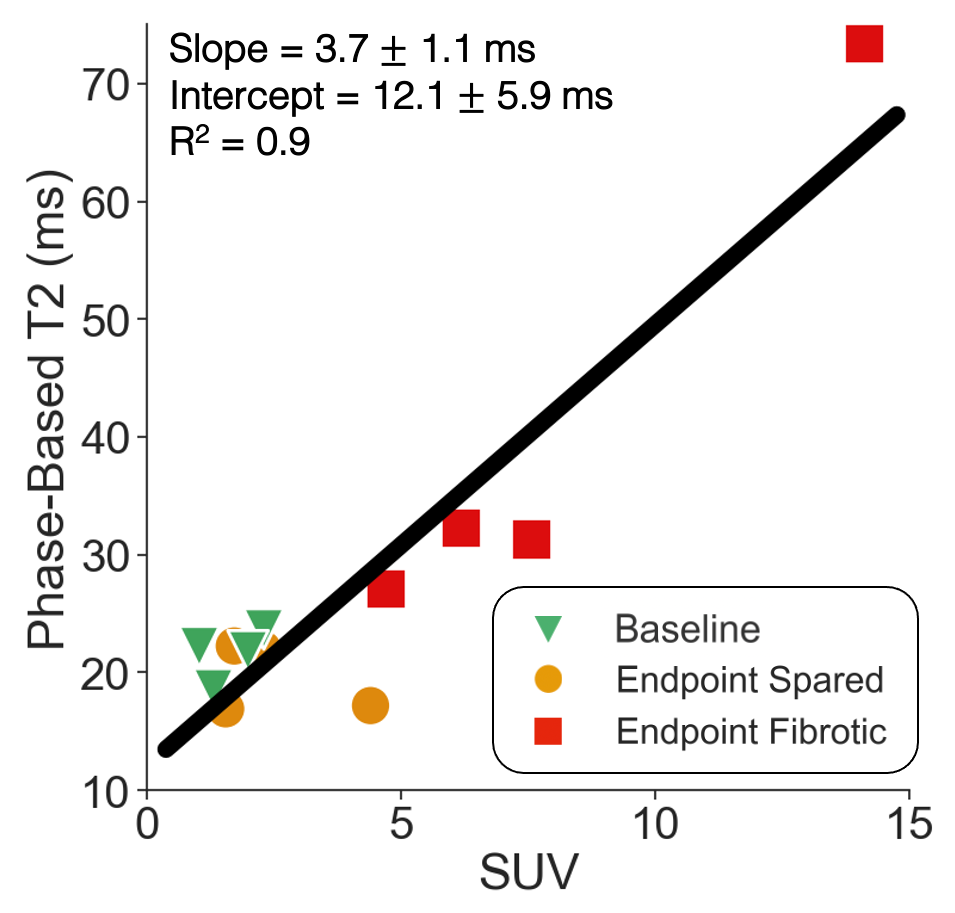
Figure 3.
Phase-based T2 values demonstrate strong linear correlation with FAPI PET SUV
across normal and fibrotic liver regions. Phase-based T2 average ROI values were plotted against
corresponding FAPI PET SUV values for all animals. For each animal, three ROIs
were drawn: one in the right lobe of the liver at baseline (green triangle),
one in a spared area at endpoint (yellow circle), and one in a fibrotic area at
endpoint (red square).
DOI: https://doi.org/10.58530/2022/3276