3275
Comparison of different T2 fitting models in renal tissue relaxometry
Wan-Ting Zhao1,2,3, Karl-Heinz Herrmann1, Martin Krämer1, Daniel Güllmar1, Jürgen R. Reichenbach1, and Verena Hoerr1,4,5
1Institute of Diagnostic and Interventional Radiology, University Hospital Jena, Jena, Germany, 2Center for Sepsis Control and Care, University Hospital Jena, Jena, Germany, 3Institute of Medical Microbiology, University Hospital Jena, Jena, Germany, 4Clinic for Radiology, University Hospital Muenster, Muenster, Germany, 5Heart Center, University Hospital Bonn, Bonn, Germany
1Institute of Diagnostic and Interventional Radiology, University Hospital Jena, Jena, Germany, 2Center for Sepsis Control and Care, University Hospital Jena, Jena, Germany, 3Institute of Medical Microbiology, University Hospital Jena, Jena, Germany, 4Clinic for Radiology, University Hospital Muenster, Muenster, Germany, 5Heart Center, University Hospital Bonn, Bonn, Germany
Synopsis
While relaxation rate estimation substantially varies on the chosen fitting method, a tissue-specific T2 fitting scheme for the kidney is lacking. The current study aims to compare multiple T2 fitting methods, including square signal and mono-exponential with constant offsets, in high SNR and low SNR scenarios from identical data points. We compare standard deviations for fitting robustness and RMSE for the goodness of fit. Our finding suggests a mono-exponential with constant offsets is the most suitable method, for it yielded the lowest RMSE both in high and low SNR.
Introduction
T2 mapping is a magnetic resonance imaging (MRI) technique used to quantify the T2 relaxation-time and is commonly applied in clinics to diagnose the early signs of pathological tissue changes. T2-mapping is of great importance in the evaluation of ischemia-reperfusion and acute kidney injury 1,2. To date, the most straightforward technique for T2-relaxometry is the prospectively-gated multi-echo spin-echo (MSME) sequence. However, in the scenario of irregular motion (such as dyspnea), it is prone to artifactual errors in the T2 values. Previously, several extensions of mono-exponential fitting models have been reported to account for potentially noisy data at the later time points in image series (i.e. at the later time points of the T2-decay curve), such as data truncation and adding constant offset 3-4. Alternatively, preprocess the data by calculating the square of the signal magnitude component to make the noise levels additive, and thus, to correct for the erroneous T2 values by dampening the corresponding ripples in the T2-decay curve caused by the noisy echo images 5. However, how much signal can square signal correct in low SNR and the impact of offset is not is lack of clear comparison in kidney. In this study, different fitting models were implemented on an identical dataset of renal T2 mapping and were compared to each other by their robustness.Materials and Methods
A healthy Sprague Dawley rat was measured on a 9.4 T MRI system (Bruker, Ettlingen, Germany) using a vendor-supplied volume quadrature coil. After a B0-mapping and localized shimming of both kidneys, an axial oblique slice of T2-mapping was acquired by the variable repetition rapid acquisition with enhanced relaxation (RARE-VTR) sequence (TR/TE=180-5000/14-154 ms, 6 echoes, 10 repetitions, RARE-factor=4, matrix size=128x128, FOV= (60*60) mm2). ROIs on the cortex and medulla were carefully drawn to avoid perirenal fat-induced chemical shift. All T2 fitting schemes on the selected regions used an identical mask. All fittings were performed by using a nonlinear least square method 6. The T2 fitting models incorporated in this study were: A) mono-exponential with two parameters (“mono”); B) mono-exponential with a constant offset and 3 parameters (“mono + offset”), which were taken from the initial value in A; C) square of the signal magnitude component multiplied with a mono-exponential term (“signal square”); D) square of the signal magnitude component multiplied with a mono-exponential term plus offset (“single square + offset”). To avoid the effects of Rician distribution of noisy data on later echoes, the signal-to-noise-ratio (SNR) of the corresponding data was firstly examined, and the echoes with SNR<2 were truncated as suggested7. By presuming the noise distribution as Gaussian, the mean, standard deviation (Std.) and root-mean-sum-of-squares (RMSE) were finally used to evaluate the signal accuracy, precision, and the goodness of fit respectively. A comparison between high SNR (TR=5000 ms) and low SNR (TR=500 ms) data of the renal cortex and medulla is presented in table 1.Results
On identical acquired data points, adding a constant offset will allow for compensating for instrumentational noise and susceptibility on the cortical/medullary interface (Figure 1). The voxel (figure1Figure 2-c) that is slightly higher than averaged fitting traces is giving a fitting error (black arrow), although no artifact was observed on the image voxel. This fitting error eventually led to an increase in the mean and standard deviation of T2 values from47.3±2.8 to 57.6±3.6. Figure 2 demonstrates a comparison of multiple T2 fitting schemes on the cortex in a low SNR scenario. On a given ROI with identical voxel numbers, we test the RMSE for robustness. From the fitting itself, the mono-exponential with constant offset has the lowest RMSE, indicating the fitting is better than square the signal intensity in kidney T2 mapping. Notably, the high standard deviation in figure 2-(B) indicates the magnetization in TR500 may not have fully relaxed. Lastly, Table 1 shows the numerical results of T2 fitting schemes in renal tissues—both in high and low SNR scenarios, a mono-exponential with offset yields the lowest RMSE. To our surprise, squaring the signals does not have a significant improvement in accuracy and precision of the fitting in low SNR scenario because the std/mean remained in similar order as other models.Discussion
As in vivo measurement does not consist of a ground truth T2 value, the accuracy of the T2 value in low SNR (TR= 500 ms) was confirmed to its high SNR scenario (TR=5000 ms). The accuracy and precision order is mono>signal square> signal square + offset> mono+ offset. The same order applies to the medulla. One should consider fitting with a constant in high SNR data and a mono-exponential in low SNR. It has been examined that powering the magnitude image with a factor of two and subsequently subtracting the mean noise level for preprocessing has been beneficial to accurate T2 value5-6; however, it does not appeal significantly in the current in vivo setting.Conclusion
Adding constant offset to mono-exponential is beneficial in enhancing fitting performance, accuracy then square signals in kidney T2 data. As TR=500 is a frequent-chose value for MSME-based kidney T2 map to shorten acquisition time, we suggest a longer TR is for a more accurate T2 value.Acknowledgements
No acknowledgement found.References
[1] Pohlmann, A. et al. (2014) Invest Radio.Vol.49 No.8[2] Zhao, W.-T. et al. (2020) Proceeding on ISMRM[3] Wood JC et al., 2005. Blood. 106(4):1460-5.[4] Yin X et al., 2010. NMR Biomed. 23(10):1127-36[5] Miller, A. J. et al. (1993) Mag Res Img; Vol.11, pp1051-1056[6] Schweser, F. et al. (2014) Proceeding on ISMRM[7] Gudbjartsson, H. et al. (1995) Mag Res Med; Vol. 34 pp910-914.Figures
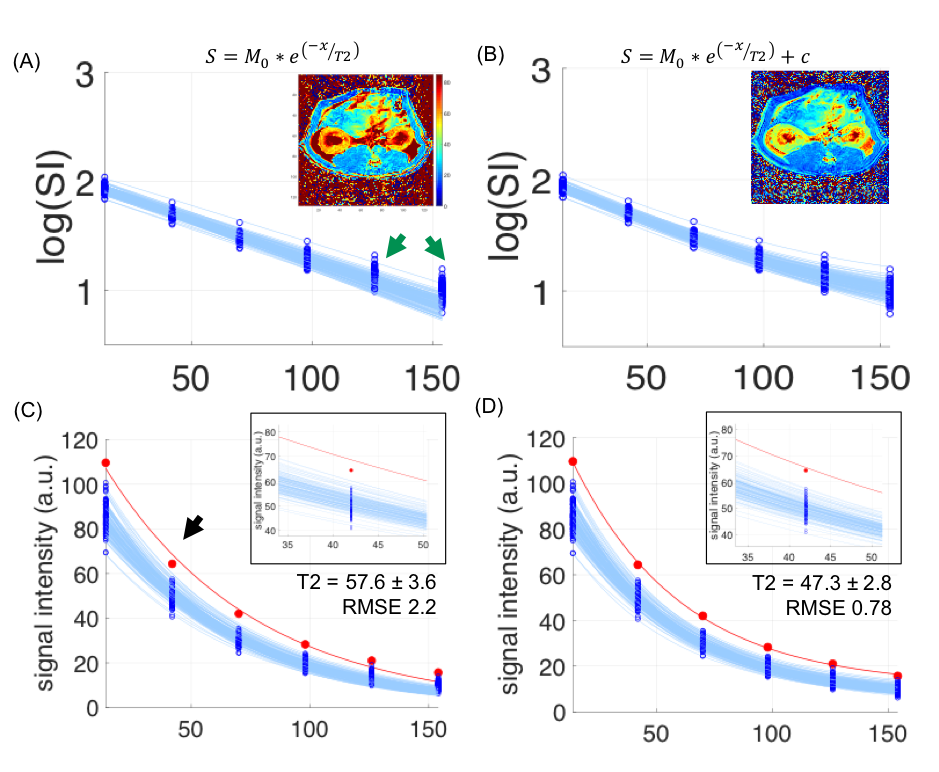
Figure 1. Adding constant offset on cortical fitting result in better fitting. (A) mono-exponential fitting, green arrows showed later echoes are more likely to yield fitting error due to low SNR.(C) original traces on mono-exponential fitting. Red dots indicate a voxel that is slightly higher than averaged fitting traces is giving a large fitting error (black arrow) and eventually increasing T2 value. On the contrary, mono-exponential with offset properly accommodate all the acquired data point with small RMSE, as shown in (B) and (D).

Figure 2. Comparison of multiple T2 fitting schemes on cortex tissue in low SNR scenario. On a given ROI with identical voxel numbers, we test the RMSE for robustness. From the fitting itself (B) has the lowest RMSE, indicating the fitting is better using constant offsets than square the signal intensity in kidney T2 mapping.
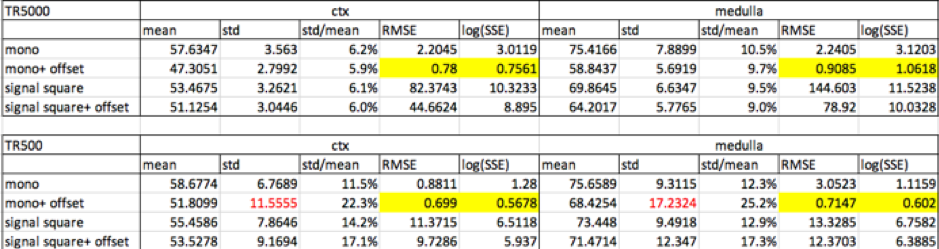
Table.1: T2 fitting schemes in renal tissues.
DOI: https://doi.org/10.58530/2022/3275