3269
Quantitative cerebrovascular reactivity MRI in mice using acetazolamide challenge1Russell H. Morgan Department of Radiology and Radiological Science, Johns Hopkins University School of Medicine, Baltimore, MD, United States, 2F. M. Kirby Research Center for Functional Brain Imaging, Kennedy Krieger Research Institute, Baltimore, MD, United States, 3Department of Biomedical Engineering, Johns Hopkins University School of Medicine, Baltimore, MD, United States, 4Department of Psychiatry and Behavioral Sciences, Johns Hopkins University School of Medicine, Baltimore, MD, United States, 5The Solomon H. Snyder Department of Neuroscience, Johns Hopkins University School of Medicine, Baltimore, MD, United States
Synopsis
Cerebrovascular reactivity (CVR), which denotes brain’s vasodilatory capacity, is broadly utilized in cerebrovascular and neurodegenerative diseases. However, the most popular hypercapnia method in human studies is unsuitable for small animals due to the difficulty in measuring end-tidal CO2. Here, we took a different approach using a pharmacological vasodilatory stimulus, acetazolamide. Plasma level of acetazolamide and vascular responses were quantified by high-performance liquid chromatography and perfusion MRI, respectively. Evidences of feasibility, safety, temporal characteristics, and dose-dependence have been demonstrated. This new CVR technique may open several avenues for preclinical research on cerebrovascular diseases and therapeutic testing in different animal models.
INTRODUCTION
Cerebrovascular reactivity (CVR), denoting the brain’s vasodilatory capacity,1 is generally measured with vasoactive challenges (CO2 inhalation2) in humans. Measurements of both input (e.g. end-tidal CO2) and output (e.g. cerebral blood flow (CBF) signal) are required to calculate CVR. Different from the abundant reports on human CVR investigations, there is a scarcity of techniques or reports of quantitative CVR mapping in mice, primarily due to the difficulty in determining mouse end-tidal CO2. In this study, we took a different approach, namely using the pharmacological vasodilatory stimulus of acetazolamide. To confirm that the observed vascular responses is attributed to acetazolamide injection rather than other factors such as time-dependent changes in anesthesia level or hemodilution effect of fluid injection, we compared the result of acetazolamide injection with those of phosphate-buffered saline (PBS) injection and no injection. Dose dependence of vascular responses on acetazolamide was also investigated. Both global and regional CVR measurements were demonstrated.METHODS
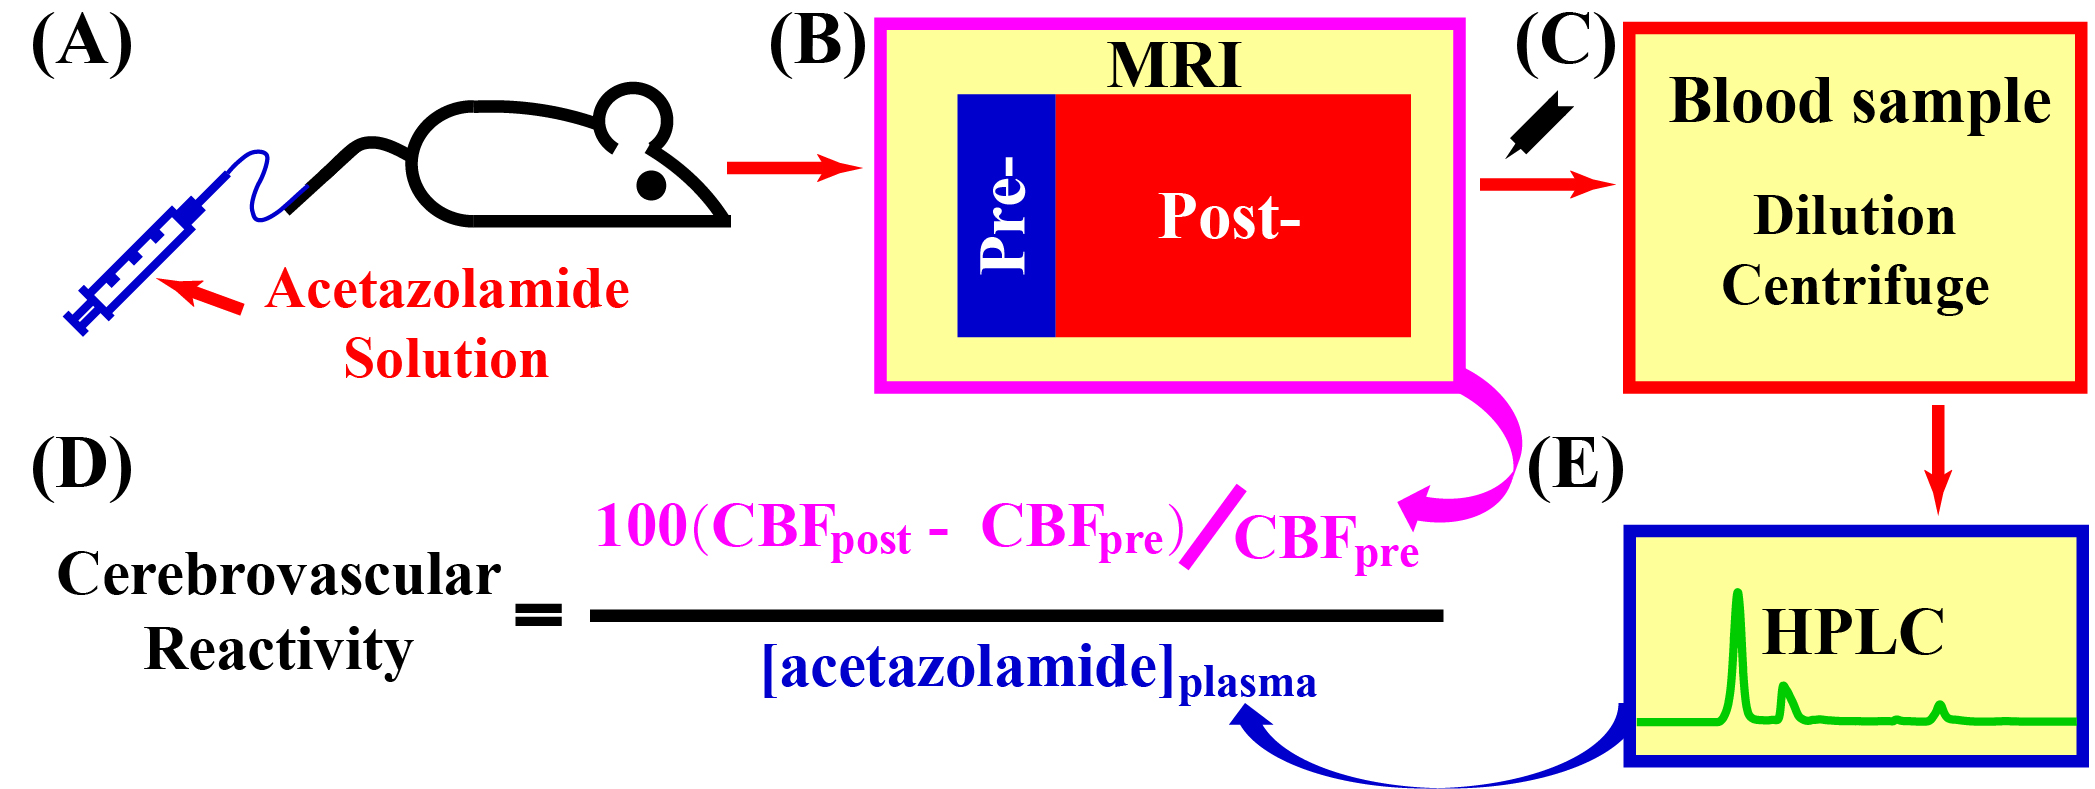
All experiments were approved by local IACUC. CVR MRI with acetazolamide challenge consisted of animal preparation, MRI scan (11.7T Bruker system) with acetazolamide injection, blood sample collection and processing, and high-performance liquid chromatography (HPLC) analyses (Figure 1). CVR was defined as CVR=100(CBFpost-CBFpre)/CBFpre/[acetazolamide]plasma, where CBFpre and CBFpost denotes CBF measured by phase-contrast (PC) or pseudo-continuous-arterial-spin-labeling (pCASL) MRI at pre-injection and post-injection, respectively; [acetazolamide]plasma denotes the plasma level of acetazolamide (hematocrit and dilution were accounted for); the unit of CVR is %/[μg/ml]. Five C57BL/6 female male (43~46 weeks) were studied with each undergoing seven scan sessions in three sub-studies focusing on vascular response characterization, dose dependence, and regional CVR mapping, respectively.Study 1: Characterization of vascular response following acetazolamide injection. Three injection regimens (30 mg/kg acetazolamide injection, PBS injection and no injection) were compared to demonstrate relationship between acetazolamide injection and CBF changes. Each session was composed of a pre-injection period (12 minutes) and a post-injection period (60 minutes), during which dynamic PC MRI were collected (parameters as reported3,4) continuously.
Study 2: Dose dependence of CBF response to acetazolamide. Four different doses (30, 60, 120, and 180 mg/kg) were studied in each mouse (≥72 hours apart). Injection volumes (6 µl/g) were kept the same. The MRI protocol in Study 1 was used, and order of receiving doses was randomized.
Study 3: Feasibility of regional CVR mapping. PC and pCASL MRI (two-scan scheme as reported3,5) were first utilized to measure global and regional pre-injection CBF. Acetazolamide injection (volume of 6 µl/g at the rate of 150 µl/min) then took place. PC and pCASL MRI scans were repeated 10 min after injection. After all sessions, mice were kept for ≥6 months to monitor any long-term side effects induced by acetazolamide injections and associated MRI experiments.
Linear mixed-effect (LME) model and analysis of variance (ANOVA) were used for statistical analyses (significance level at P<0.05).
RESULTS AND DISCUSSION
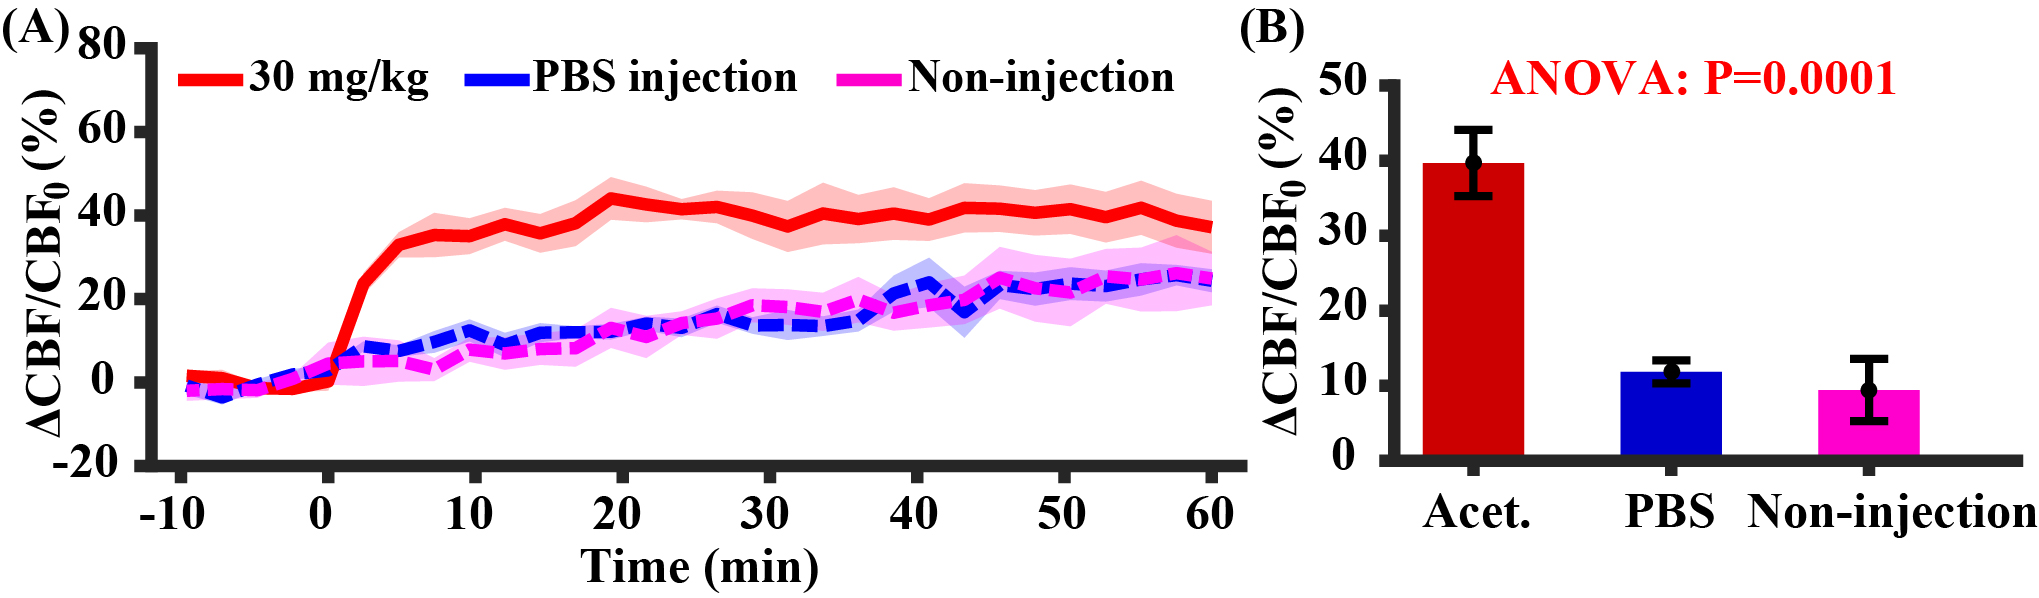
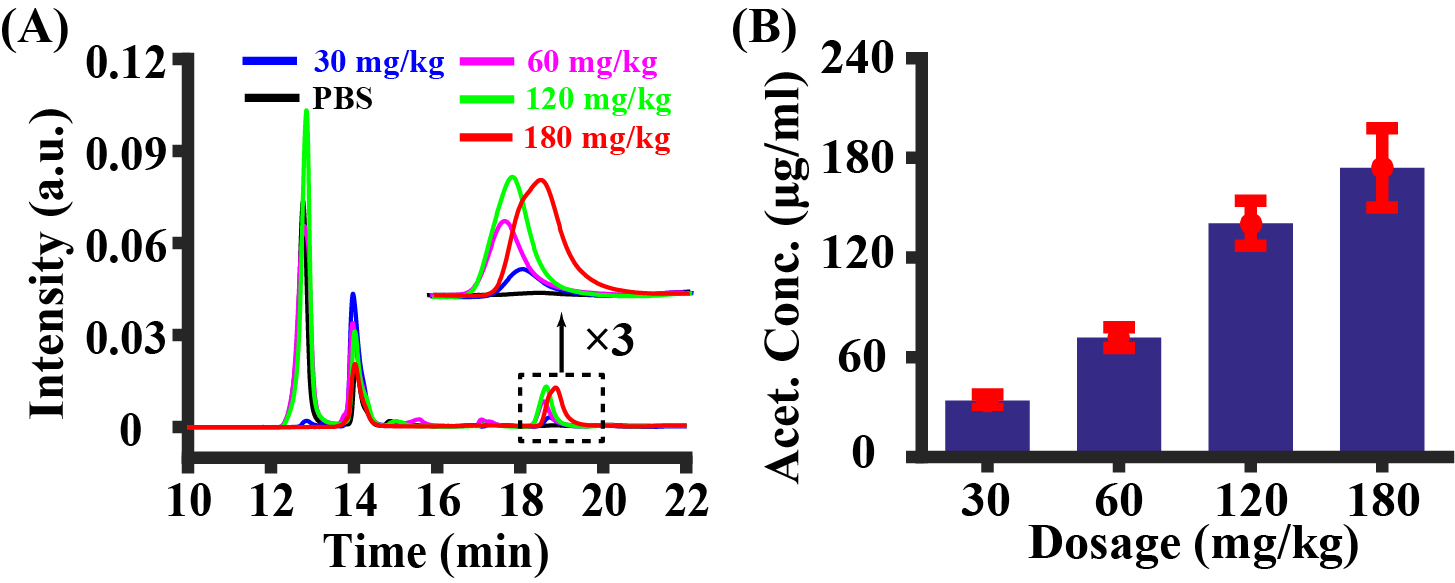
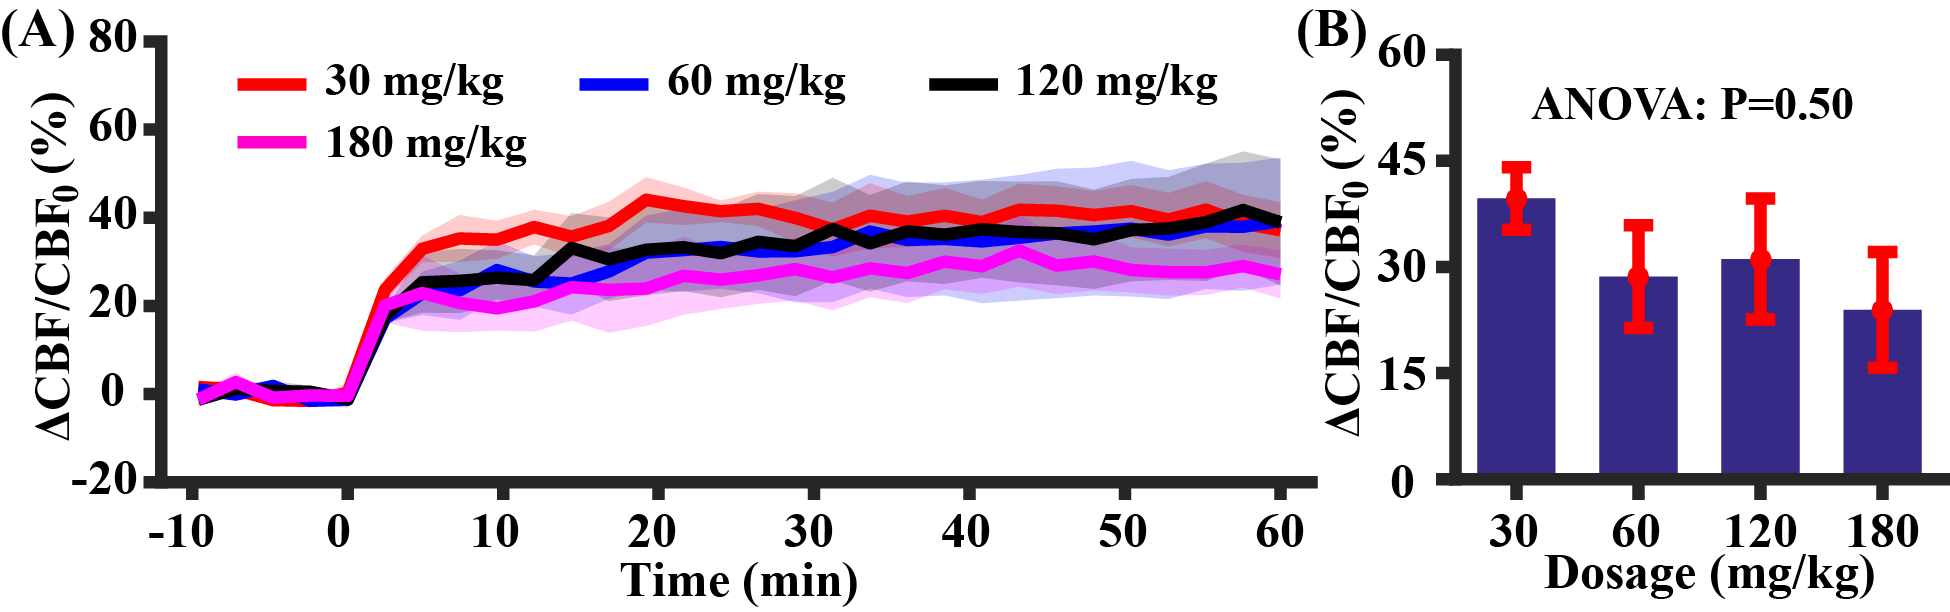
Study 1: Figure 2A shows CBF responses to the injection of acetazolamide (injection started at time 0 min), in comparison with PBS injection and no fluid injection. There was an exponential increase in CBF, i.e. y=39.7%(1-e-x/1.62), following acetazolamide injection, which gradually reached a plateau. There was a significant difference in CBF responses among different injection regimens (time-by-injection-regimen effect of LME: P<0.0001). Averaged CBF changes at 10-20 min was 99.8% of the steady-state value (last 10 min), therefore time window of 10-20 min was used for later quantification. There was a significant difference in averaged CBF changes over the three injection regimens (Figure 2B, ANOVA: P=0.0001). PBS injection and no injection possessed similar averaged CBF changes (Post-hoc Tukey’s honest test: P=0.89), suggesting minimal hemodilution effect at current injection volume (6 µl/g).Study 2: As demonstrated in Figure 3, HPLC revealed a linearity between injection dose and plasma concentration of acetazolamide ([acetazolamide]plasma=1.04dose, R2=0.76, P<0.0001). Dynamic curves of CBF changes (Figure 4A) were similar at the four investigated doses (dose coefficient of LME: P=0.16). The averaged CBF changes revealed an absence of difference (Figure 4B, ANOVA: P=0.50). These data suggested that further increasing dose >30mg/kg did not provide additional benefit to the detection of vascular response.
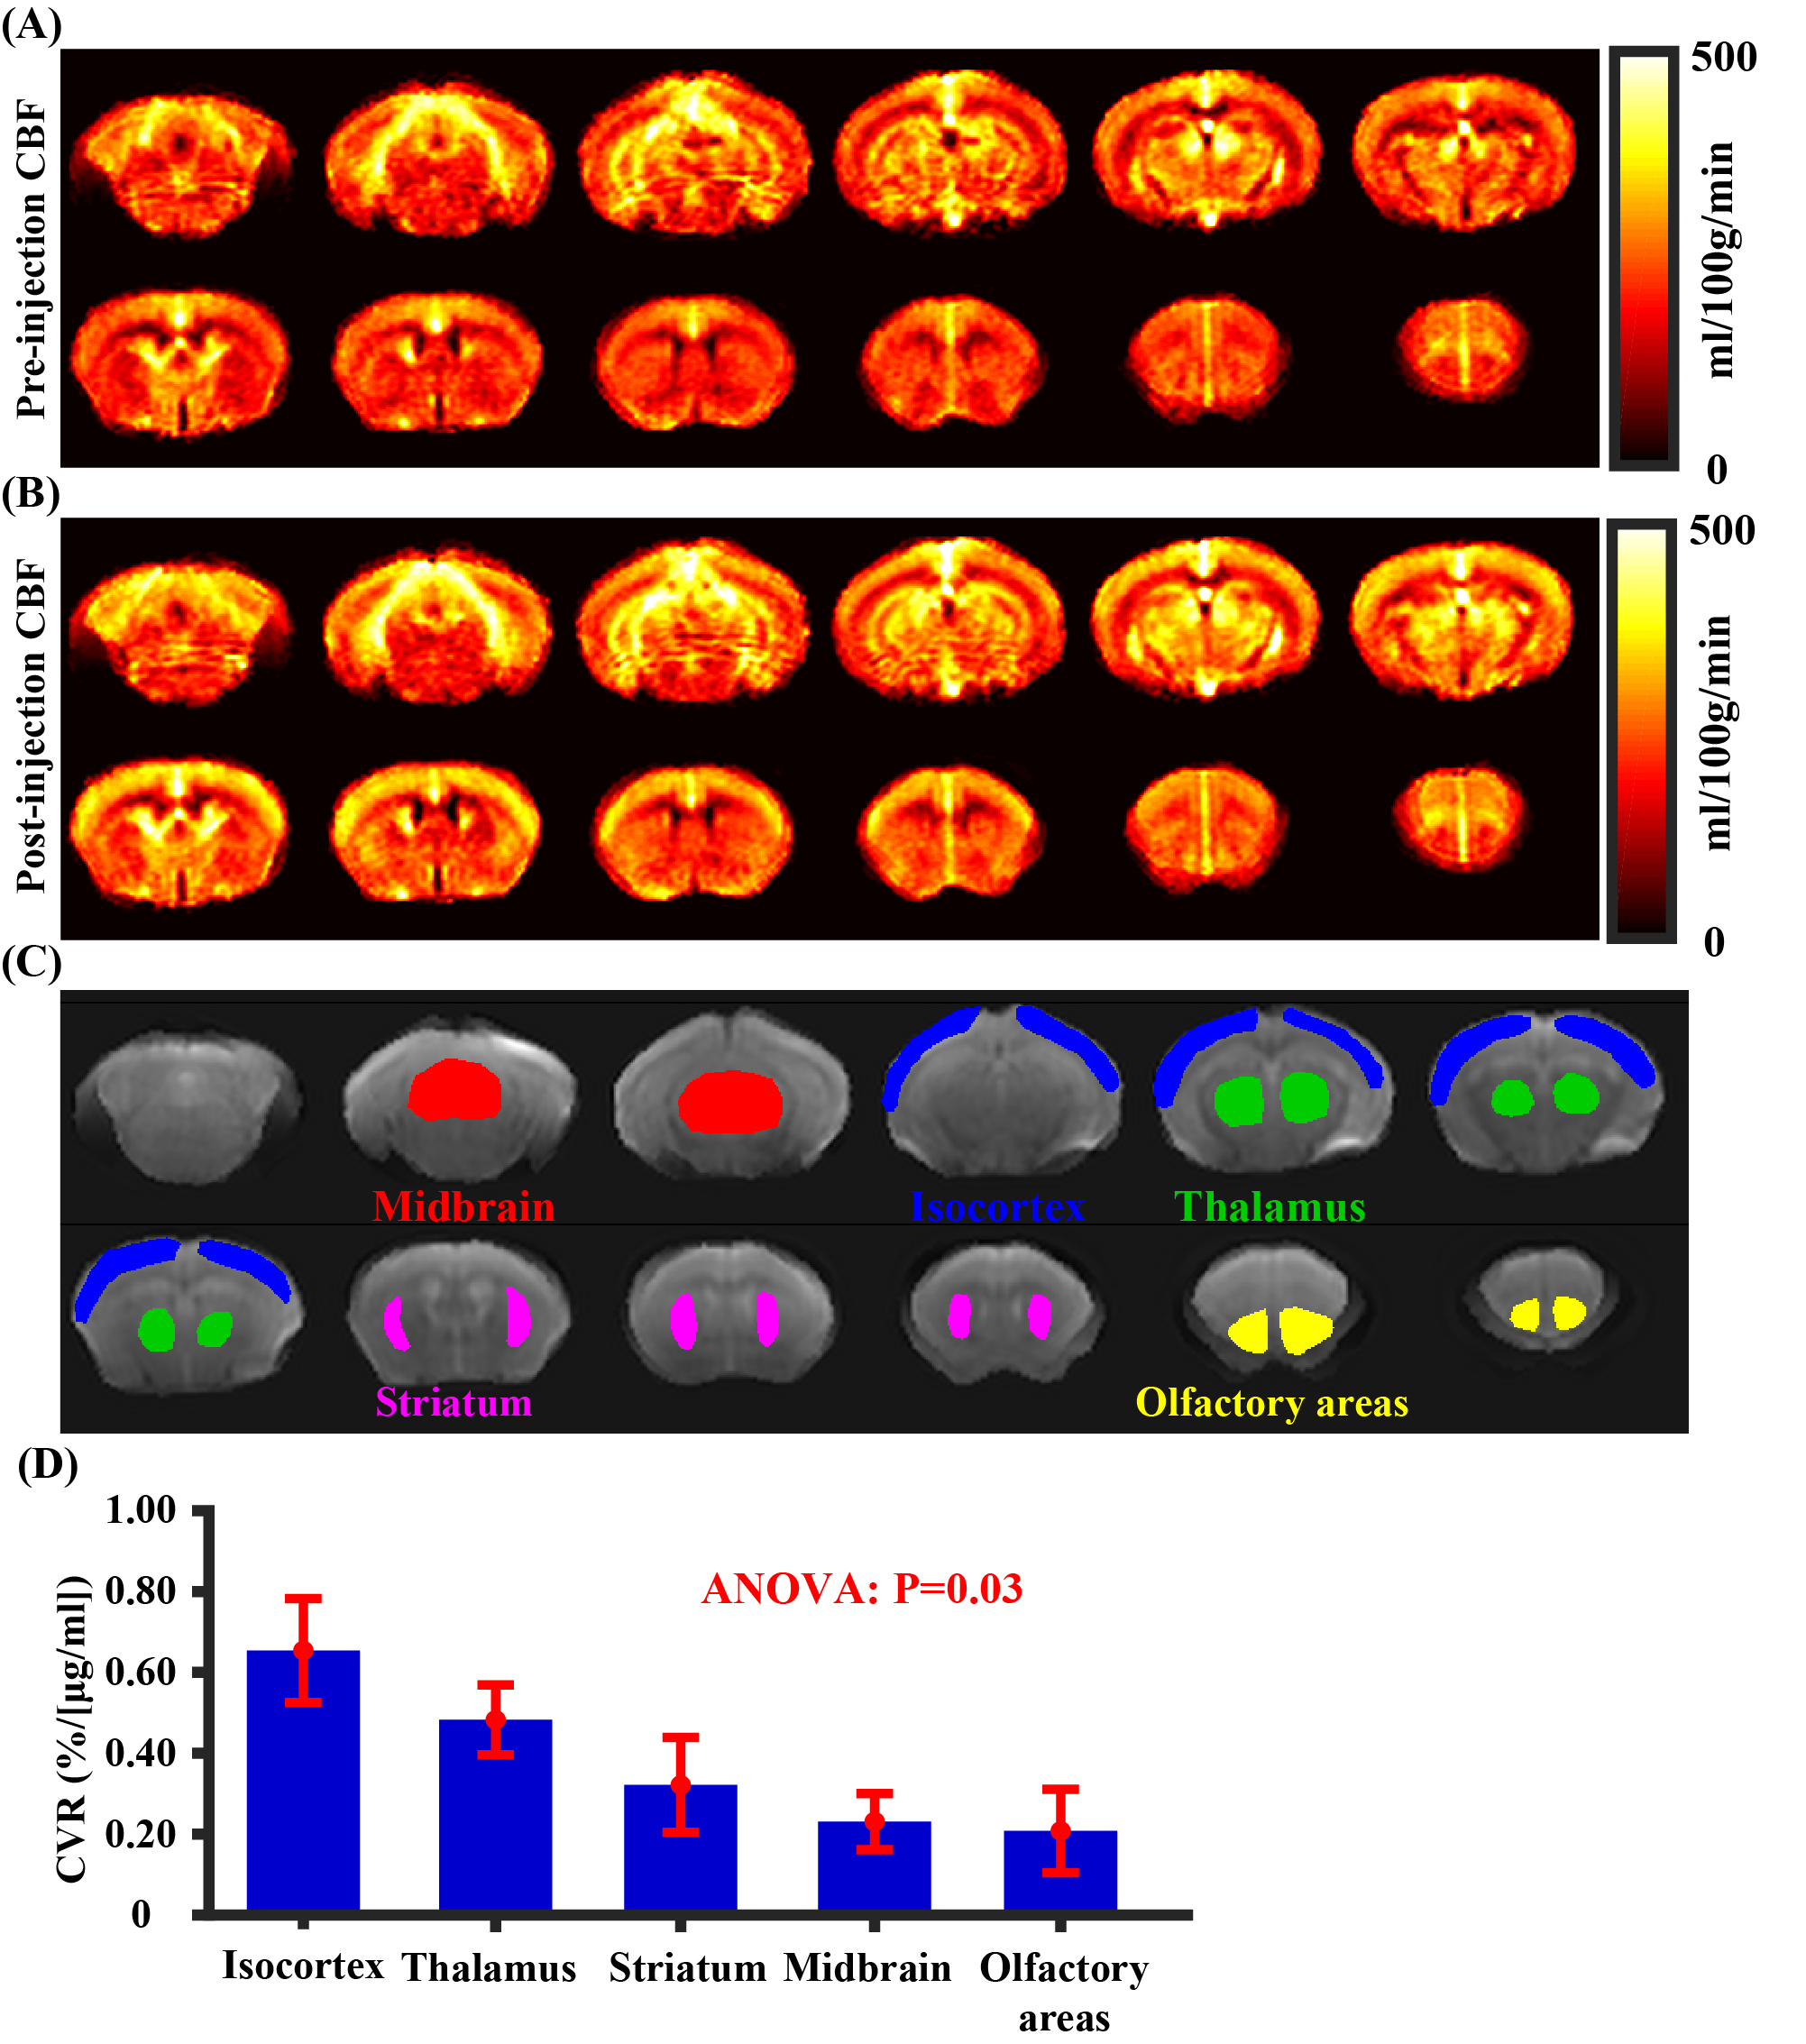
Study 3: Figures 5A and 5B show group averaged CBF maps (N=5) during pre-injection and post-injection periods, respectively. Visual inspection suggested that CBF was increased throughout the brain due to acetazolamide administration. Whole-brain CVR values were 0.433±0.047 %/[μg/ml] (N=5). Figure 5D displays regional CVR values including midbrain, thalamus, isocortex, striatum, and olfactory areas. ANOVA analysis revealed a significant difference (P=0.03) among these different regions. In general, cortical regions manifested a higher CVR compared to deep brain regions.
Finally, all five mice did not show noticeable aberrant behaviors or appearance over a minimum of 6 months after the final MRI scan.
We demonstrated the proof-of-principle of quantitative CVR mapping with acetazolamide in mice. Our method provided quantitative CVR values in the unit of %/[μg/ml], thus is suitable for comparison across animals or longitudinal studies of the same animals. We further showed that the proposed measurement, despite requiring injection of vasoactive agent, is safe for animals and can be repeated multiple times. We also demonstrated that global and regional CVR assessments are feasible with the proposed procedures.
CONCLUSION
We established a quantitative CVR MRI method in mice using acetazolamide challenge.Acknowledgements
Grant Sponsors: NIH R21 NS119960, NIH R21 AG058413, NIH R01 NS106702, NIH R01 NS106711, NIH R01 AG064792, NIH U01 NS100588, and NIH RF1 AG071515.References
1. Fisher JA, Venkatraghavan L, Mikulis DJ. Magnetic Resonance Imaging-Based Cerebrovascular Reactivity and Hemodynamic Reserve. Stroke 2018; 49(8): 2011-2018.
2. Sobczyk O, Crawley AP, Poublanc J et al. Identifying Significant Changes in Cerebrovascular Reactivity to Carbon Dioxide. AJNR Am J Neuroradiol 2016; 37(5): 818-824.
3. Wei Z, Xu J, Chen L et al. Brain metabolism in tau and amyloid mouse models of Alzheimer's disease: An MRI study. NMR Biomed 2021; e4568.
4. Wei Z, Chen L, Lin Z et al. Optimization of phase-contrast MRI for the estimation of global cerebral blood flow of mice at 11.7T. Magn Reson Med 2019; 81(4): 2566-2575.
5. Hirschler L, Debacker CS, Voiron J et al. Interpulse phase corrections for unbalanced pseudo-continuous arterial spin labeling at high magnetic field. Magn Reson Med 2018; 79(3): 1314-1324.
Figures