3267
Measuring changes in placental morphology using magnetic resonance imaging in a preclinical model of human pregnancy1School of Biomedical Engineering & Imaging Sciences, King's College London, London, United Kingdom, 2Department of Medical Physics & Biomedical Engineering, University College London, London, United Kingdom, 3Early Origins of Adult Health Research Group, University of South Australia, Adelaide, Australia, 4Preclinical Imaging and Research Laboratories, South Australian Health and Medical Research Institute, Adelaide, Australia, 5Institute for Women's Health, University College London, London, United Kingdom, 6NIHR Biomedical Research Center, University College London Hospitals, London, United Kingdom
Synopsis
Abnormalities of placental development and function underlie many pathologies of pregnancy including preeclampsia and fetal growth restriction (FGR). Advances in MRI techniques provide capacity to obtain additional placental in vivo information to support clinical decision-making. Animal models are used in invasive validation studies are possible in animal models and allow for controlled experiments during pregnancy. Here, we investigated whether MRI technology could be used to study the anatomical morphology of placentae in vivo in sheep; and we characterise diffusion and perfusion properties in normal pregnancies and those complicated by induced FGR.
Introduction
Quantitative diffusion-weighted magnetic resonance imaging (DW-MRI) parameters have been increasingly used to characterise placental microstructure and function. Placental imaging measurements are difficult to validate due to the invasive nature of gold-standard procedures; thus , preclinical models are important in invasive validation studies for MRI measurements, as they allow controlled experiments and analysis of multiple time-points during pregnancy1,2. Apparent diffusion coefficient (ADC) reflects changes in cellular diffusivity3 and T2-relaxometry identified large effect sizes in human pregnancies complicated by fetal growth restriction (FGR)4. Fractional anisotropy (FA) is a diffusion tensor imaging measure that represents preferred directionality in water diffusion.The purpose of this study is two-fold: 1) we investigate whether MRI technology can be used to study the anatomical morphology of placentae in-vivo in sheep; and 2) we characterise placental MRI markers such as FA, ADC and T2 across late gestation in normal pregnancies and those complicated by FGR.
Methods
The study was approved by the Animal Ethics Committee of the South Australian Health and Medical Research Institute.Carunclectomy surgery
Non-pregnant ewes (n=5) were assigned to have most of their endometrial caruncles removed via carunclectomy5 (CX) under general anaesthesia (induction, diazepam (0.3mg/kg) & ketamine (7mg/kg); maintenance, 2.5% isoflurane).
Image Acquisition
At 109-111 (n=20) and 139-141 (n=9) days gestation, ewes were anesthetised as per surgery and underwent MRI scans on a 3T Siemens Skyra Scanner (Erlangen,Germany). DW-MRI was performed at 7 b‐values (b = 0, 10, 20, 30, 50, 70, 100, 200, 300, 500, 600 s.mm-2) and T2-relaxometry at 10 echo times (TE) = (81, 90, 96, 120, 150, 180, 210, 240, 270, 300 ms). Data was also acquired at b‐value 50 s.mm-2 and 200 s.mm-2 for TE = (81, 90, 120, 150, 180, 210, 240 ms). DTI is acquired in 30 non-colinear directions at b-values of 50 s.mm-2 and 100 s.mm-2 and echo time 69 ms. Voxel resolution was 0.9$$$\times$$$0.9$$$\times$$$0.5 mm.
Modelling
The calculation of ADC assumes a model of single-exponential decay given by:
$$S(b)=S_0e^{-bADC},$$
where $$$S(b)$$$ is the signal at a diffusion weighting with b-value $$$b$$$ and $$$S_0$$$ is the signal with zero diffusion weighting, i.e., $$$b=0$$$.
In T2-relaxometry the parameter of interest is the T2 relaxation rate and is given by the following monoexponential decay:
$$S(TE)=S_0e^{-TE/T2},$$
where T2 is the relaxation time.
The DTI model is of the form6:
$$S(b,{\bf r})=S_0e^{-br^TDr},$$
where $$$S(b,r)$$$ is the signal at diffusion weighting with b-value and direction $$${\bf r}$$$.
Image-Processing
A nonrigid registration algorithm was used to correct for motion7. The sheep placentomes were manually segmented (ITK-SNAP, 2017) from the unregistered baseline image (lowest TE, b=0). We applied log-linear voxel-wise fitting to obtain measurements of FA, ADC and T2 using in house software developed in MATLAB (MathWorks,Natick).
Statistical-Analysis
Two-way ANOVA was performed to examine the effect of group, and the effect of gestational age on MRI parameters. One-way ANOVA was also performed within each MRI parameter to examine the effect of placentome types.
Results
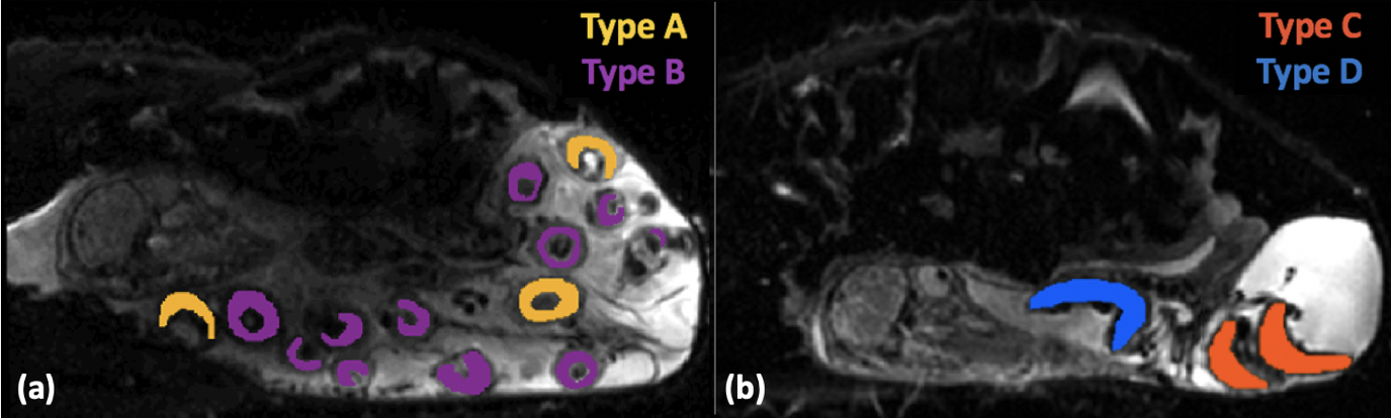
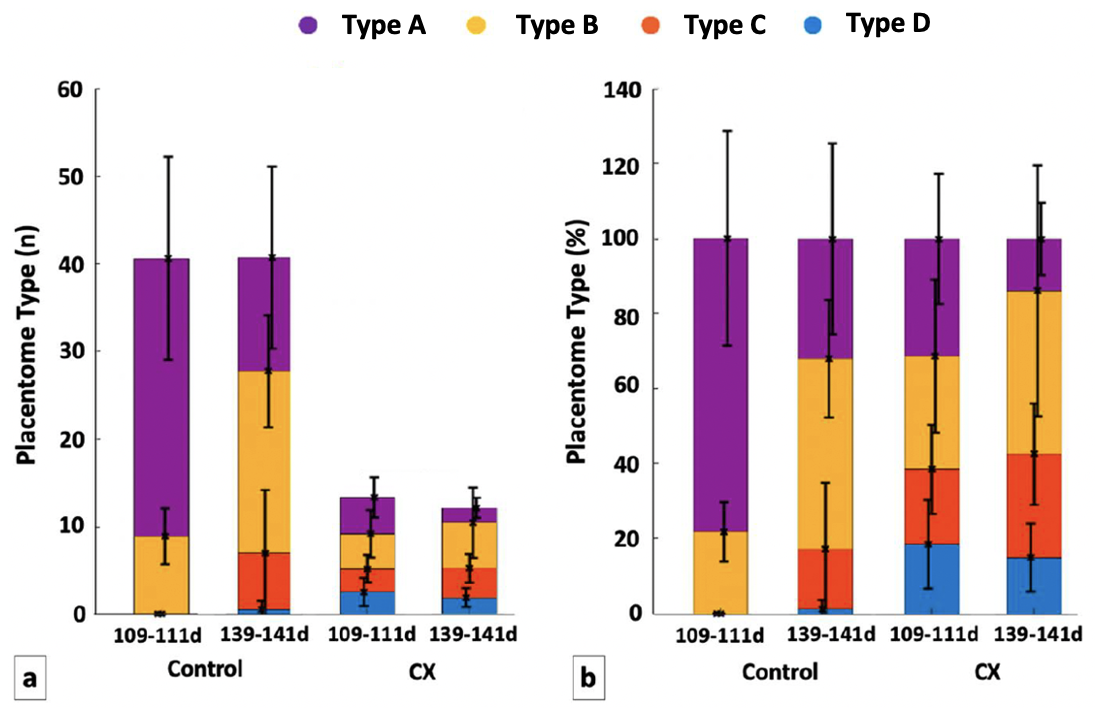
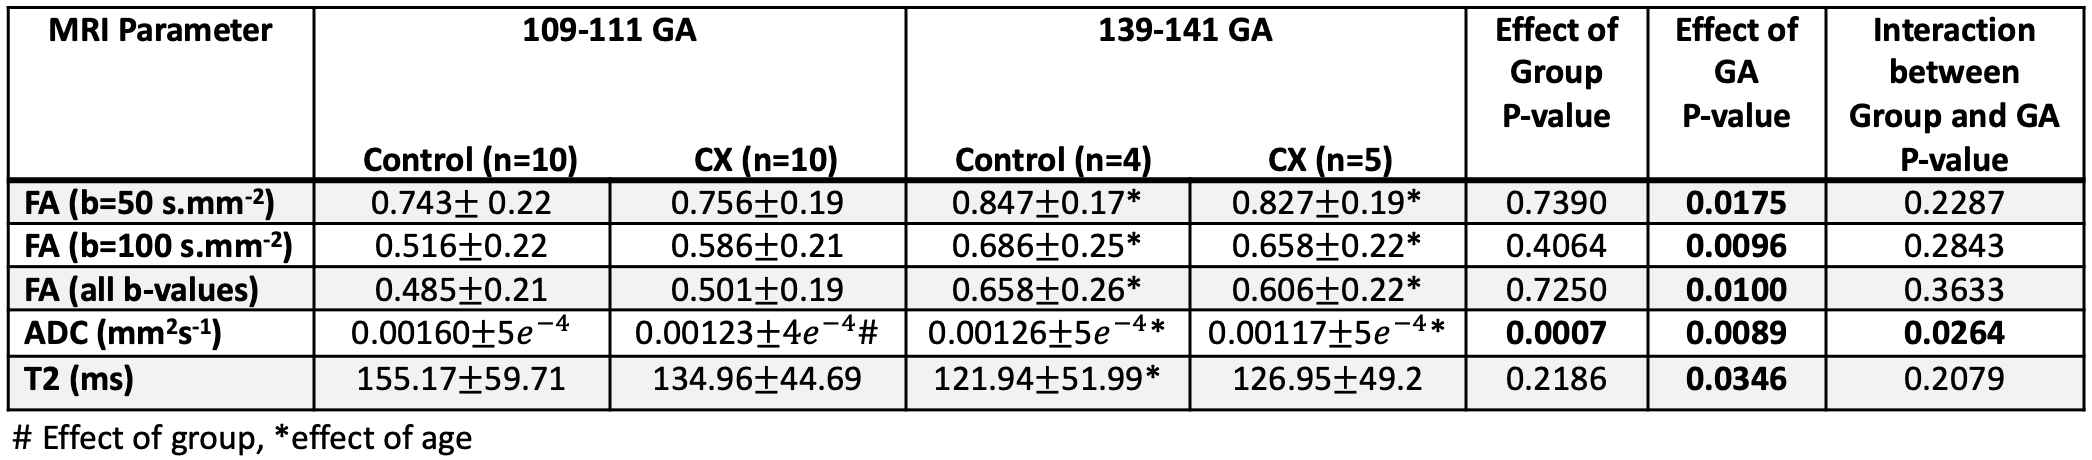
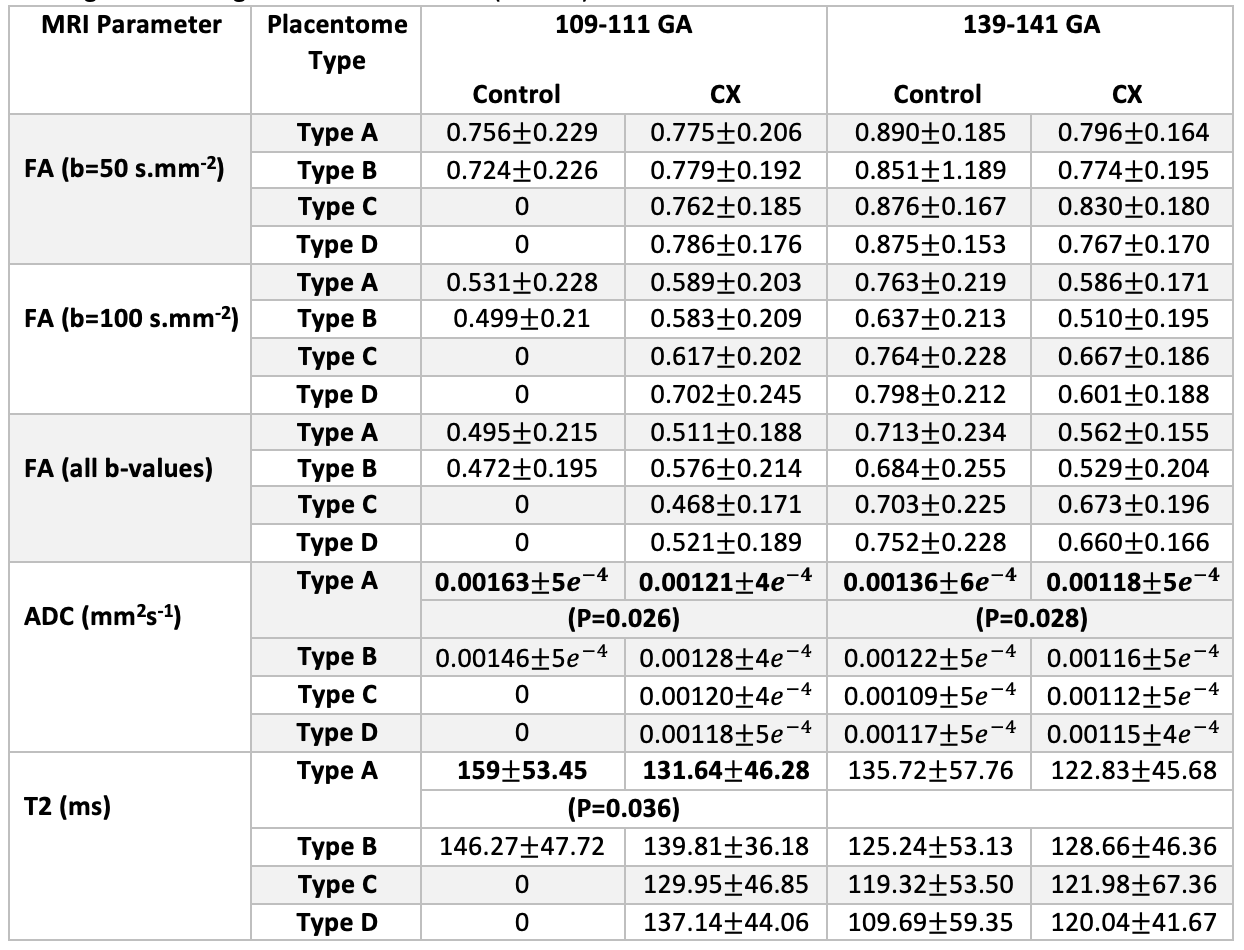
As expected, the total number of placentomes observed in controls was higher compared to CX at both gestational ages (Figure 2a). Classification of placentomes using MRI at 109-111 days gestation resulted in proportions of 78% of type A and 22% of type B for controls; and 31% of type A, 30% of type B, 20% of type C and 19% of type D for CX animals (Figure 2b). No type C and D placentomes were identified at mid gestation in controls. Classification of placentomes at 139-141 days gestation were in proportions of 32% of type A, 51% of type B, 16% of type C and 1% of type D for controls; and 13% of type A, 44% of type B, 28% of type C and 15% of type D for CXs.There was a significant increase in FA between 109-111 days and 139-141 days gestation (Table 1). While there was a significant reduction in T2 at late gestation in Controls, there was no significant change in CXs. The ADC was lower at 139-141 days than at 109-111 days in both groups, and the expected decrease in ADC in CX animals was observed at both gestational ages. Significant differences between placentome types were observed only in Controls, whereas in CXs differences there was no difference.
Discussion
We demonstrated that placentome morphology changes in the same animals across gestation. This is consistent with the results of cross-sectional analysis in the literature8. Placentome types C and D were seen only at 139-141 days gestation, and even then, in small numbers in Controls. Our results confirm previous observations that in the case of carunclectomy, there is an early conversion of the placentomes from type A and B to type C and D9.Conclusion
This study provided baseline data for placental MRI techniques in a preclinical model of placental function. We also demonstrated that MRI methods can detect placentome morphology changes with gestational age.Acknowledgements
This research was supported by the Wellcome Trust (210182/Z/18/Z, 101957/Z/13/Z, 203148/Z/16/Z), the EPSRC (NS/A000027/1) and an ARC Future Fellowship (Level 3; FT170100431) to JLM.References
1. Morrison JL, Berry MJ, Botting KJ, Darby JRT et al. Improving pregnancy outcomes in humans through studies in sheep. Am J Physiol Regul Integr Comp Physiol. 2018; 315(6): R1123 – R1153.
2. Flouri D, Darby JR, Holman SL, Perumal SR, et al. Mangetic resonance imaging of placentome development in the pregnant ewe. Placental. 2021; 61–69.
3. Fu L, Zhang J, Xiong S, Sun M. Decreased apparent diffusion co-efficient in the placentas of monochorionic twins with selective intrauterine growth restriction. Placenta. 2018; 69:26–31.
4. Aughwane R, Mufti N, Flouri D et al. Magnetic resonance imaging measurement of placental perfusion and oxygen saturation in early-onset fetal growth restriction. BJOG: Int J Obstet GY. 2020; 00: 1–9.
5. Danielson L, McMillen IC, Dyer JL, Morrison JL. Restriction of placental growth results in greater hypotensive response to alpha-adrenergic blockade in fetal sheep during late gestation. J Physiol. 2005; 563:611–620.
6. Melbourne A, Toussaint N, Owen D, Simpson I, Anthopoulos T, De Vita E, Atksinson D, Ourselin S. NiftyFit: a Software Package for Multi-parametric Model-Fitting of 4D Magnetic Resonance Imaging Data. Neuroinform. 2016; 14: 319–337.
7. Flouri D, Owen D, Aughwane R, et al. Improved fetal blood oxygenation and placental estimated measurements of diffusion-weighted MRI using data-driven Bayesian modeling. Magn Reson Med. 2020; 83: 2160 – 2172.
8. Ward JW, Forhead AJ, Wooding FBP, Fowden AL. Functional Significance and Cortisol Dependence of the Gross Morphology of Ovine Placentomes During Late Gestation. Biol. Reprod. 2006; 74: 137–145.
9. S. Zhang, P. Barker, K. J. Botting, C. T. Roberts, C. M. McMillan, I. C. McMillen, J. L. Morrison, Early restriction of placental growth results in placental structural and gene expression changes in late gestation independent of fetal hypoxemia, Physiol Rep. 2016; 4 (23): e13049.
10. Slator PJ, Hutter J, McCabe Laura, Dos Santos Gomes A, Price AJ, Panagiotaki E, Rutherford MA, Hajnal JV, Alexander DC. Placenta microstructure and microcirculation imaging with diffusion MRI. Magn Reson Med. 2018; 80(2):756–766.
11. Saini BS, Darby JRT, Portnoy S, van Amerom J, Lock MC, Soo JY, Holman SL, Perumal SR, Kingdom JC, Sled JC, Macgowan CK, Morrison JL, Seed M. Normal human and sheep fetal vessel oxygen saturations by T2 magnetic resonance imaging. J Physiol. 2020; 598(15): 3259–3281.
Figures