3264
Tau accumulation is associated with fiber-specific white matter degeneration in Alzheimer's disease1Clinical Memory Research Unit, Department of Clinical Sciences, Lund University, Lund, Sweden, 2Department of Neurobiology, Care Sciences and Society, Karolinska Institute, Stockholm, Sweden, 3Diagnostic Radiology, Lund University, Lund, Sweden, 4Department of Medical Radiation Physics, Lund University, Lund, Sweden, 5Memory Clinic, Skåne University Hospital, Malmö, Sweden
Synopsis
Fixel-based analysis (FBA) enables investigation of micro- and macrostructural damage in white matter (WM) fiber bundles. However, the link between microscopic changes in fiber density (FD) and macroscopic morphological alterations in fiber cross-section (FC) with the pathological hallmarks of Alzheimer’s disease (AD) including regional tau and amyloid-β (Aβ) accumulation has not been explored yet. Here, we show that reduction in FC in the AD continuum is closely connected with tau tangles in contrast to Aβ pathology.
Introduction
Consistent evidence shows substantial white matter (WM) abnormalities in Alzheimer’s disease (AD)1,2 using the diffusion tensor imaging (DTI). Nonetheless, DTI has limitations that prevent straightforward interpretation of the results3. Here, we leveraged the fixel-based analyses (FBA) framework to disentangle microstructural degeneration from reduction in macroscopic atrophy as quantified by fiber density (FD) and fiber cross-section (FC) respectively. We further quantified the combination of both metrics (FDC) and investigated differences in the three metrics across the AD spectrum. We further examined the association of such fiber-specific metrics with amyloid/tau pathology and cognitive performance.Methods
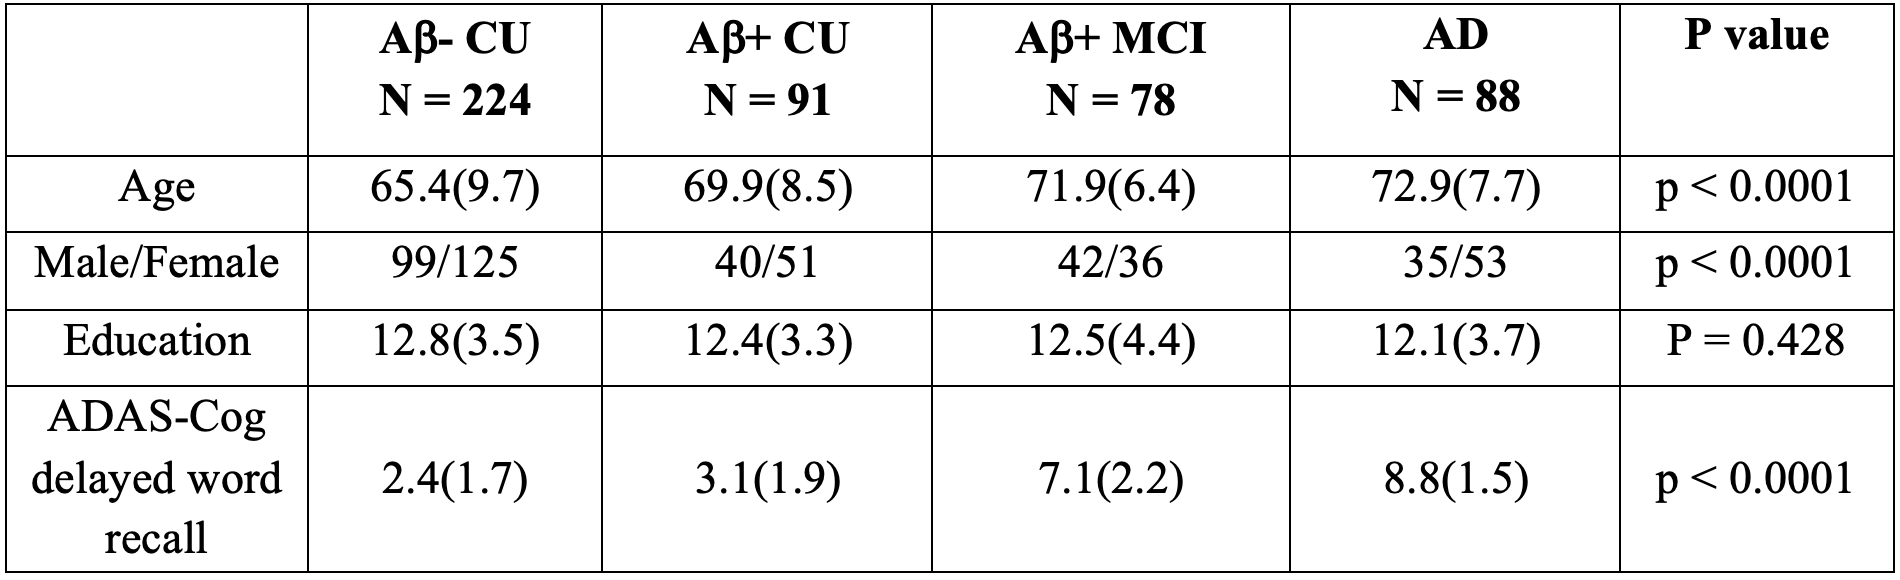
224 Aβ-negative and 91 Aβ-positive cognitively unimpaired (CU) subjects, 78 Aβ-positive individuals with mild cognitive impairment (MCI) and 88 patients with AD dementia aged ≥ 50 years were recruited from the Swedish BioFINDER-2 study. Demographic and clinical characteristics are summarized in Table1. All participants underwent diffusion MRI (dMRI), tau and amyloid positron emission tomography (PET) using [18F] RO948 and [18F] flutemetamol tracers, respectively. dMRI data were acquired using a 3T Siemens Prisma scanner with an isotropic voxel size of 2mm3 and a multi-shell scheme (b = 0,100,1000,2500 s/mm2 in 2,6,32,64 directions, respectively). Additionally, a T1-weighted and a FLAIR image were acquired with spatial resolution of 1mm3 in the same session. Details on FBA have been described elsewhere4,5. Following preprocessing, we computed 3 tissue response functions for GM, WM and CSF and subsequently upsampled the data to a voxel size of 1.3 mm3. Fiber orientation distributions (FOD) were obtained via the Multi-Shell Multi-Tissue constrained spherical deconvolution (MSMT-CSD)6 using group-averaged response functions. FBA metrics were then computed from individual FOD images that were aligned to a study-specific FOD template. We applied a general linear model to identify group differences in FBA metrics and to evaluate their associations with Aβ, tau and memory function as measured by delayed word recall from Alzheimer’s Disease Assessment Scale-Cognitive subscale (ADAS-Cog). Age, sex, WM hyperintensities (WMH; obtained from segmentation of FLAIR image) and intracranial volume (ICV; extracted from processing of T1 image) were included in the model as nuisance covariates. Finally, we tested the mediation effect of GM volume in the entorhinal cortex (ERC) and fiber-specific WM damage on the relationship between entorhinal tau load and memory. Statistical inference was conducted using connectivity-based fixel enhancement and the results were considered significant at p < 0.05 (Family-Wise Error corrected).Results
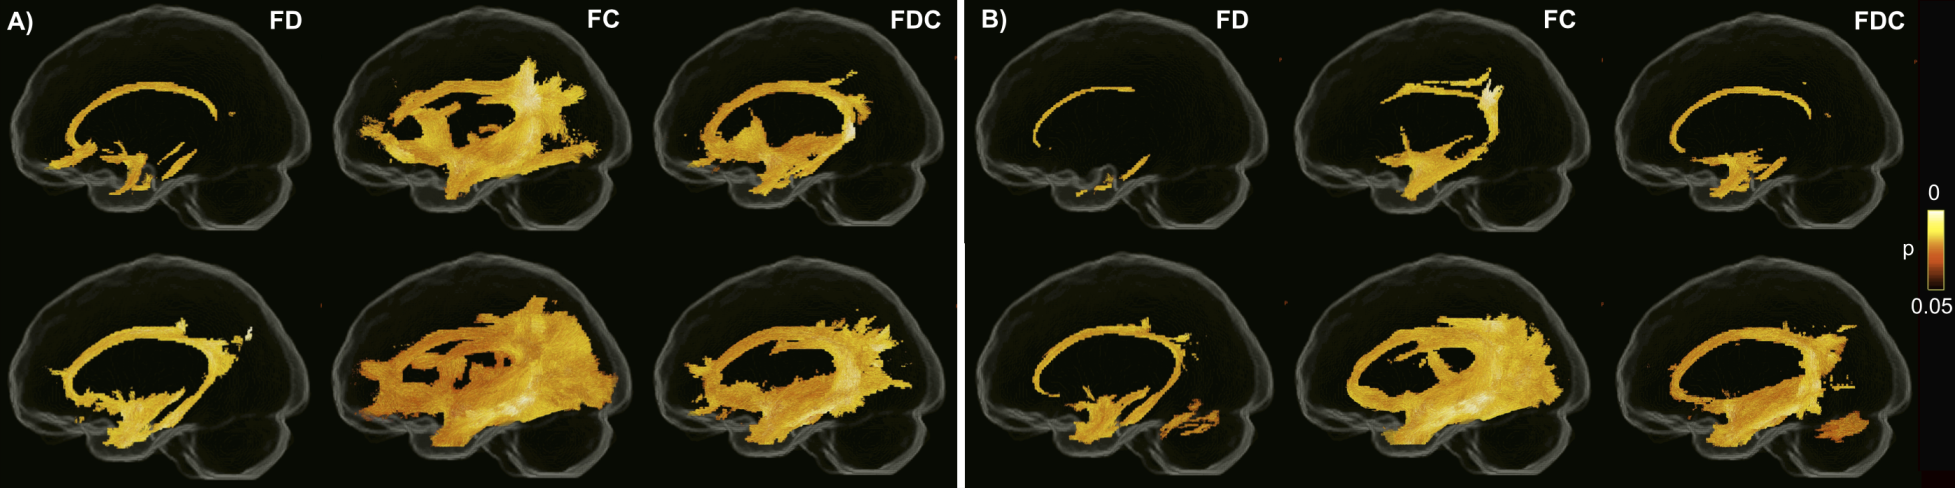
Between group differences in FBA metricsAll three FBA metrics were decreased in MCI and AD patients compared to both control groups (Figure 1). The strongest reduction was observed in FC, demonstrating macroscopic atrophy in several WM tracts including the cingulum, arcuate, uncinate, superior and inferior longitudinal fasciculi. Reductions in FD were less pronounced and were mainly found in the cingulum and its parahippocampal portion as well as a portion of the uncinate fasciculus. The spatial pattern of reduced FDC was similar to that of FC albeit less extensive. No between-group differences were found between Aβ-negative and Aβ-positive CU individuals.
Association of FBA metrics with Ab and tau pathology
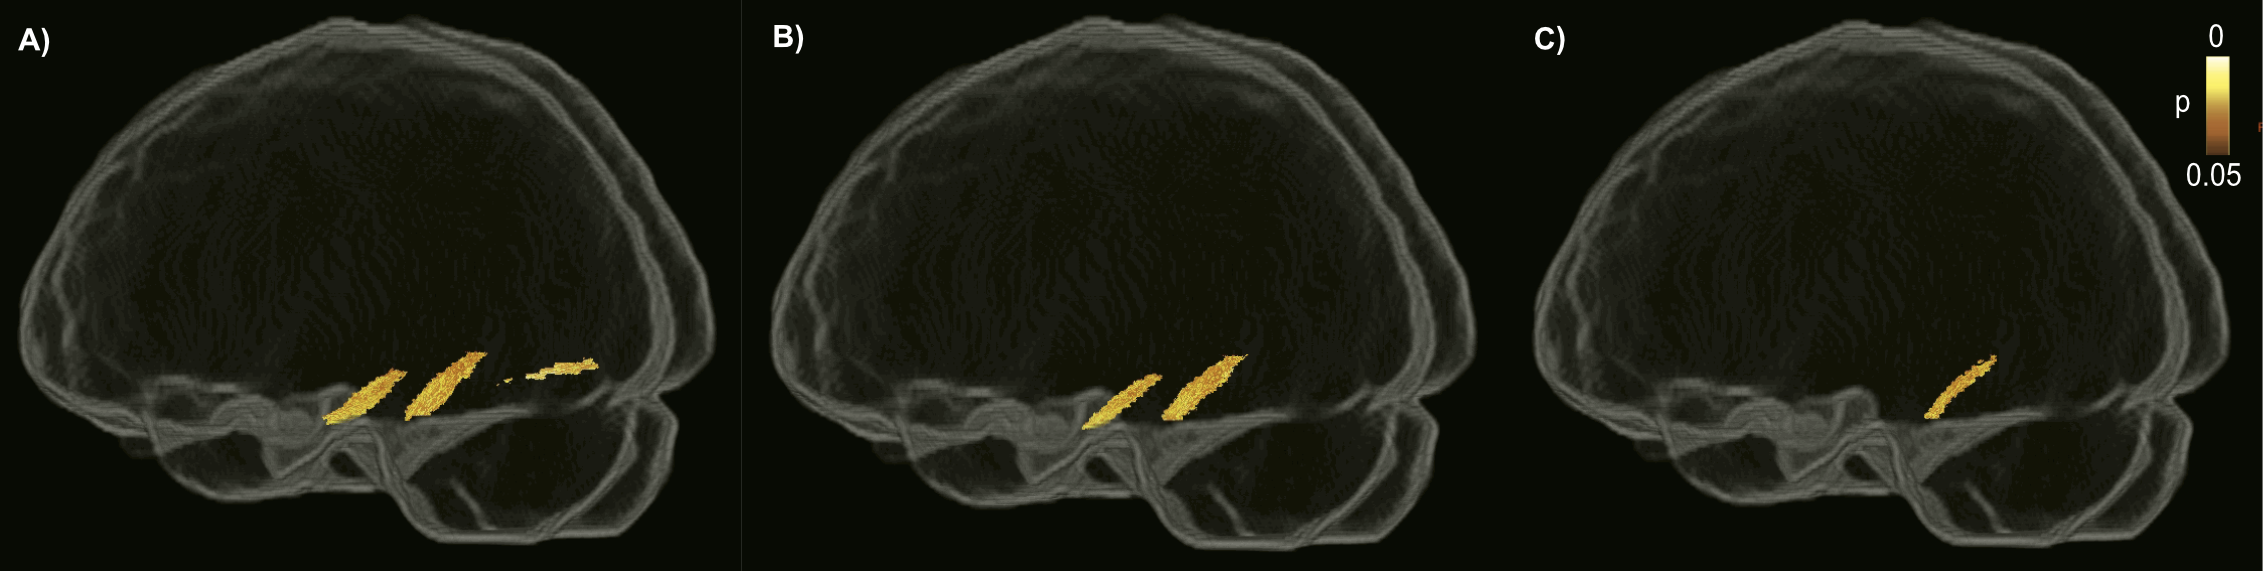
The associations between amyloid and tau with FBA measures were analyzed in Aβ-positive CU and MCI individuals representing preclinical and prodromal stages of AD. While global cortical Aβ burden was not associated with any of the FBA metrics, higher tau load in the ERC was correlated with reduced FC predominantly in the parahippocampal portion of the cingulum. This association remained largely intact following additional adjustment for neocortical Aβ-PET uptake. However, after controlling for GM volume in ERC, the bilateral correlation was restricted to the right hemisphere (Figure 2).
Association of FBA metrics with memory
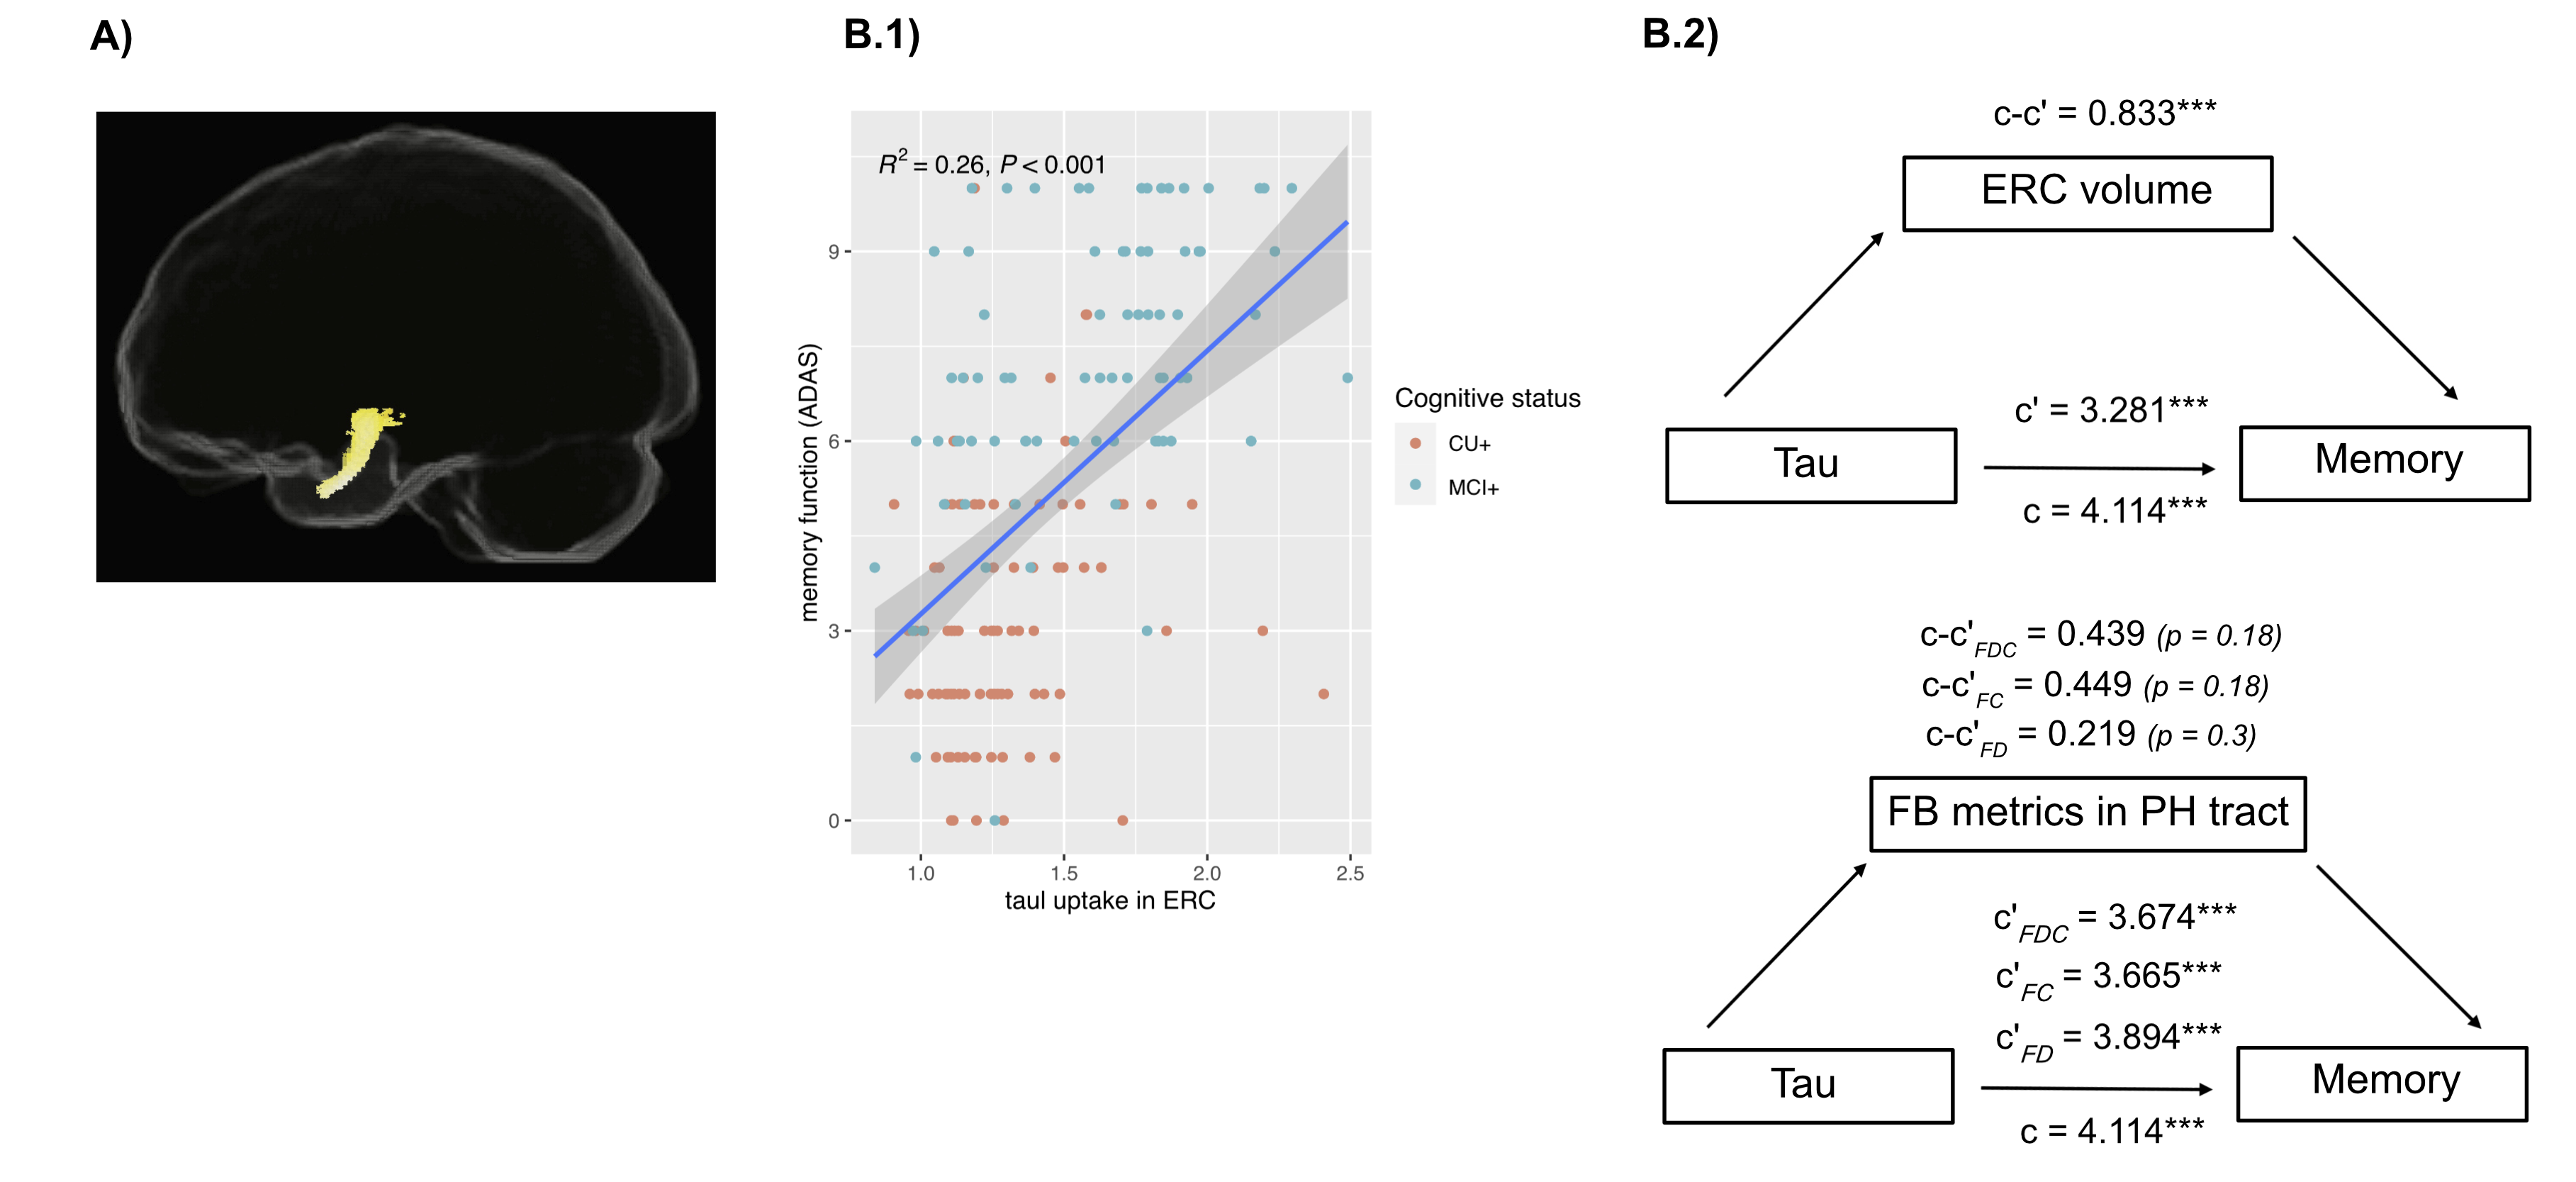
Impaired memory function was significantly related to reduced FC in the temporal part of the uncinate fasciculus in Aβ-positive CU individuals and MCI patients (Figure 3A). After accounting for ERC tau-PET uptake, FC was no longer associated with memory function. Reduced memory performance was also associated with increased tau load in ERC in the same group (Figure 3B.1). The tau-memory association was not mediated by fiber-specific degeneration in the parahippocampal portion of the cingulum whereas ERC volume partially mediated the correlation between ERC tau-PET uptake and memory (Figure 3B.2).
Discussion/Conclusion
Our results reveal that in contrast to amyloid pathology, tau aggregates are tightly connected to fiber-specific WM damage in the AD continuum. They further suggest that atrophy of temporal WM tracts as measured by FC is associated with worse memory performance as part of the neurodegenerative cascade in which tau accumulation is one of the major players.Acknowledgements
The authors thank the participants of the Swedish BioFINDER-2 study for their enthusiastic commitment. The present study was supported by the European Research Council (grant no. 311292), the Swedish Research Council (grants no. 2016-00906 and 2018-02052), the Knut and Alice Wallenberg Foundation (grant no. 2017-0383), the Marianne and Marcus Wallenberg Foundation (grant no. 2015.0125), the Swedish Alzheimer Foundation (grant no. AF-745911), the Swedish Brain Foundation (grant no. FO2019-0326), the Swedish federal government under the ALF agreement (grants no. 2018-Projekt0279 and 2018-Projekt0226) and the Strategic Research Area MultiPark (MultidisciplinaryResearch in Parkinson’s disease) at Lund University.
References
- Chua TC, Wen W, Slavin MJ, Sachdev PS. Diffusion tensor imaging in mild cognitive impairment and Alzheimer’s disease: a review. Curr Opin Neurol. 2008;21(1):83–92.
- Nir TM, Jahanshad N, Villalon-Reina JE, Toga AW, Jack CR, Weiner MW, et al. Effectiveness of regional DTI measures in distinguishing Alzheimer’s disease, MCI, and normal aging. NeuroImage Clin. 2013;3:180–95.
- Tournier J-D, Calamante F, Connelly A. Robust determination of the fibre orientation distribution in diffusion MRI: non-negativity constrained super-resolved spherical deconvolution. Neuroimage. 2007;35(4):1459–72.
- Raffelt DA, Smith RE, Ridgway GR, Tournier J-D, Vaughan DN, Rose S, et al. Connectivity-based fixel enhancement: Whole-brain statistical analysis of diffusion MRI measures in the presence of crossing fibres. Neuroimage. 2015;117:40–55.
- Raffelt DA, Tournier J-D, Smith RE, Vaughan DN, Jackson G, Ridgway GR, et al. Investigating white matter fibre density and morphology using fixel-based analysis. Neuroimage. 2017;144:58–73.
- Jeurissen B, Tournier J-D, Dhollander T, Connelly A, Sijbers J. Multi-tissue constrained spherical deconvolution for improved analysis of multi-shell diffusion MRI data. NeuroImage. 2014;103:411–26.
Figures