3263
Determination of Alzheimer's disease based on morphology and atrophy using machine learning combined with automated segmentation1Graduate school of Health Science, Tokushima University, Tokushima, Japan, 2Institute of Biomedical Sciences, Tokushima University Graduate School, Tokushima, Japan, 3Faculty of Health Sciences, Institute of Medical, Pharmaceutical and Health Sciences, Kanazawa University, Kanazawa, Japan
Synopsis
To classify healthy subjects or patients with Alzheimer's disease (AD) using three-dimensional T1w data, we developed a machine learning system which can capture morphology features and determine atrophy of brain tissue in early-stage AD. Deep learning, a support vector machine (SVM), and 3D convolutional neural networks (3DCNN) were performed. The accuracies of SVM and deep learning based on volume values were comparable and greatly exceeded the accuracy of 3DCNN. It was found that atrophic features were more considerable than morphological features in early-stage AD.
Introduction
Magnetic resonance imaging (MRI) is useful for the diagnosis of neurodegenerative diseases such as Alzheimer's disease (AD) and Parkinson's disease (PD) because various imaging changes can be identified. Moreover, MRI can visually depict the contrast and positional relationship between normal and diseases tissue, the extent and size of the disease, and brain structure1. For the diagnosis of neurodegenerative diseases, several contrast images, including T1-weighted (T1w), T2-weighted (T2w), and diffusion-weighted (Dw) images, are used to make a comprehensive judgment2. The imaging characteristics of neurodegenerative diseases are related to the degree of brain atrophy, tissue signal changes, and depth of the cerebral sulcus. On the other hand, it is difficult to diagnose the diseases at early-stages, and the accuracy of imaging diagnosis varies depending on individual experience and ability. Thus, we believe that automated segmentation and machine learning techniques are helpful as a diagnostic aid regardless of personal experience and knowledge. The purpose of this study is to develop a machine learning system which can derive morphology features and determine atrophy of brain tissue in early-stage AD and classify healthy subjects or patients.Methods
We used three-dimensional (3D) T1w data on 200 healthy subjects (25-91 years) and 200 patients with early-stage AD (20-85 years) for an open-access database (ADNI)3. Figure 1 shows a schematic illustration of the procedure used in this study. Python programs were used for machine learning, and FSL software was used for the alignment of 3D-T1w image coordination. Automated segmentation of the 3D-T1w data was performed using FreeSurfer software4. To verify the effect of brain atrophy, we focused on the volume values of each tissue. As input data used to compare the accuracy of deep learning which extracts feature values by machine, the volume values of 66 segments were prepared, to extract feature values from each system. In addition, using a support vector machine (SVM)5, the feature values were extracted manually. Next, because generally significant atrophy of gray matter is observed in AD, we also used deep learning to verify the volume values of gray matter (GM) and white matter (WM). The network structure for deep learning was 140 units with only one hidden layer. The accuracy was evaluated by 10-fold cross-validation. Additionally, to verify the morphological influence of the brain, we performed 3D convolutional neural networks (3DCNN) using volume data as input data for machine learning. The network structure consisted of two convolution layers (kernel size 3×3×3, number of filters 16 and 32, dropout 0.5) and five hidden layers (100,120,140,120,100 units). The accuracy was evaluated using 10-fold cross-validation. Furthermore, we performed logistic regression to determine the variable importance and only included data from tissue with a high degree of atrophy for the learning process. We then performed SVM using the volume values of six tissue with the highest variable importance. Finally, we performed image-based learning to focus on the morphological effects of each tissue using variable importance. Ten tissue segments with the highest variable importance were trimmed, and 3DCNN was performed using the 3D data of each tissue. The structure of the network was the same as the one described above.Results
Table 1 show the accuracies of each machine learning. Volume value deep learning training results for GM and WM: accuracy = 0.65 ± 0.04, SVM training results for all volume values: accuracy = 0.84 ± 0.04, and deep learning training results for all volume values: accuracy = 0.85 ± 0.03. The learning accuracy of the 3DCNN was 0.51 ± 0.02 when using whole brain segmented images. The volume value of SVM using the volume values of six tissue segments with high variable importance was 0.81±0.02.Table 2 shows the results of the variable importance and accuracies of each brain tissue by logistic regression and its 3DCNN analysis. The learning accuracy of the 3DCNN with highest variable importance for ten tissue was 0.74±0.02 (brain stem).
Discussion
Our machine learning results are affected by the resolution of T1w and the accuracy of FreeSurfer's segmentation. Moreover, a large amount of 3D data information may cause incomplete training, and it is necessary to prepare a more significant number of cases.Conclusion
The accuracies of SVM and deep learning using volume values were comparable and greatly exceeded the accuracy of 3DCNN. Our results show that atrophic features are more considerable than morphological features in early AD. In the future, we plan to validate our method not only for AD but also for other degenerative brain diseases, e.g., PD and schizophrenia.Acknowledgements
No acknowledgement found.References
- Killiany RJ, Moss MB, Albert MS, Sandor T, Tieman J, Jolesz F. Temporal lobe regions on magnetic resonance imaging identify patients with early Alzheimer's disease. Arch Neurol. 1993 Sep;50(9):949-54.
- Ivkovic M, Liu B, Ahmed F, Moore D, Huang C, Raj A, Kovanlikaya I, Heier L, Relkin N. Differential diagnosis of normal pressure hydrocephalus by MRI mean diffusivity histogram analysis. AJNR Am J Neuroradiol. 2013 Jun-Jul;34(6):1168-74.
- Suk HI, Shen D. Deep learning-based feature representation for AD/MCI classification. Med Image Comput Comput Assist Interv. 2013;16(Pt 2):583-90.
- Sørensen L, Igel C, Pai A, Balas I, Anker C, Lillholm M, Nielsen M; Alzheimer’s Disease Neuroimaging Initiative and the Australian Imaging Biomarkers and Lifestyle flagship study of ageing. Differential diagnosis of mild cognitive impairment and Alzheimer's disease using structural MRI cortical thickness, hippocampal shape, hippocampal texture, and volumetry. Neuroimage Clin. 2016 Dec 7;13:470-482.
- Oliveira PP Jr, Nitrini R, Busatto G, Buchpiguel C, Sato JR, Amaro E Jr. Use of SVM methods with surface-based cortical and volumetric subcortical measurements to detect Alzheimer's disease. J Alzheimers Dis. 2010;19(4):1263-72.
Figures
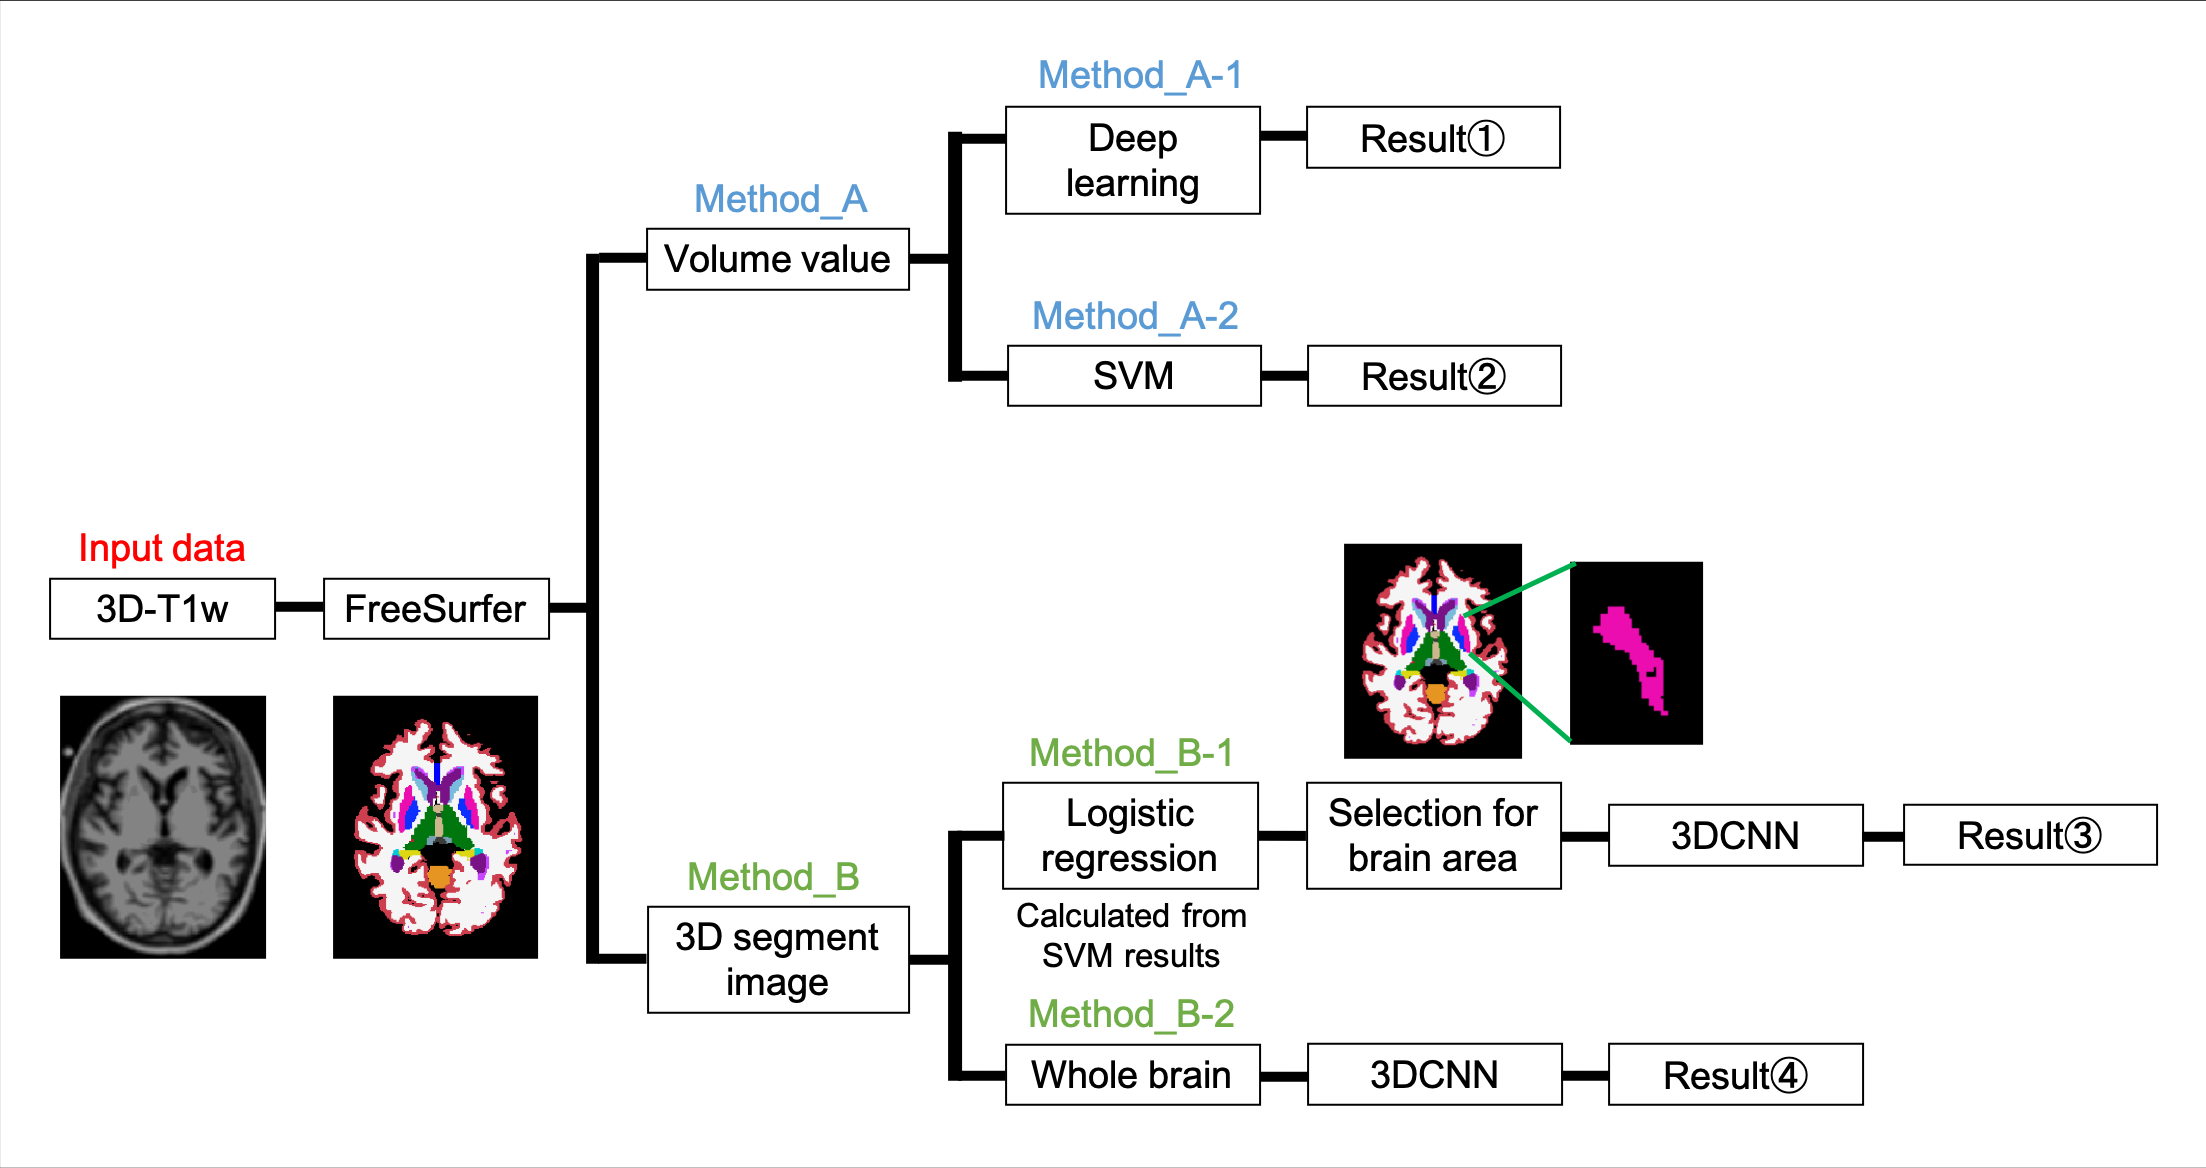
Figure 1 A schematic diagram of the procedure used in this study. Input data used 3D-T1w data segmented brain region with FreeSurfer. Method A and B are analysis based on volume and image, respectively. Method A-1 and -2 were analyzed for learning with deep learning and with SVM. Method B-1 and -2 were learnings when the brain tissue is limited to those areas selected based on variable importance calculated by logistic regression and when the whole brain segmentation images are used, respectively.
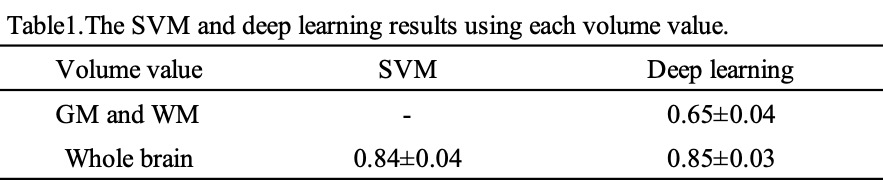
Table 1 The SVM and deep learning results using each volume value.
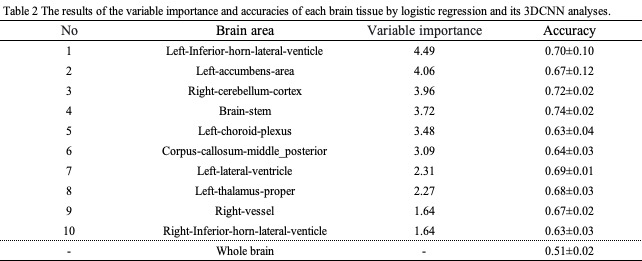
Table 2 The results of the variable importance and accuracies of each brain tissue by logistic regression and its 3DCNN analysis.