3262
Coupled Metabolic and Functional Changes in Default Mode Network Subsystems of Alzheimer's Disease: A Hybrid 3D 1H-MRSI/FDG-PET/fMRI Study1School of Biomedical Engineering, Shanghai Jiao Tong University, Shanghai, China, 2Department of Nuclear Medicine, Ruijin Hospital, Shanghai Jiao Tong University School of Medicine, Shanghai, China, 3Beckman Institute for Advanced Science and Technology, University of Illinois at Urbana-Champaign, Urbana, IL, United States, 4Department of Electrical and Computer Engineering, University of Illinois at Urbana-Champaign, Urbana, IL, United States
Synopsis
The default mode network (DMN) is the first large-scale system disrupted in Alzheimer’s disease (AD). However, the functional and metabolic changes in the DMN subsystems of AD patients are not yet fully understood. This study investigated the coupled functional and metabolic changes of the DMN subsystems by combining high-resolution 3D MRSI, resting-state fMRI, and 18F-FDG PET on a hybrid PET/MR scanner. Our results showed that the DMN subsystems have distinct functional and metabolic associations and contributions to cognitive decline in AD patients. Our findings may provide useful insights into the system-level pathophysiology of AD.
Introduction
Alzheimer’s disease (AD) is characterized by the spread of molecular pathologies along specific brain networks1. The default mode network (DMN) is the first large-scale system disrupted in AD and its subsystems have shown distinct functional and pathological changes across the AD spectrum2-4. Characterization of the functional and metabolic changes of each subsystem may provide useful insights into the system-level pathophysiology of AD. Posterior DMN (pDMN) has been thoroughly studied, which showed reduced functional connectivity (FC), glucose metabolism, N-acetyl aspartate (NAA) concentrations, and increased myo-inositol (mI) concentrations3-6. The functional and metabolic changes in ventral DMN (vDMN) and anterior DMN (aDMN) are not yet fully understood. In this study, using a high-resolution 3D MRSI technique known as SPICE (SPectroscopic Imaging by exploiting spatiospectral CorrElation), along with fMRI and 18F-FDG PET on a hybrid PET/MR scanner7,8, we investigated the coupled metabolic and functional changes of each DMN subsystem and explored their contributions to the cognitive impairment of AD.Methods
Thirty-four AD patients and 34 matched healthy controls were included in this study (Table 1). All imaging data were acquired on a 3T integrated Siemens Biograph mMR scanner (Siemens Healthcare, Erlangen, Germany). The MR scan protocols included 3D 1H-MRSI using the SPICE sequence (TR/ TE = 160/1.6 ms, voxel size = 2.0 × 3.0 × 3.0 mm3, FOV = 240 × 240 × 96 mm3), resting-state fMRI using the gradient-echo EPI sequence (TR/TE = 2000/22 ms, voxel size = 3.0 × 3.0 × 3.0 mm3, FOV = 192 × 192 mm2, spacing between slices = 3.75 mm, number of slices = 36, number of volumes = 200), and structural MR images using the 3D MPRAGE sequence (TR/TE = 1900/2.44 ms, FOV = 256 × 256 mm2, voxel size = 0.5 × 0.5 × 1.0 mm3, number of slices = 192). The PET data were acquired at 40-60 min post a bolus injection of the 18F-FDG (mean dose of 207.8 MBq) (matrix size = 344 × 344 × 127, voxel size = 2.1 × 2.1 × 2.0 mm3).The spatiospectral functions of metabolites were reconstructed from the MRSI data using a union-of-subspaces model incorporating pre-learned spectral basis functions7-9. The metabolite maps including NAA, mI, and creatine (Cr) were obtained using an improved LCmodel-based algorithm, incorporating spatial and spectral priors8,10. The 18F-FDG PET images were reconstructed using an ordered subset expectation-maximization algorithm after attenuation correction and corrections of random coincidences. Regional PET data were quantified using the standard uptake value ratio (SUVR) as the ratio to the whole cerebellum mean uptake. The fMRI images were preprocessed using AFNI11 and SPM12 following the literature4. The DMN subsystems, including pDMN, vDMN, and aDMN, were extracted following the literature4 and registered to subject space to be used as regions of interest for further analysis.
Mean NAA/Cr, mI/Cr, SUVR, and FCs were extracted from pDMN, vDMN, and aDMN, respectively. All data have been tested for normality using Kolmogorov-Smirnov tests. For normally distributed measures, independent two-sample t-tests were used for group comparison; Pearson’s partial correlation analyses (age and sex as covariates) were applied for correlation analysis. For non-normally-distributed measures, Mann-Whitney U tests were utilized to compare group differences; the correlations were evaluated by Spearman’s partial correlation analyses. All the statistical analyses were performed on MATLAB.
Results and Discussion
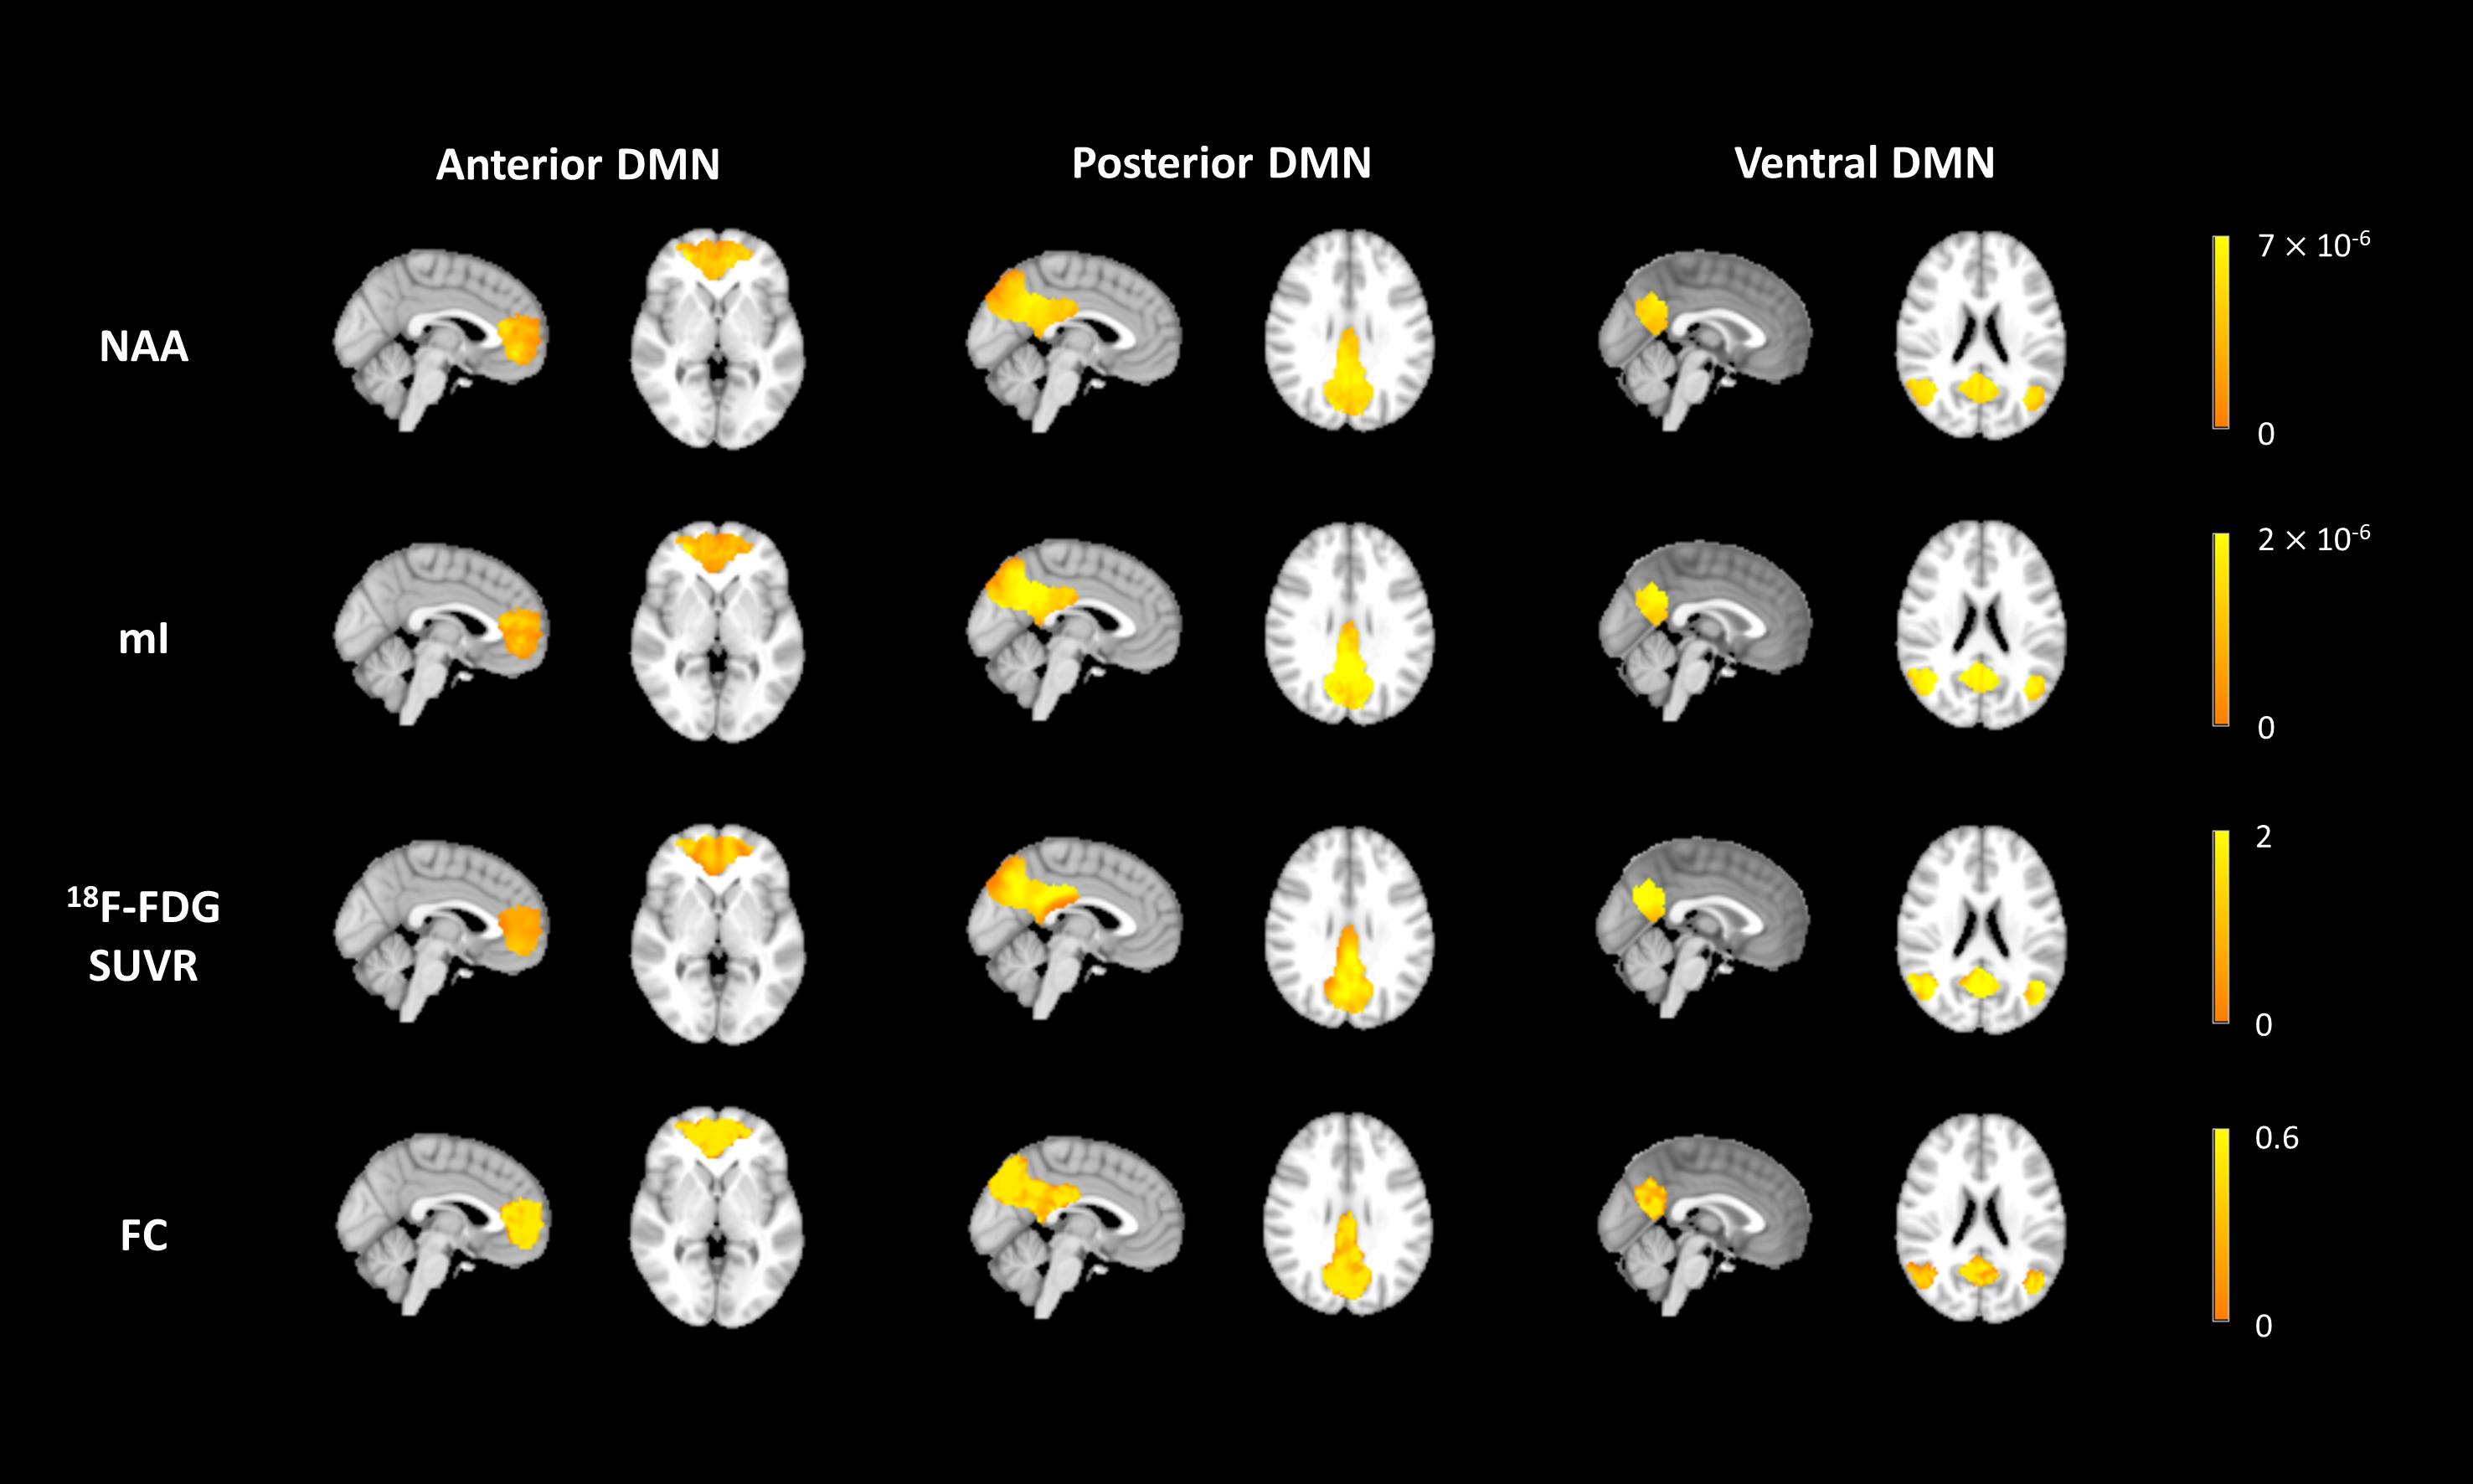
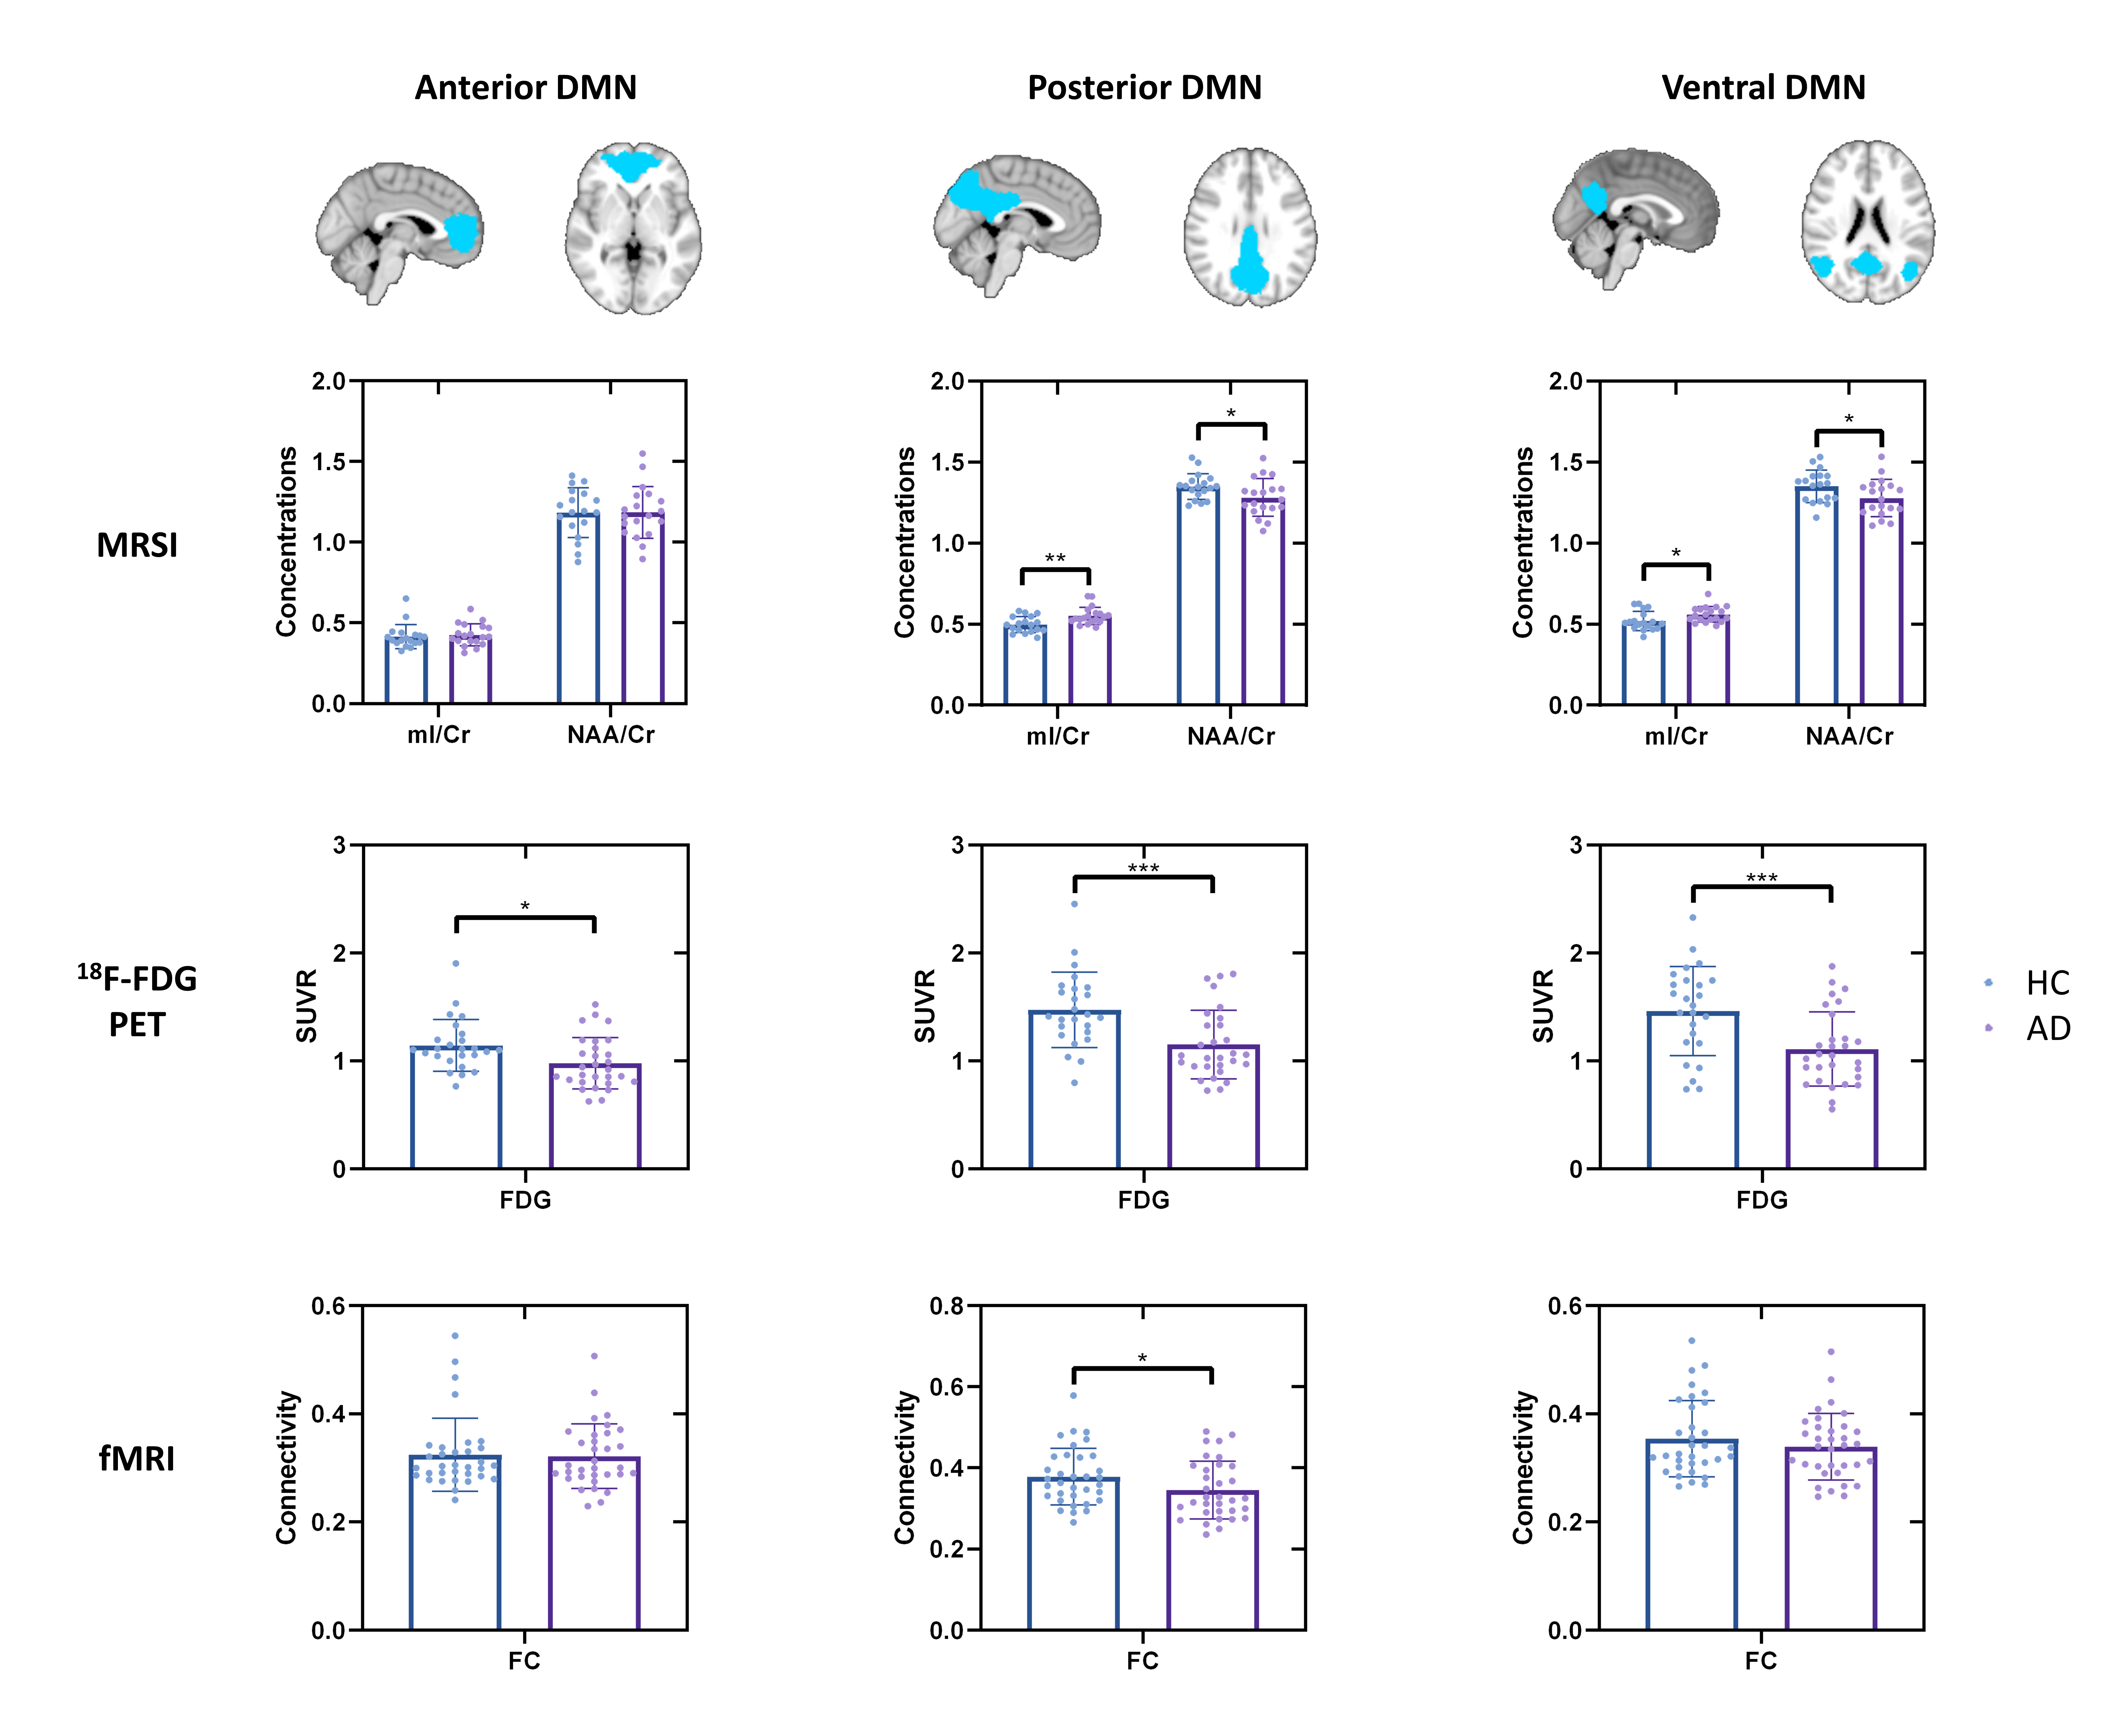
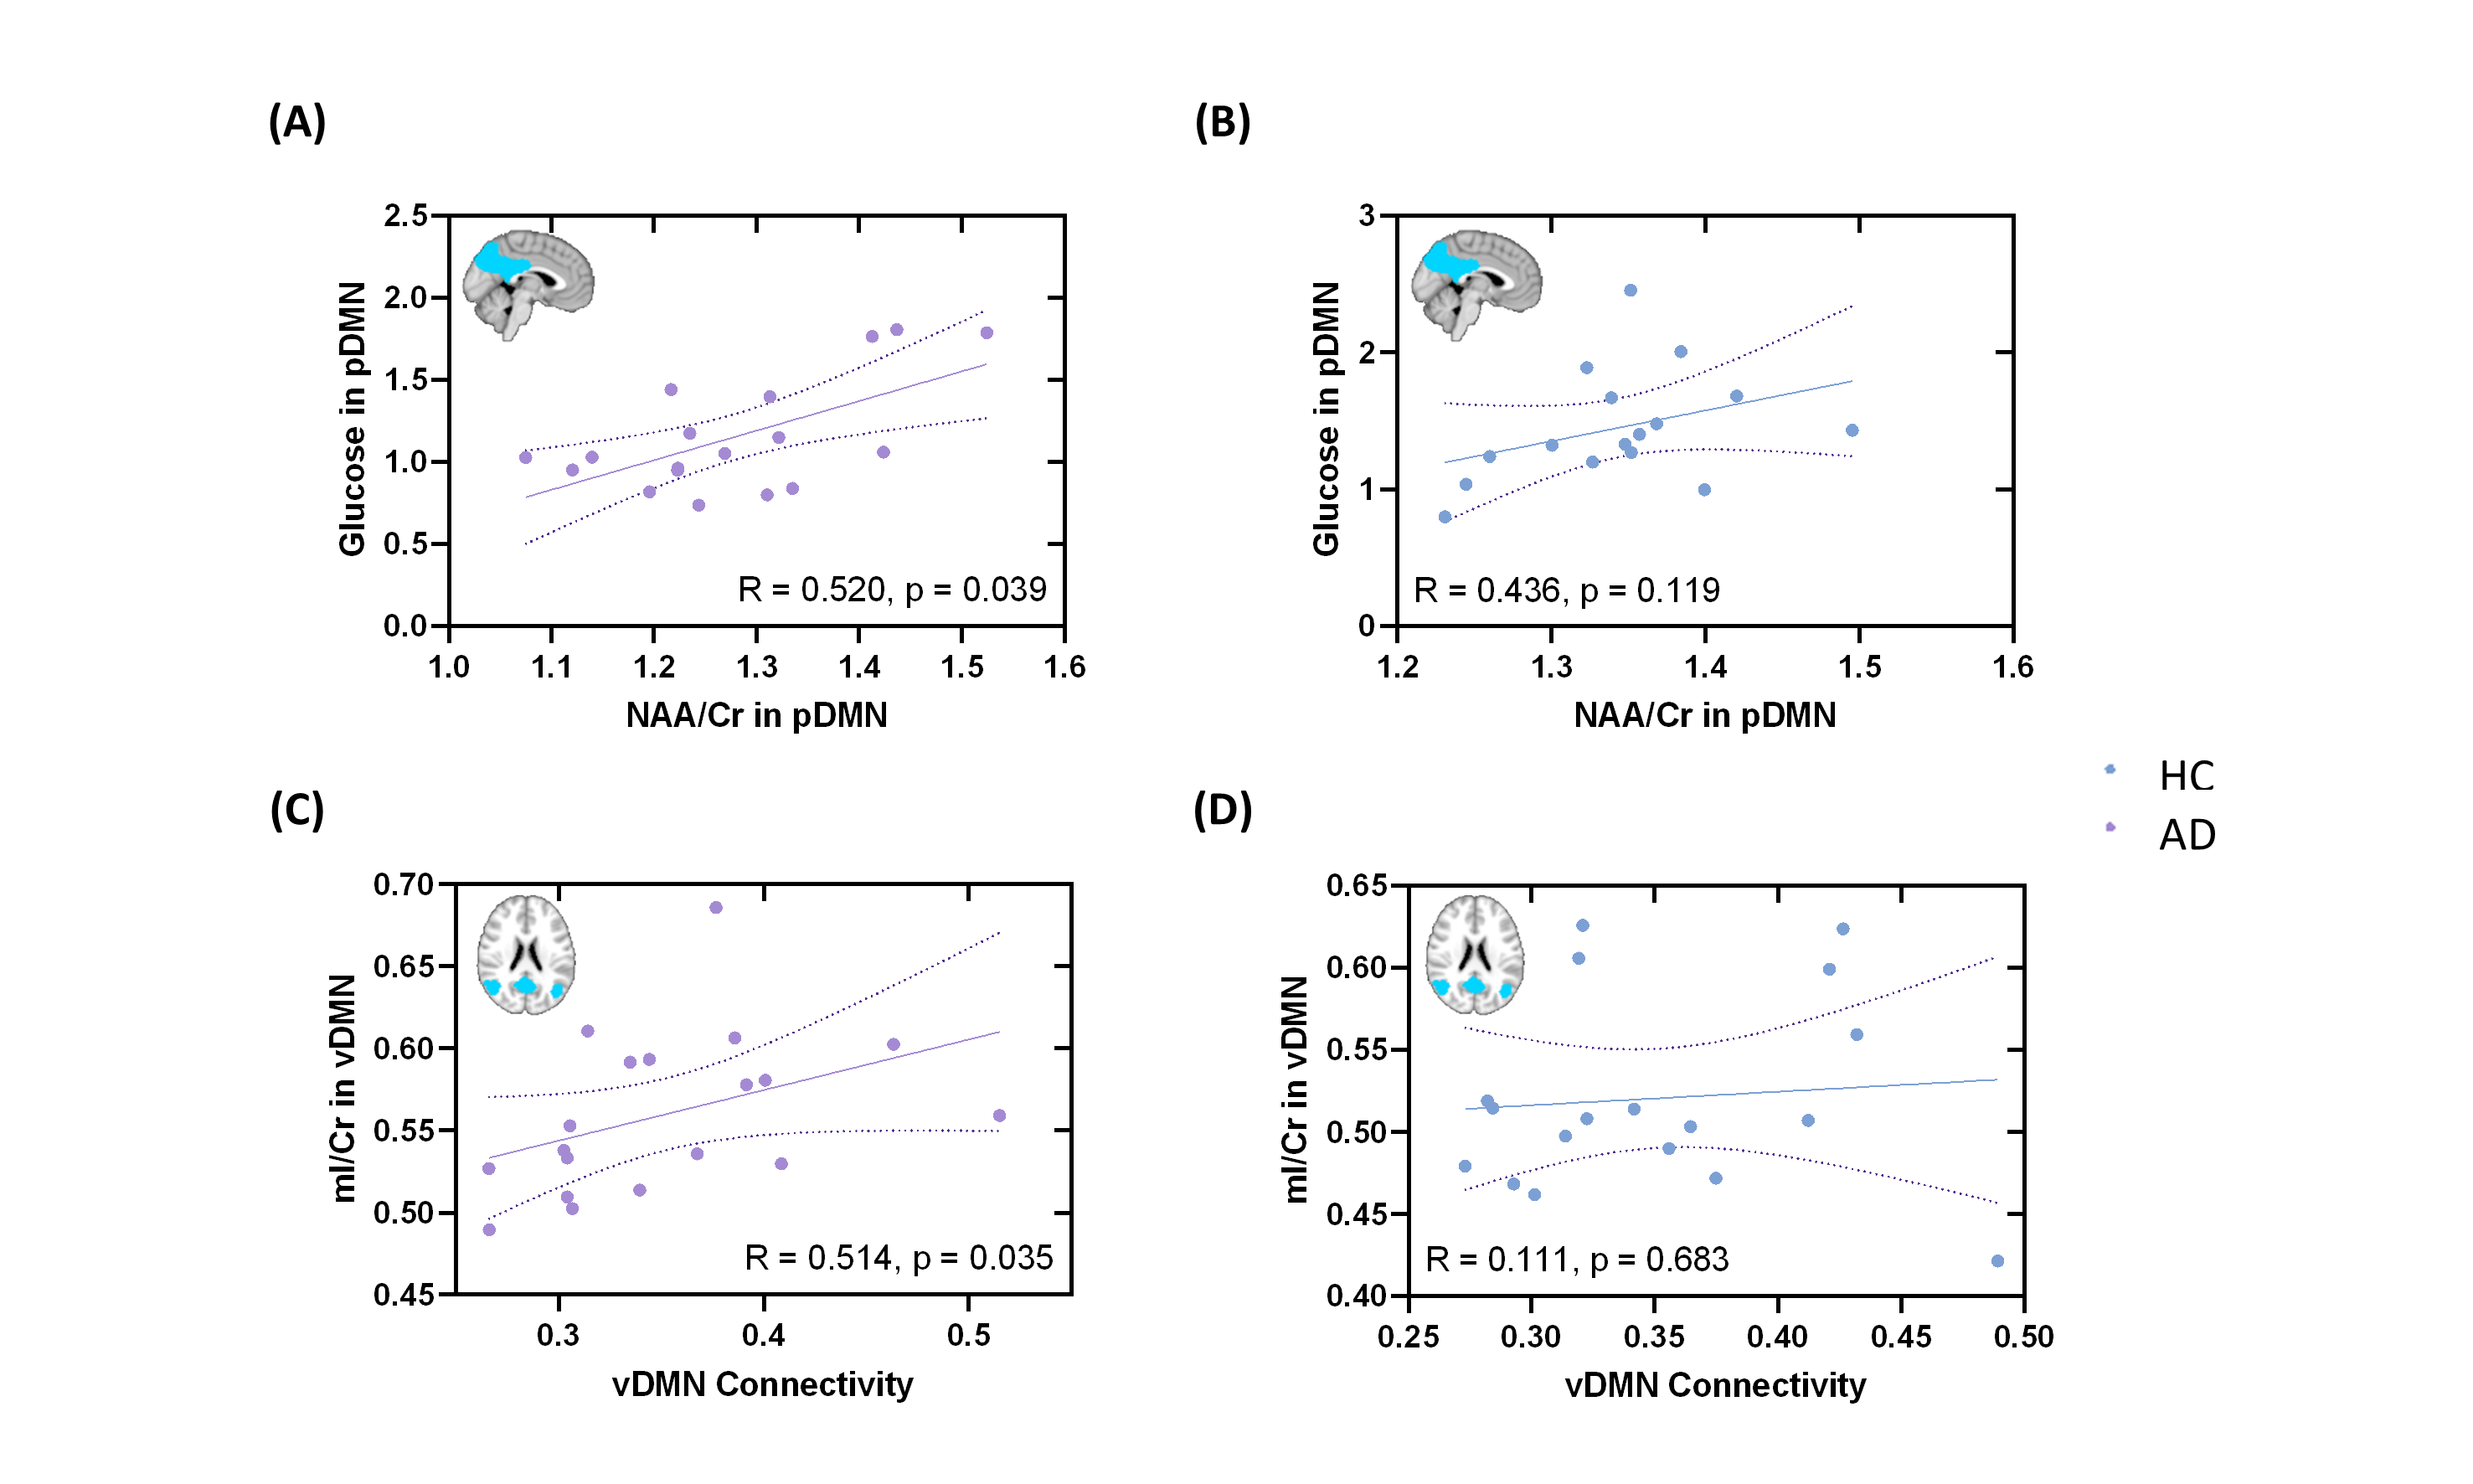
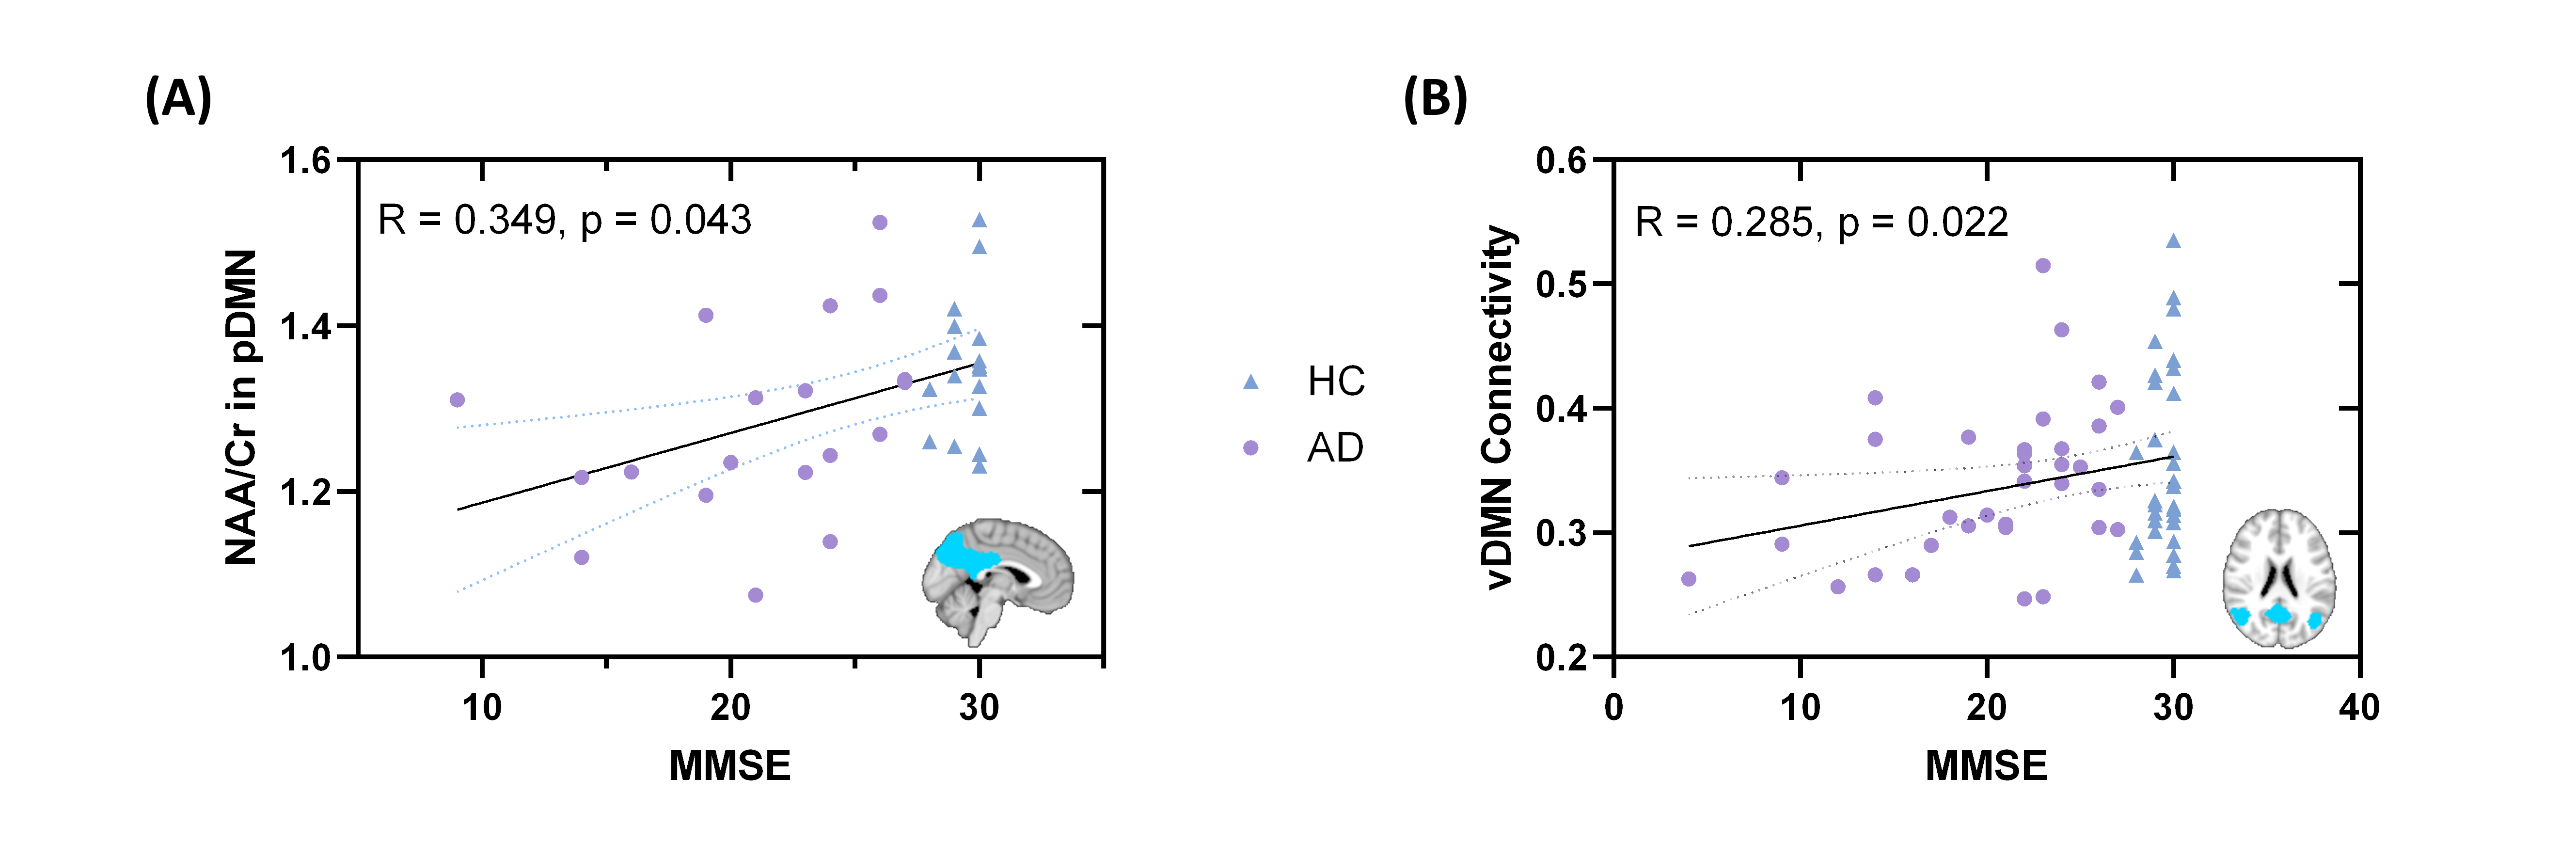
Figure 1 shows representative NAA, mI, 18F-FDG SUVR, and FC maps of pDMN, vDMN, and aDMN, respectively. Comparisons of NAA/Cr, mI/Cr, 18F-FDG SUVR, and FC between AD and healthy control groups are shown in Figure 2. In line with previous literature4-6, we found increased mI/Cr and decreased NAA/Cr as well as FC in the pDMN of AD patients. The reduced NAA/Cr and elevated mI/Cr were also found in vDMN of AD patients. Decreased glucose metabolism was observed in all the subsystems of AD patients. The decreased NAA/Cr was positively correlated with the reduced glucose metabolism in pDMN in patients’ group, but not in healthy controls (Figure 3A and 3B). The NAA/Cr in pDMN was also correlated with patients’ Mini-Mental State Exam (MMSE) scores, indicating its relevance to cognitive impairments in AD (Figure 4A). In the vDMN system, the elevated mI/Cr was positively correlated with FC in AD patients (Figure 3C), which was also correlated with patients’ cognitive impairments (Figure 4B). Our findings may suggest that the aberrant energy metabolism (indicated by reduced glucose uptake) was related to neuronal dysfunction (indicated by reduced NAA/Cr) in pDMN system, while the aberrant functional connectivity within vDMN might be linked to the abnormal microglia activation (indicated by elevated mI/Cr) in AD, both relate to the cognitive impairment of AD patients.Conclusion
This study investigated the coupled functional and metabolic changes within the DMN subsystems by combining simultaneous 18F-FDG PET/fMRI and 3D high-resolution 1H-MRSI, and examined their contributions to cognitive decline. Our results showed that the DMN subsystems had distinct functional-metabolic features in association with cognitive decline in AD. With further study involving more patients, our investigation may provide significant insights into the system-level pathophysiology of AD.Acknowledgements
This work was supported by the National Science Foundation of China (No.61671292 and 81871083); Shanghai Jiao Tong University Scientific and Technological Innovation Funds (2019QYA12); Key Program of Multidisciplinary Cross Research Foundation of Shanghai Jiao Tong University (YG2021ZD28).References
1. Jack CR, Knopman DS, Jagust WJ, et al. Tracking pathophysiological processes in Alzheimer’s disease: an updated hypothetical model of dynamic biomarkers. Lancet Neurol. 2013;12(2):207–16.
2. Greicius MD, Srivastava G, Reiss AL, et al. Default-mode network activity distinguishes Alzheimer’s disease from healthy aging: Evidence from functional MRI. Proc. Natl. Acad. Sci. U.S.A. 2004;101(13):4637–42.
3. Jones DT, Machulda MM, Vemuri P, et al. Age-related changes in the default mode network are more advanced in Alzheimer disease. Neurology. 2011;77(16):1524–31.
4. Jones DT, Knopman DS, Gunter JL, et al. Cascading network failure across the Alzheimer’s disease spectrum. Brain. 2016;139(2):547–62.
5. Murray ME, Przybelski SA, Lesnick TG, et al. Early Alzheimer’s Disease Neuropathology Detected by Proton MR Spectroscopy. J Neurosci. 2014;34(49):16247–55.
6. Voevodskaya O, Sundgren PC, Strandberg O, et al. Myo-inositol changes precede amyloid pathology and relate to APOE genotype in Alzheimer disease. Neurology. 2016;86(19):1754–61.
7. Lam F, Liang Z-P. A subspace approach to high-resolution spectroscopic imaging. Magn Reson Med. 2014;71(4):1349–57.
8. Ma C, Lam F, Johnson CL, et al. Removal of Nuisance Signals from Limited and Sparse 1H MRSI Data Using a Union-of-Subspaces Model. Magn Reson Med. 2016;75(2):488–97.
9. Lam F, Ma C, Clifford B, et al. High-resolution 1H-MRSI of the brain using SPICE: Data acquisition and image reconstruction. Magn Reson Med. 2016;76(4):1059–70.
10. Li Y, Lam F, Clifford B, et al. A Subspace Approach to Spectral Quantification for MR Spectroscopic Imaging. IEEE Trans Biomed Eng. 2017;64(10):2486–9.
11. Cox RW. AFNI: software for analysis and visualization of functional magnetic resonance neuroimages. Comput Biomed Res. 1996;29(3):162–73.
Figures
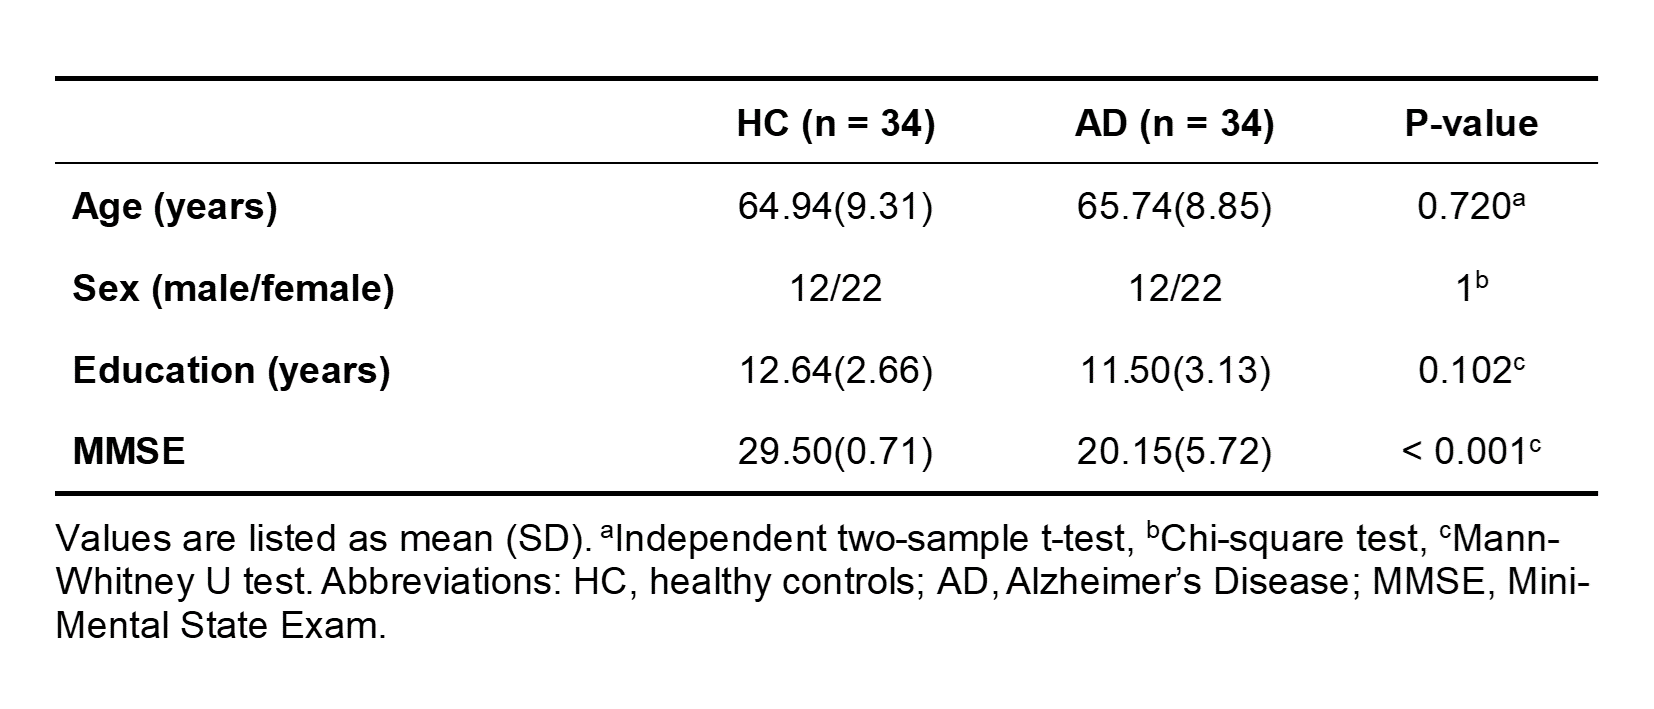
Table 1. Demographic and clinical data.