3260
Improved Multiple Sclerosis Lesion Visualization using Tailored FLAWS-MP2RAGE at 7T1Tiantan Neuroimaging Center of Excellence, Beijing Tiantan Hospital, Capital Medical University, Beijing, China, 2China National Clinical Research Center for Neurological Diseases, Beijing, China, 3Department of Neurology, Beijing Tiantan Hospital, Capital Medical University, Beijing, China, 4MR Collaboration, Siemens Healthineers Ltd., Beijing, China
Synopsis
Accurate visualization and evaluation of the MS lesions is an essential step for clinical practice. FLAWS-MP2RAGE has been proposed and applied at ultra-high field to better visualize both white matter and gray matter lesions. This work proposed the optimized method, tailored FLAWS(tFLAWS)-MP2RAGE, using a new image combination method for better lesion contrast. Results of MS patients showed higher lesion CNR of tFLAWS-MP2RAGE compared with conventional FLAWS-MP2RAGE and MPRAGE methods. This method might be a potential tool for lesion detection and evaluation at UHF for MS and other brain diseases.
Introduction
Multiple sclerosis (MS) is an inflammatory demyelinating disease that affects the central nervous system. Accurate visualization and evaluation of the MS lesions is an essential step for clinical practice. MS lesions can be delineated on T1w images as hypointense signals, and ultra-high field (UHF) 3D volumetric T1w sequences (e.g., MPRAGE, MP2RAGE) provide improved lesion visualization due to higher image resolution[1]. Recently, FLAWS (FLuid And White matter Suppression)-MP2RAGE has been proposed and applied at ultra-high field for better visualization of both white matter (WM) and gray matter (GM) lesions[2, 3]. In this work, we aimed to optimize the FLAWS-MP2RAGE processing for better MS lesion visualization using the CNR (contrast-to-noise ratio) metrics, and compare the lesion CNR and visualization with conventional methods. We hope to provide a potential UHF MRI modality for MS lesion visualization and evaluation.Theory
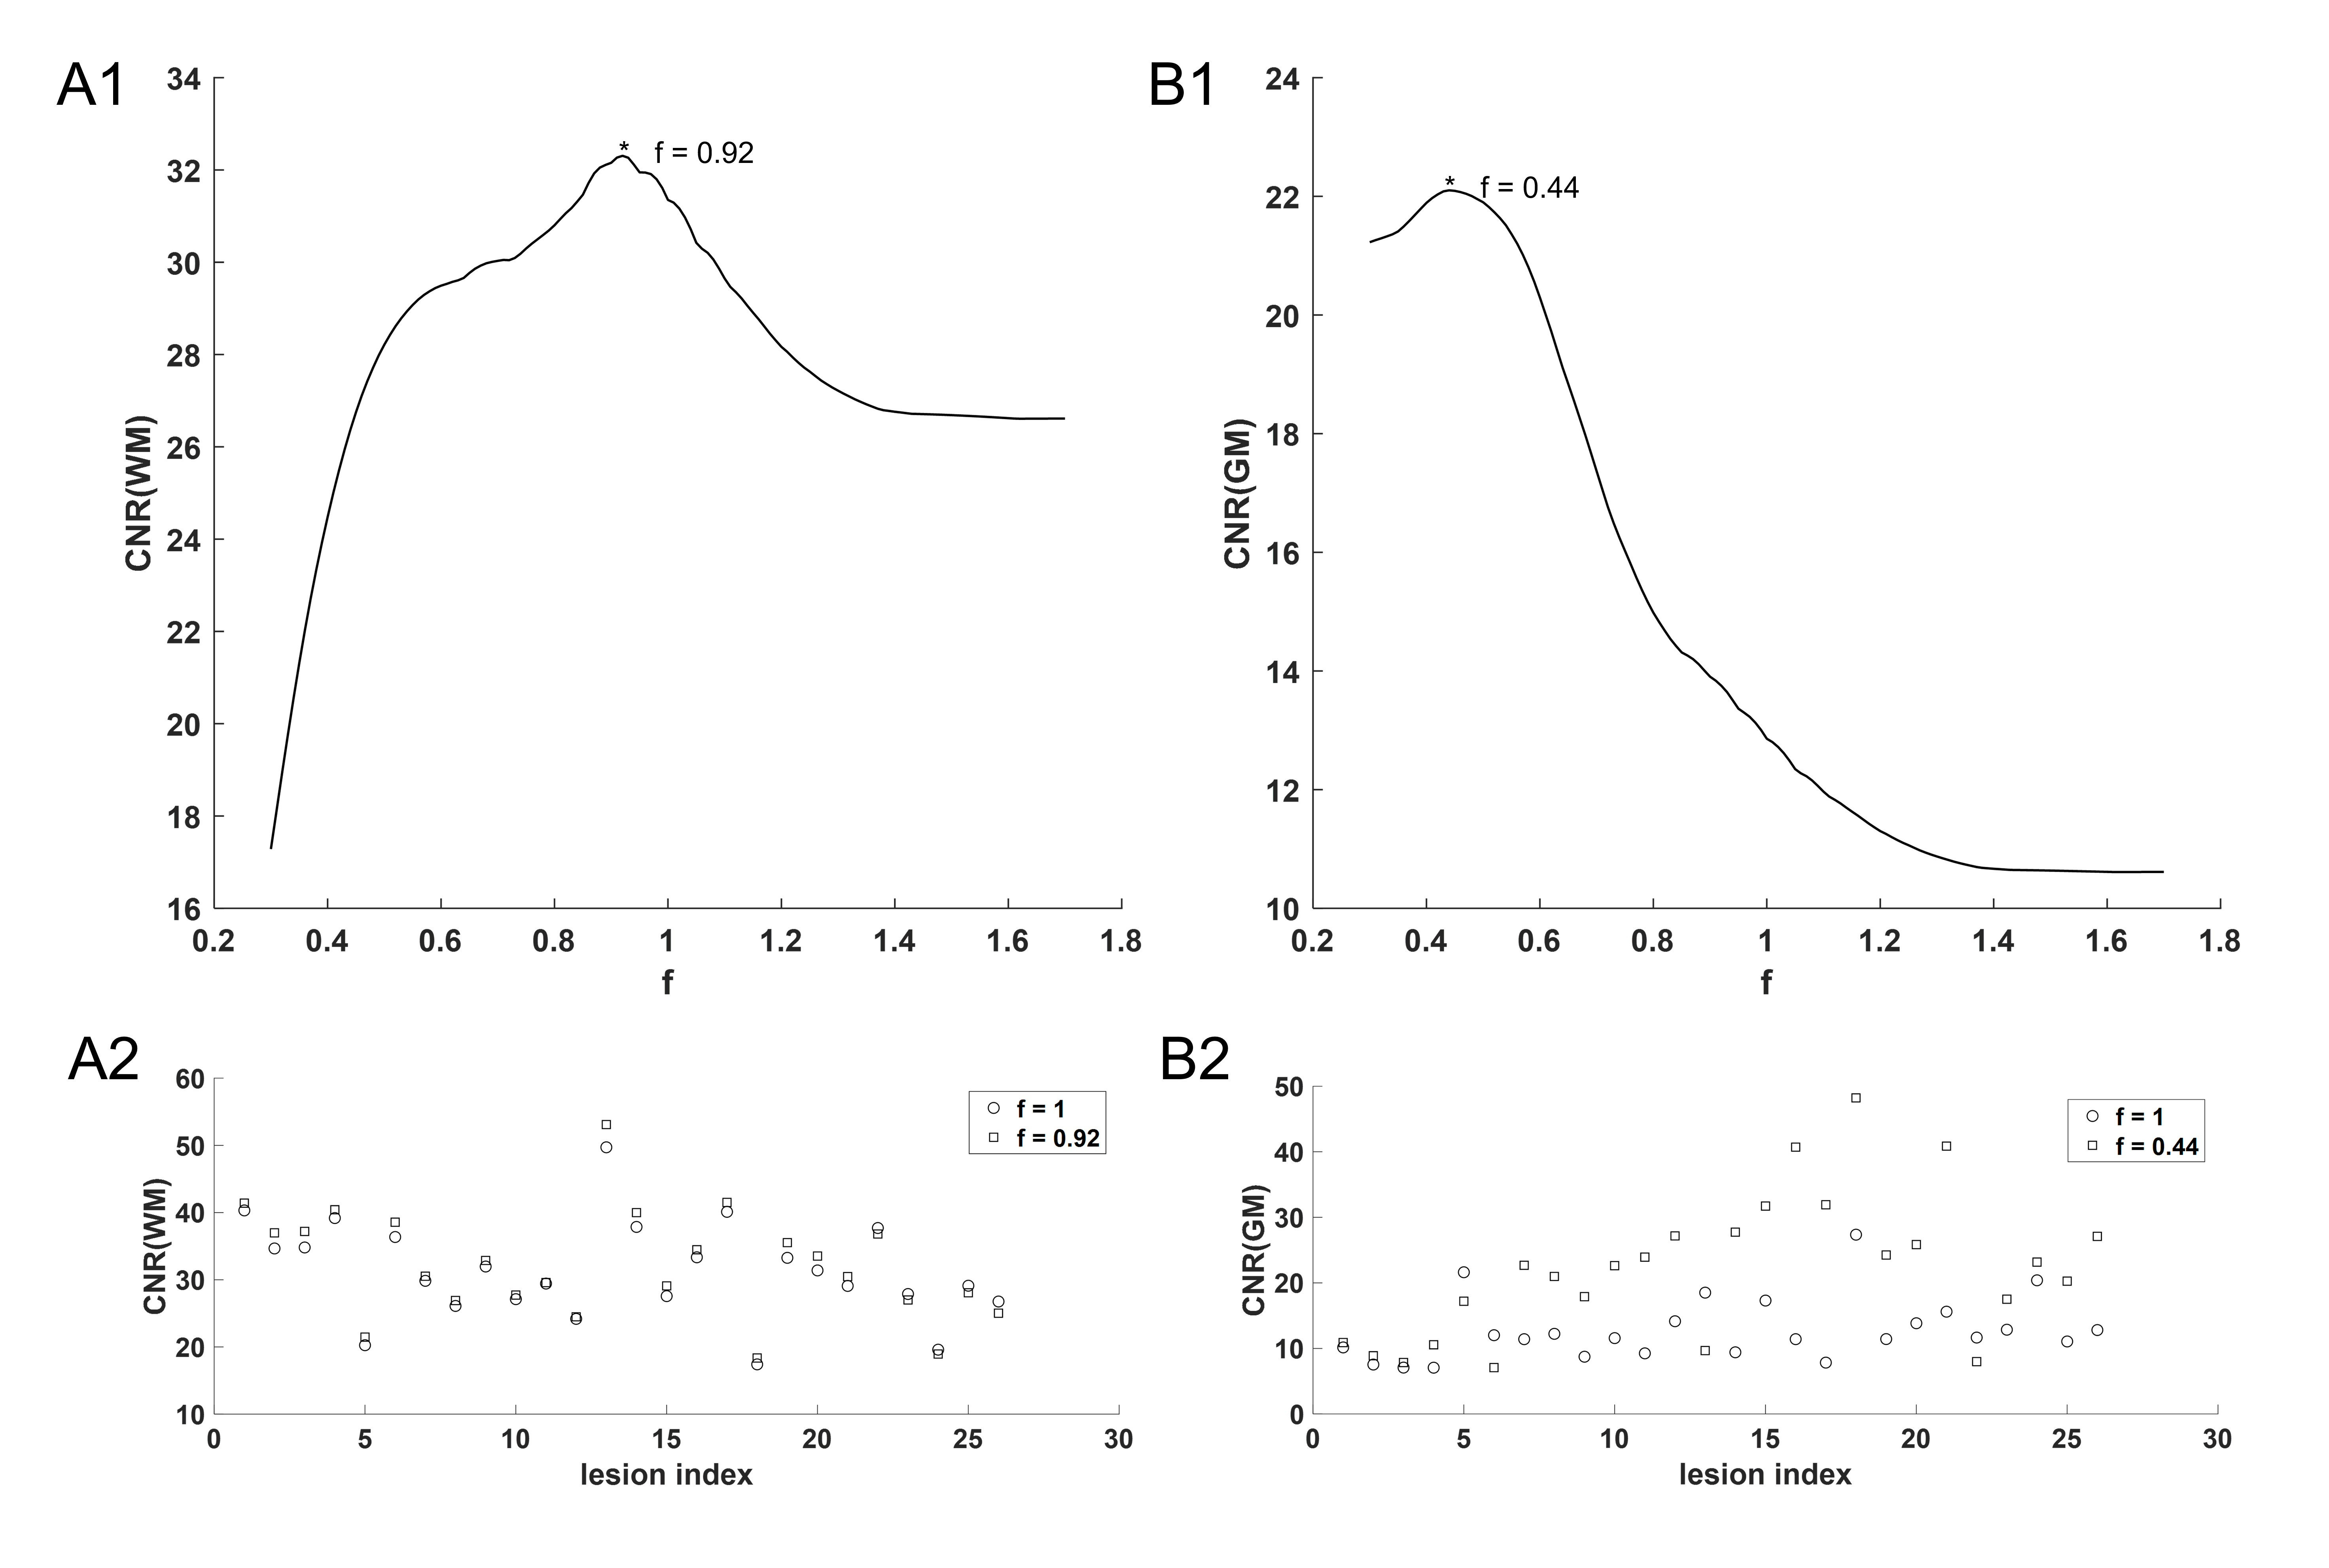
As for FLAWS-MP2RAGE, two inversion pulses are set consecutively to null the WM and CSF signals in the first (INV1) and second (INV2) volumetric images, respectively. Conventionally, the FLAWS contrast is generated by pixel-wisely computing minimum values of the two as[2, 3]: FLAWS = min(INV1, INV2). In this work, we proposed an additional factor f in the tailored FLAWS (tFLAWS) contrast generation as tFLAWS = min(INV1, f×INV2), while factor f is determined by maximizing the lesion CNR.Methods
Five MS patients (3M and 2F, age 37.2±19.0 years) were scanned on a 7T MR scanner (MAGNETOM Terra, Siemens Healthcare, Erlangen, Germany) using a 32-channel head coil. The study was approved by the local Ethical Standards Committee, and written informed consent was obtained from all participants. The parameters for FLAWS-MP2RAGE were: resolution = 0.75 mm isotropic, TI1/TI2/TR = 700/1700/5000 ms, parallel imaging acceleration = 3 and total scan time = 8:52. Other MR sequences include T1w MPRAGE, SWI, T2*w and T2w imaging.The MS lesion ROIs at the brainstem were manually drawn on INV2 image of FLAWS-MP2RAGE sequence (CSF-nulled, T1w contrast) as hypointense signals (also refer to other contrasts). The WM/GM and background ROIs were also drawn for each subject using a 2D disk with a 5mm radius. The CNR was calculated for each lesion for both lesion-to-WM and lesion-to-GM contrast using CNR = |S(lesion)-S(tissue)|/σ(background). The factor f was determined using an exhaustive search for maximizing the CNR. The tFLAWS was generated using the prescribed f and compared with other contrasts. The lesion CNRs of tFLAWS-MP2RAGE were compared with conventional FLAWS-MP2RAGE and MPRAGE.
Results
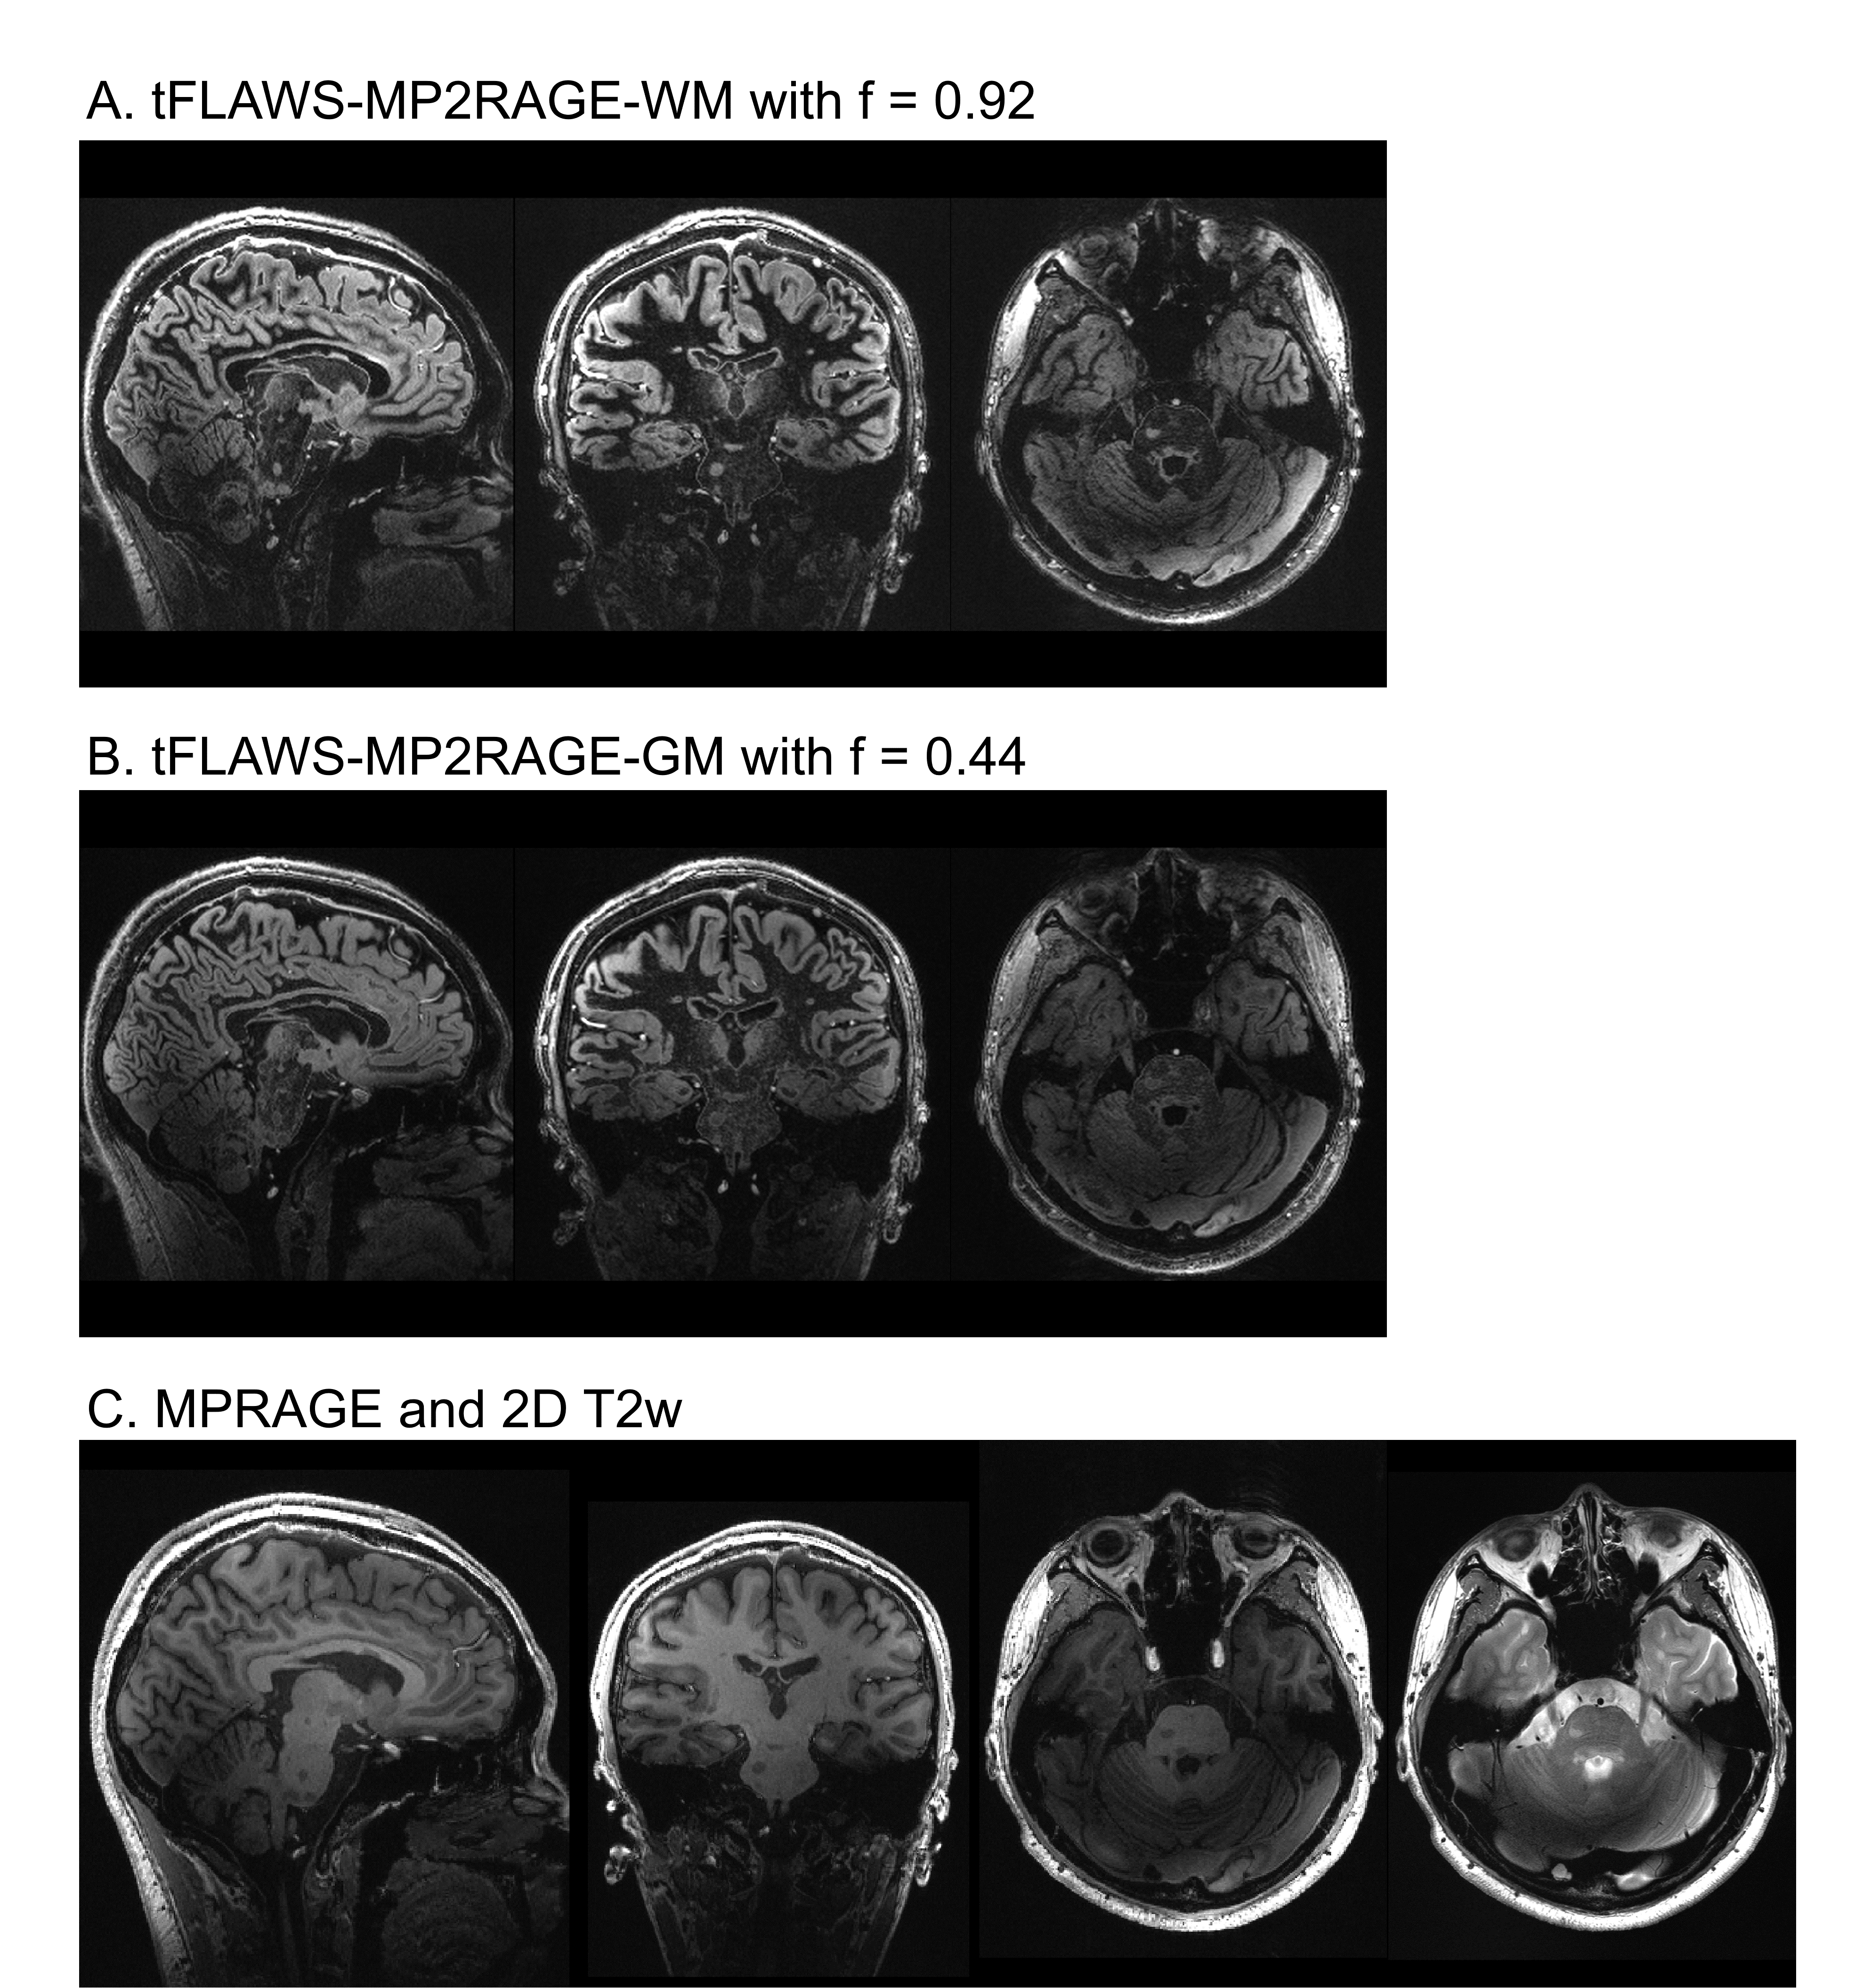
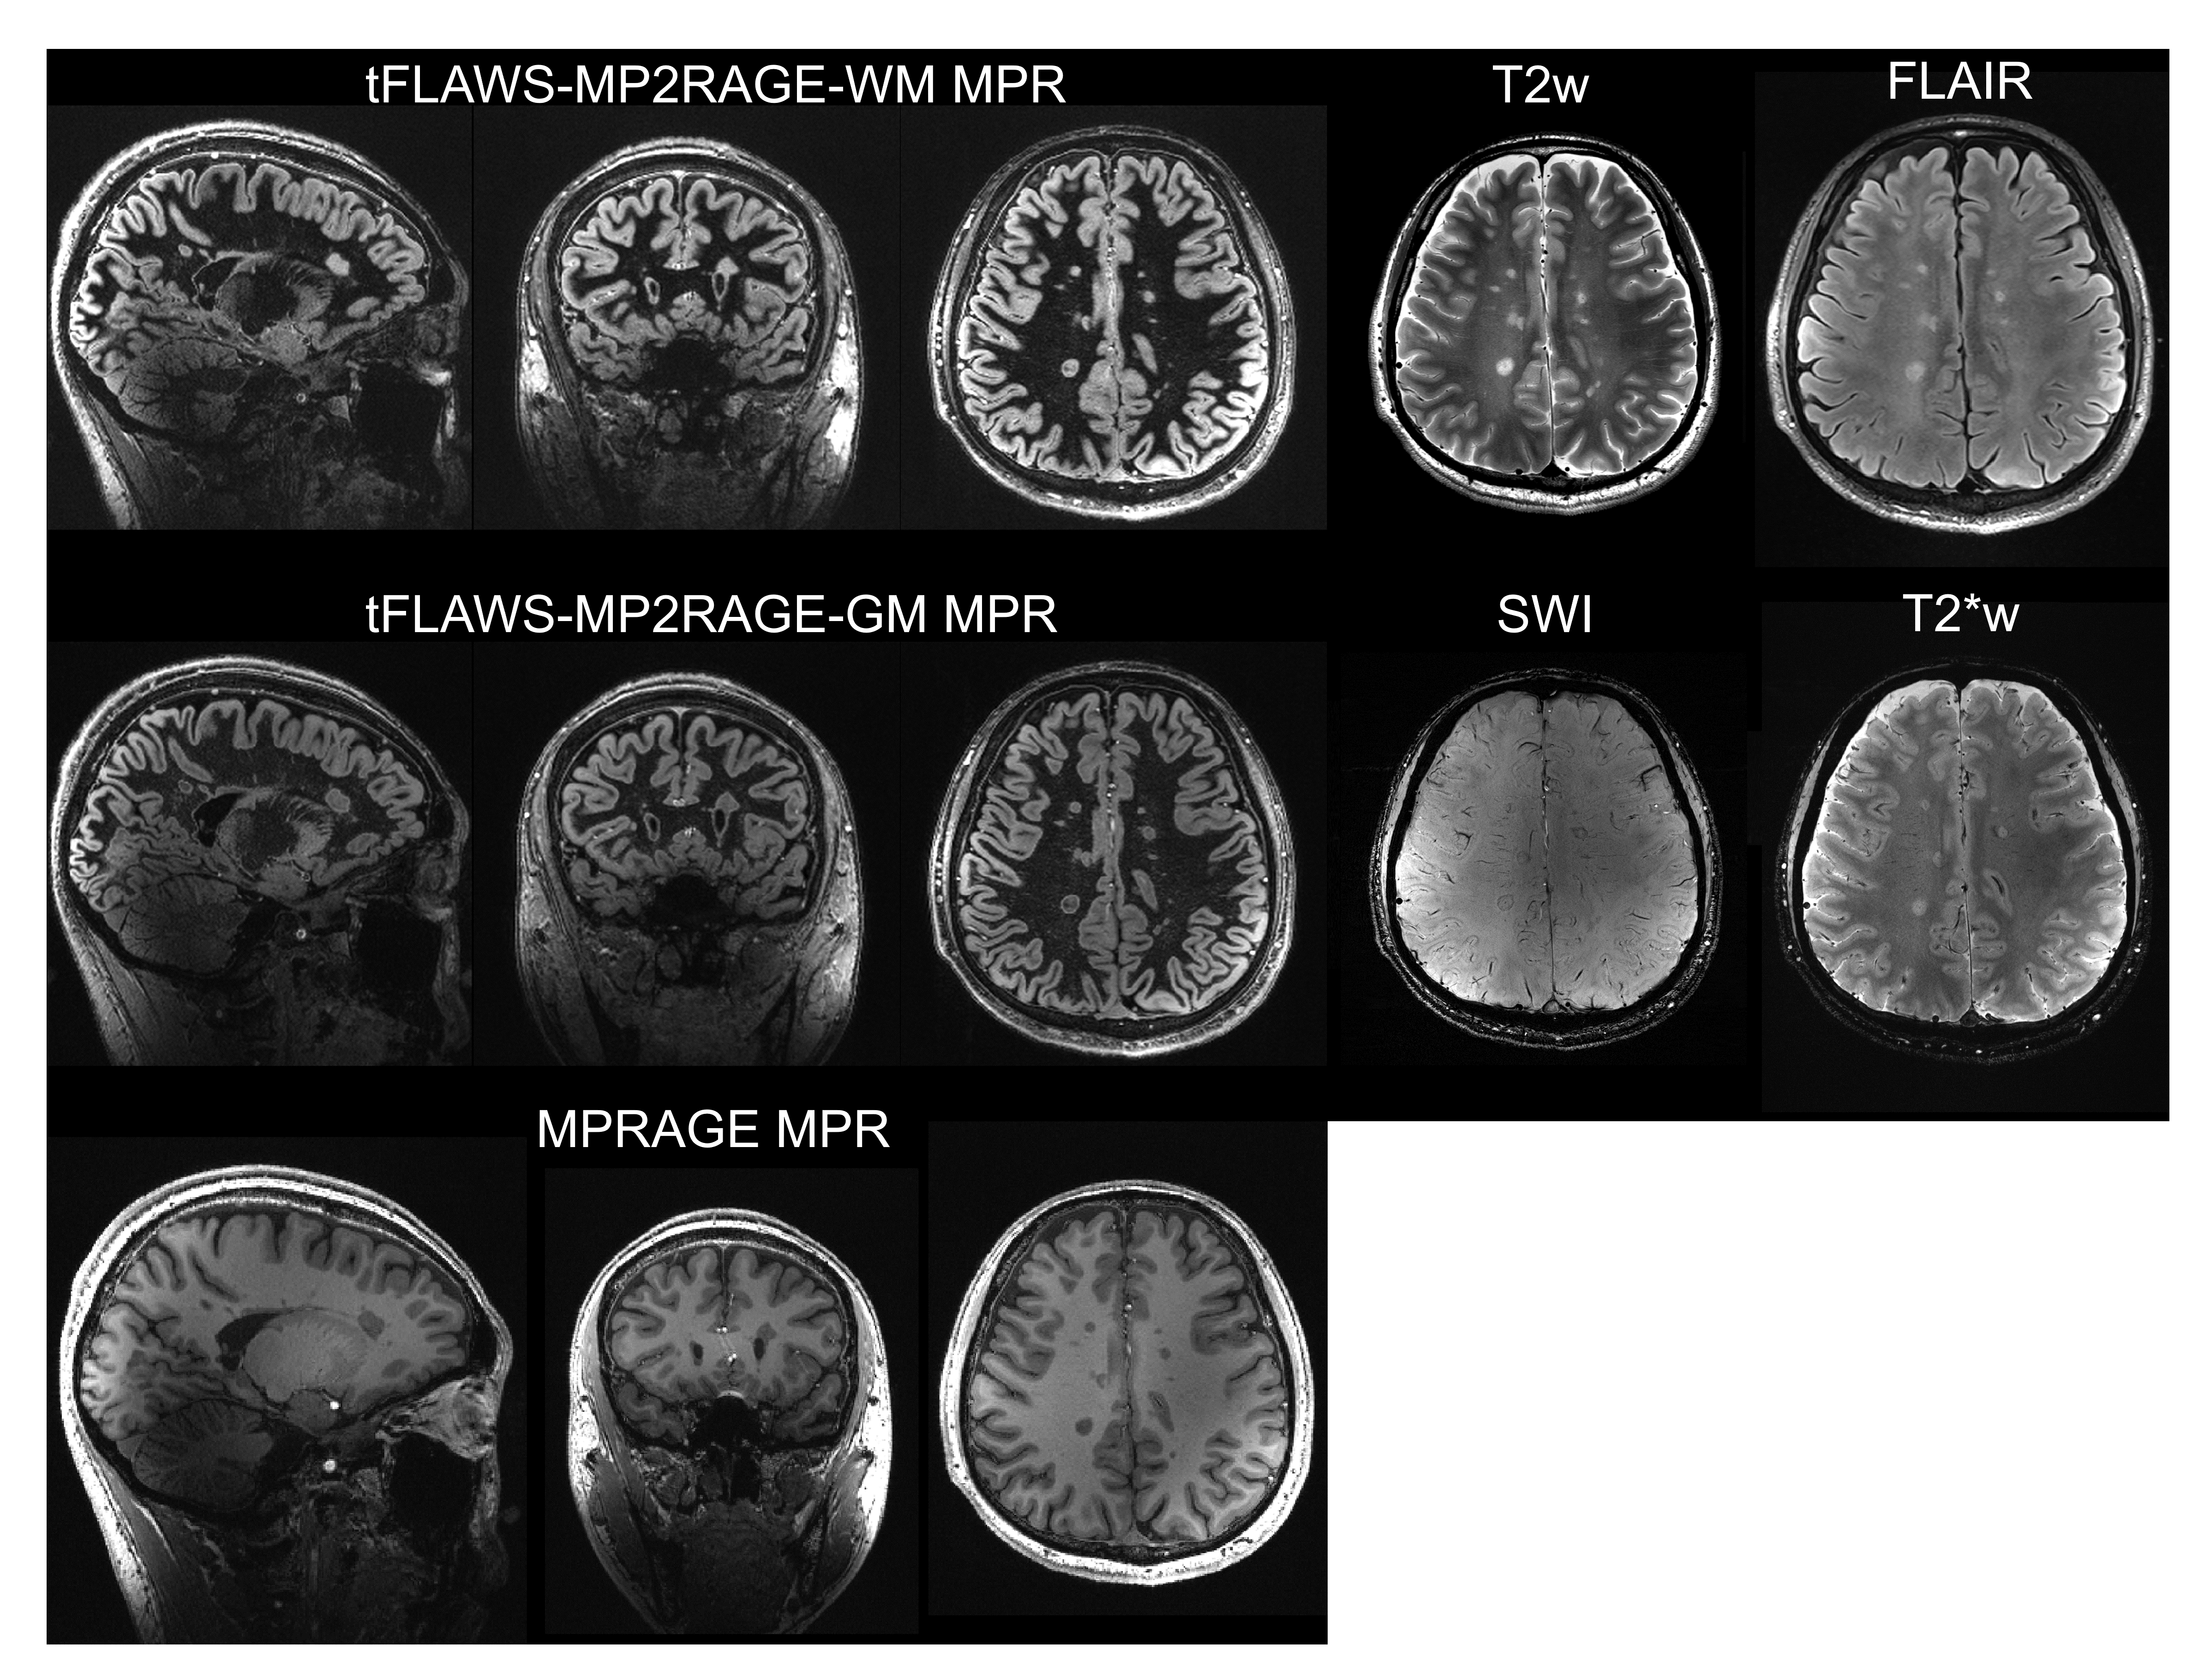
For the 5 patients, 26 (5/7/0/9/5 for each subject) brainstem MS lesions were observed. The change of lesion-to-WM and lesion-to-GM CNRs with factor f was plotted in Figure 1 (A1, B1). The f for maximizing lesion-to-WM/GM CNR was 0.92/0.44 with a mean CNR of 32.3/22.1, respectively; while the conventional FLAWS-MP2RAGE (f=1) has the mean CNR of 31.4/12.9. The tFLAWS-MP2RAGE-WM and tFLAWS-MP2RAGE-GM have significantly higher CNR than conventional FLAWS-MP2RAGE (p<0.001 and p<0.001 using paired t-test, data in Figure 1 A2, B2), and significant higher CNR than conventional MPRAGE (32.3 vs. 18.0 with p<0.001, and 22.1 vs. 15.7 with p<0.001, using paired t-test). The tFLAWS-MP2RAGE-WM and tFLAWS-MP2RAGE-GM images were generated using the mentioned f values, and compared with other contrasts in Figure 2. MS lesions at the brainstem can be delineated on both tFLAWS-MP2RAGE images (hyperintense signals on tFLAWS-MP2RAGE-WM and hyperintense signals with a brighter rim on tFLAWS-MP2RAGE-GM). Using the same f factor for processing, the MS lesions around the centrum semiovale can also be delineated, confirmed by referring to other MR modalities (Figure 3).Discussion
In this study, we optimized the image generation method of FLAWS-MP2RAGE, in order to optimize the lesion contrast in MS patients. Preliminary showed that by introducing the tailoring factor f, the tFLAWS-MP2RAGE could achieve higher lesion CNR compared to traditional FLAWS-MP2RAGE and MPRAGE. When optimizing the lesion-to-GM CNR, the factor was reduced to 0.42, much smaller than conventional 1.0 or 0.92 for WM. The tFLAWS-MP2RAGE-GM provided a unique contrast with a hyperintense rim, which may help delineate lesion contour, especially for cortical or subcortical lesions. However, this hyperintense rim may not correlate with the hypointense rim sign for MS on SWI/T2*w, which reflects iron contents. The lesion characteristics on tFLAWS-MP2RAGE-GM may be interpreted with care, and need further research was needed.Also, the factor f in tFLAWS was determined by the lesion CNR at the brainstem in the experiment. Although results showed good contrast at centrum semiovale regions, the optimized f for different brain parts, even considering B1+/B1- field inhomogeneity, worths further study.
MP2RAGE sequence provides two distinct contrast, and careful design of the pulse sequence may provide opportunities for image homogeneity correction, relaxation time mapping, novel contrast and tissue segmentation[4,5]. For tFLAWS-MP2RAGE in this work, we only optimized the post-processing of the images. Future work can extend to the optimization of the sequence parameter considering the tissue/lesion relaxation time for further improvement of the lesion contrast.
Conclusion
The optimized the FLAWS-MP2RAGE method, tFLAWS-MP2RAGE was proposed with better lesion contrast compared with conventional methods. This method might be a potential tool for lesion detection and evaluation at UHF for MS and other brain diseases.Acknowledgements
This work was supported in part by the Capital Medical University (PYZ20092).References
1. Beck ES, Piccirelli M, Reich DS. New Prospects for Ultra-High-Field Magnetic Resonance Imaging in Multiple Sclerosis. 2021;56:773–784. doi: 10.1097/RLI.0000000000000804.
2. Tanner M, Gambarota G, Kober T, Krueger G, Erritzoe D, Marques JP, Newbould R. Fluid and white matter suppression with the MP2RAGE sequence. J. Magn. Reson. Imaging. 2012;35:1063–1070. doi: 10.1002/jmri.23532.
3. Urushibata Y, Kuribayashi H, Fujimoto K, Kober T, Grinstead JW, Isa T, Okada T. Advantages of fluid and white matter suppression (FLAWS)with MP2RAGE compared with double inversion recovery turbo spin echo (DIR-TSE)at 7T. Eur. J. Radiol. 2019;116:160–164. doi: 10.1016/j.ejrad.2019.04.019.
4. Marques JP, Kober T, Krueger G, Zwaag W Van Der. NeuroImage MP2RAGE , a self bias- field corrected sequence for improved segmentation and T 1 -mapping at high field. Neuroimage. 2010;49:1271–1281. doi: 10.1016/j.neuroimage.2009.10.002.
5. Marques JP, Kober T, Krueger G, van der Zwaag W, Van de Moortele PF, Gruetter R. MP2RAGE, a self bias-field corrected sequence for improved segmentation and T1-mapping at high field. Neuroimage. 2010;49:1271–1281. doi: 10.1016/j.neuroimage.2009.10.002.
Figures