3256
Glutamatergic dysfunction associated with tau depositions in Alzheimer’s disease1Department of Functional Brain Imaging, Institute for Quantum Medical Science, Quantum Life and Medical Science Directorate, National Institutes for Quantum Science and Technology, Chiba-shi, Japan, 2Department of Psychiatry, Nara Medical University, Kashihara-shi, Japan, 3Department of Advanced Nuclear Medicine Sciences, Institute for Quantum Medical Science, Quantum Life and Medical Science Directorate, National Institutes for Quantum Science and Technology, Chiba-shi, Japan, 4Department of Functional Neurology & Neurosurgery, Center for Integrated Human Brain Science, Brain Research Institute, Niigata University, Niigata-shi, Japan
Synopsis
Glutamatergic neurons and cingulate cortices have crucial roles in the cognitive dysfunction of Alzheimer's disease (AD). This study aimed to evaluate regional vulnerabilities of the glutamatergic system in AD at the level of the cingulate gyrus in relation to tau and amyloid-β (Aβ) depositions. Combining MRSI and PET, we found that the glutamatergic system in the posterior cingulate cortex (PCC) is vulnerable to tau deposits but not Aβ from the early stage of AD, and glutamate in the PCC region may be a marker of disease progression in AD.
INTRODUCTION
Glutamatergic system is a primary neurotransmitter system in cognitive function. 1 Although there is accumulating evidence that glutamate (Glu) in the cingulate cortices play a crucial role in the pathophysiology of Alzheimer's disease (AD) 2, the associations between aggregated tau and amyloid-β (Aβ), and glutamatergic dysfunction in the regions remain elusive. Since most of the single-voxel spectroscopy (SVS) studies have investigated alterations of Glu levels in the posterior cingulate cortex (PCC), regional alterations of Glu in the cingulate cortices and the surrounding white matter (WM) are unclear. 3 This study aimed to evaluate regional alterations of Glu at the level of the cingulate gyrus in relation to tau and Aβ depositions in AD and mild cognitive impairment (MCI) patients using magnetic resonance spectroscopic imaging (MRSI) and PET imaging.METHODS
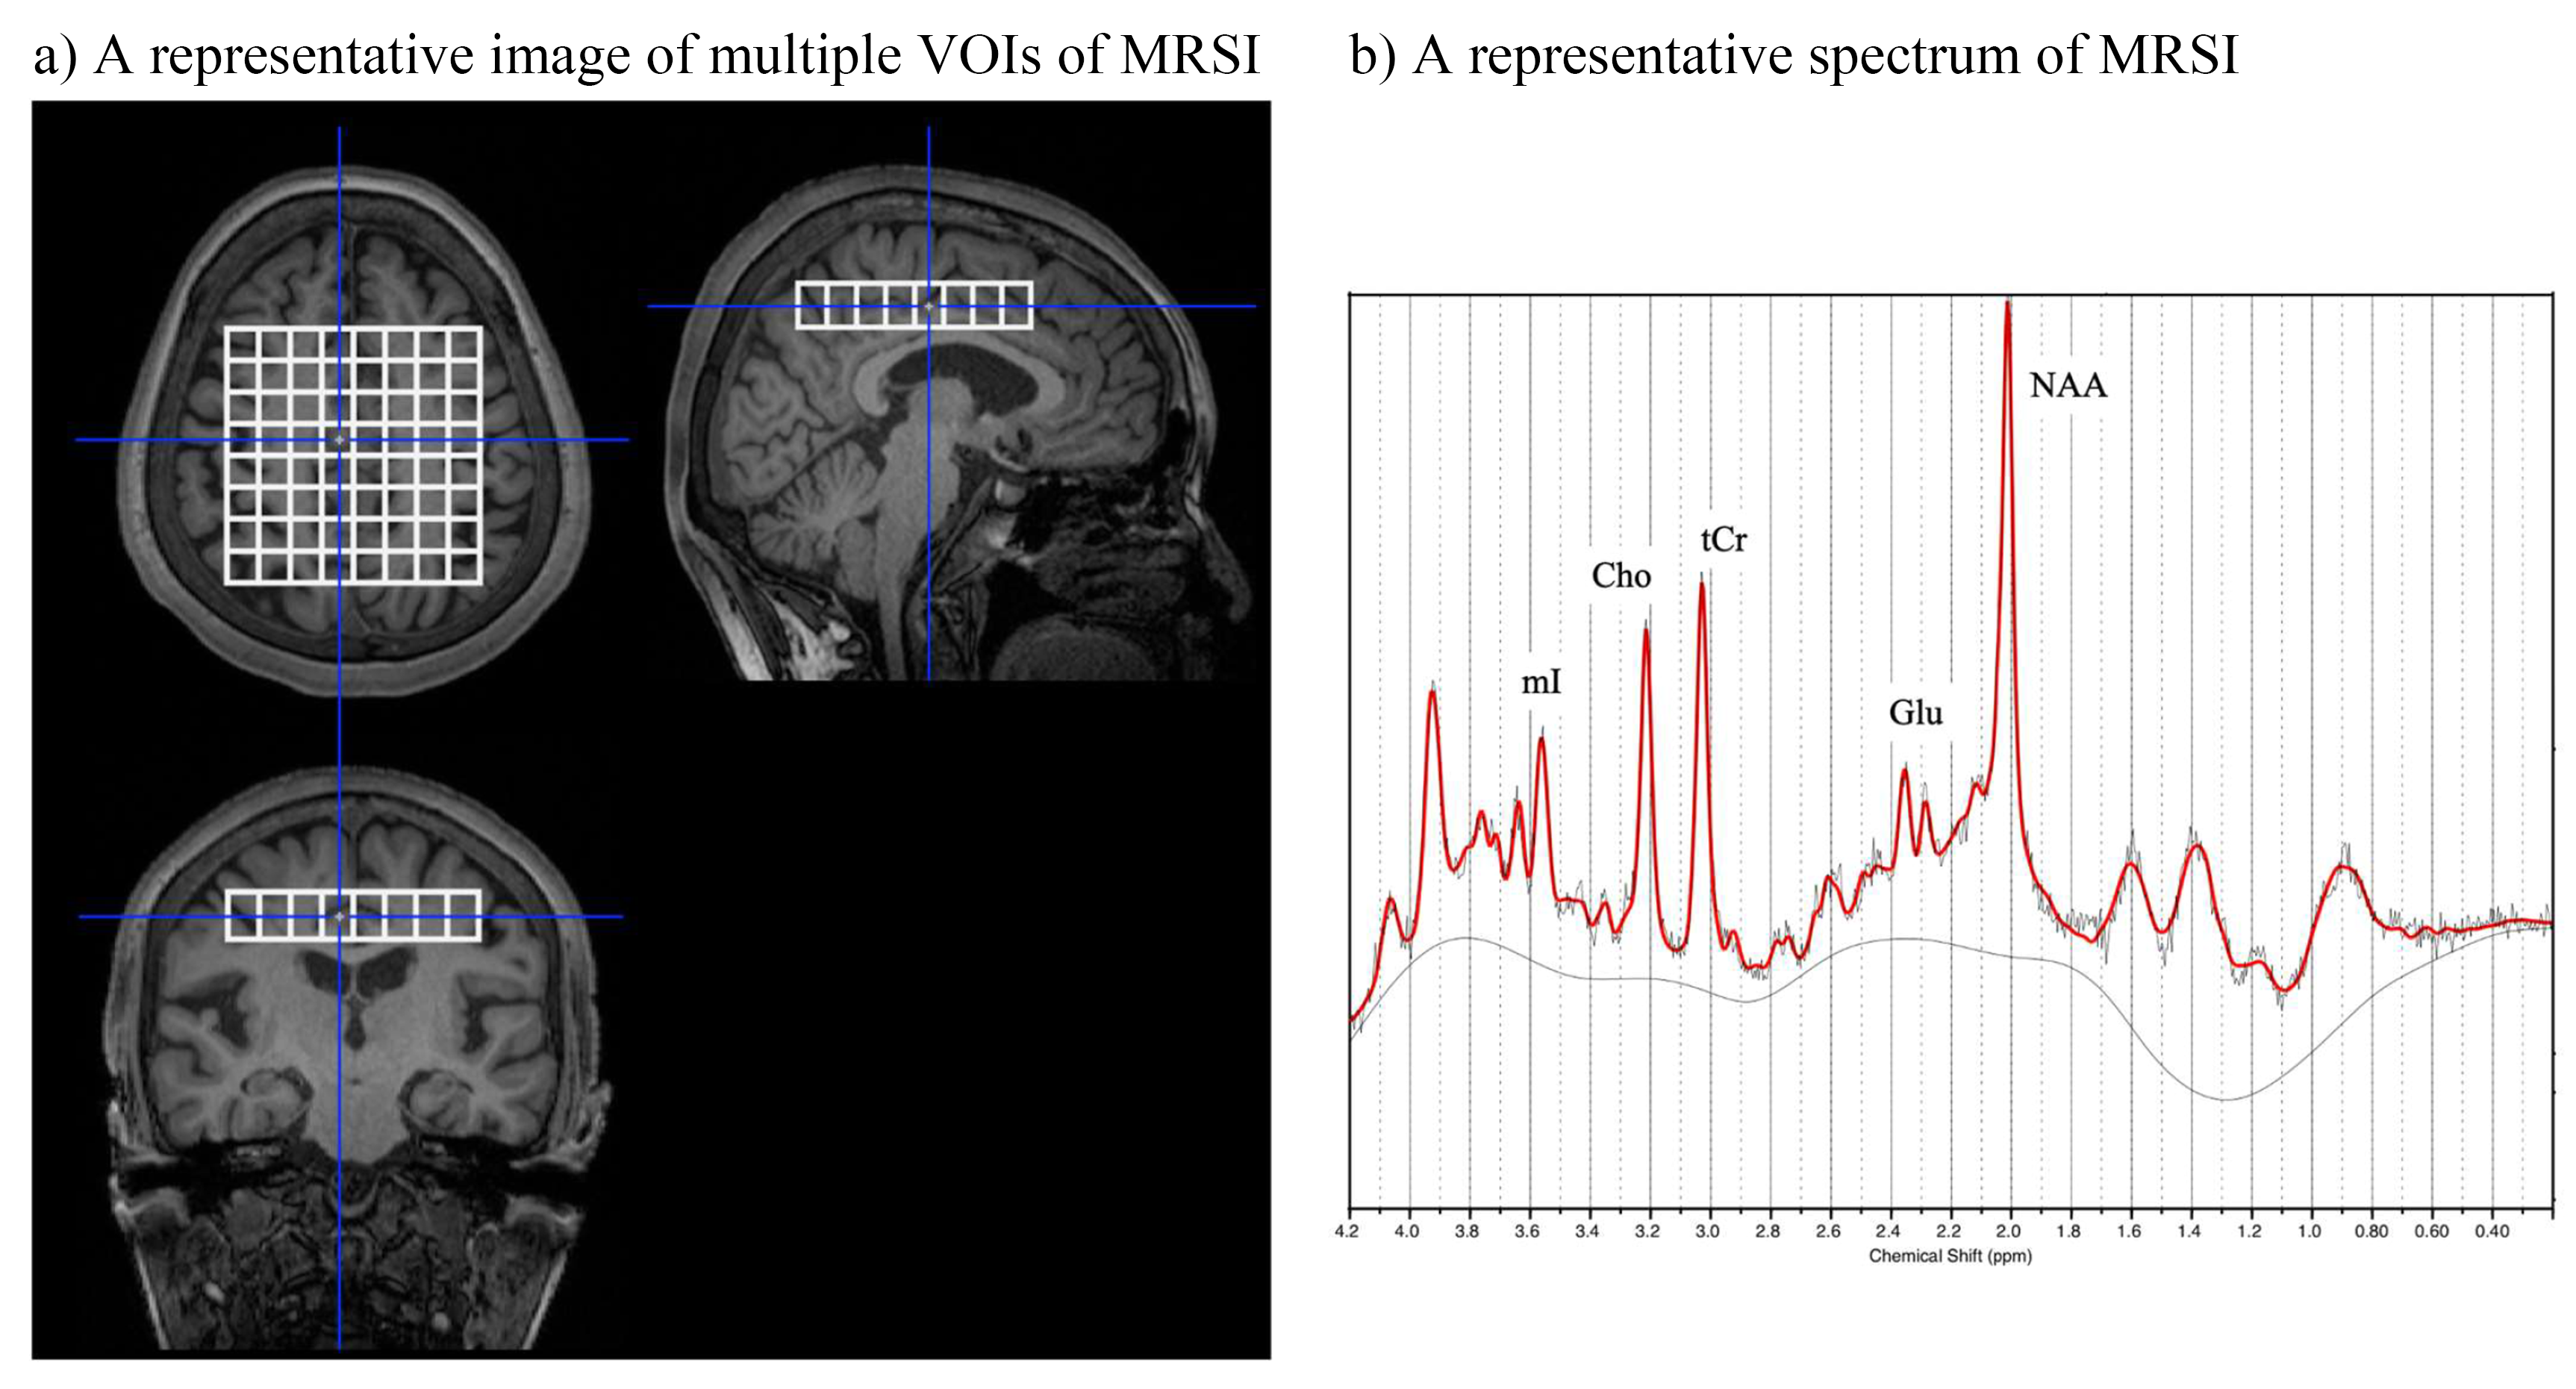
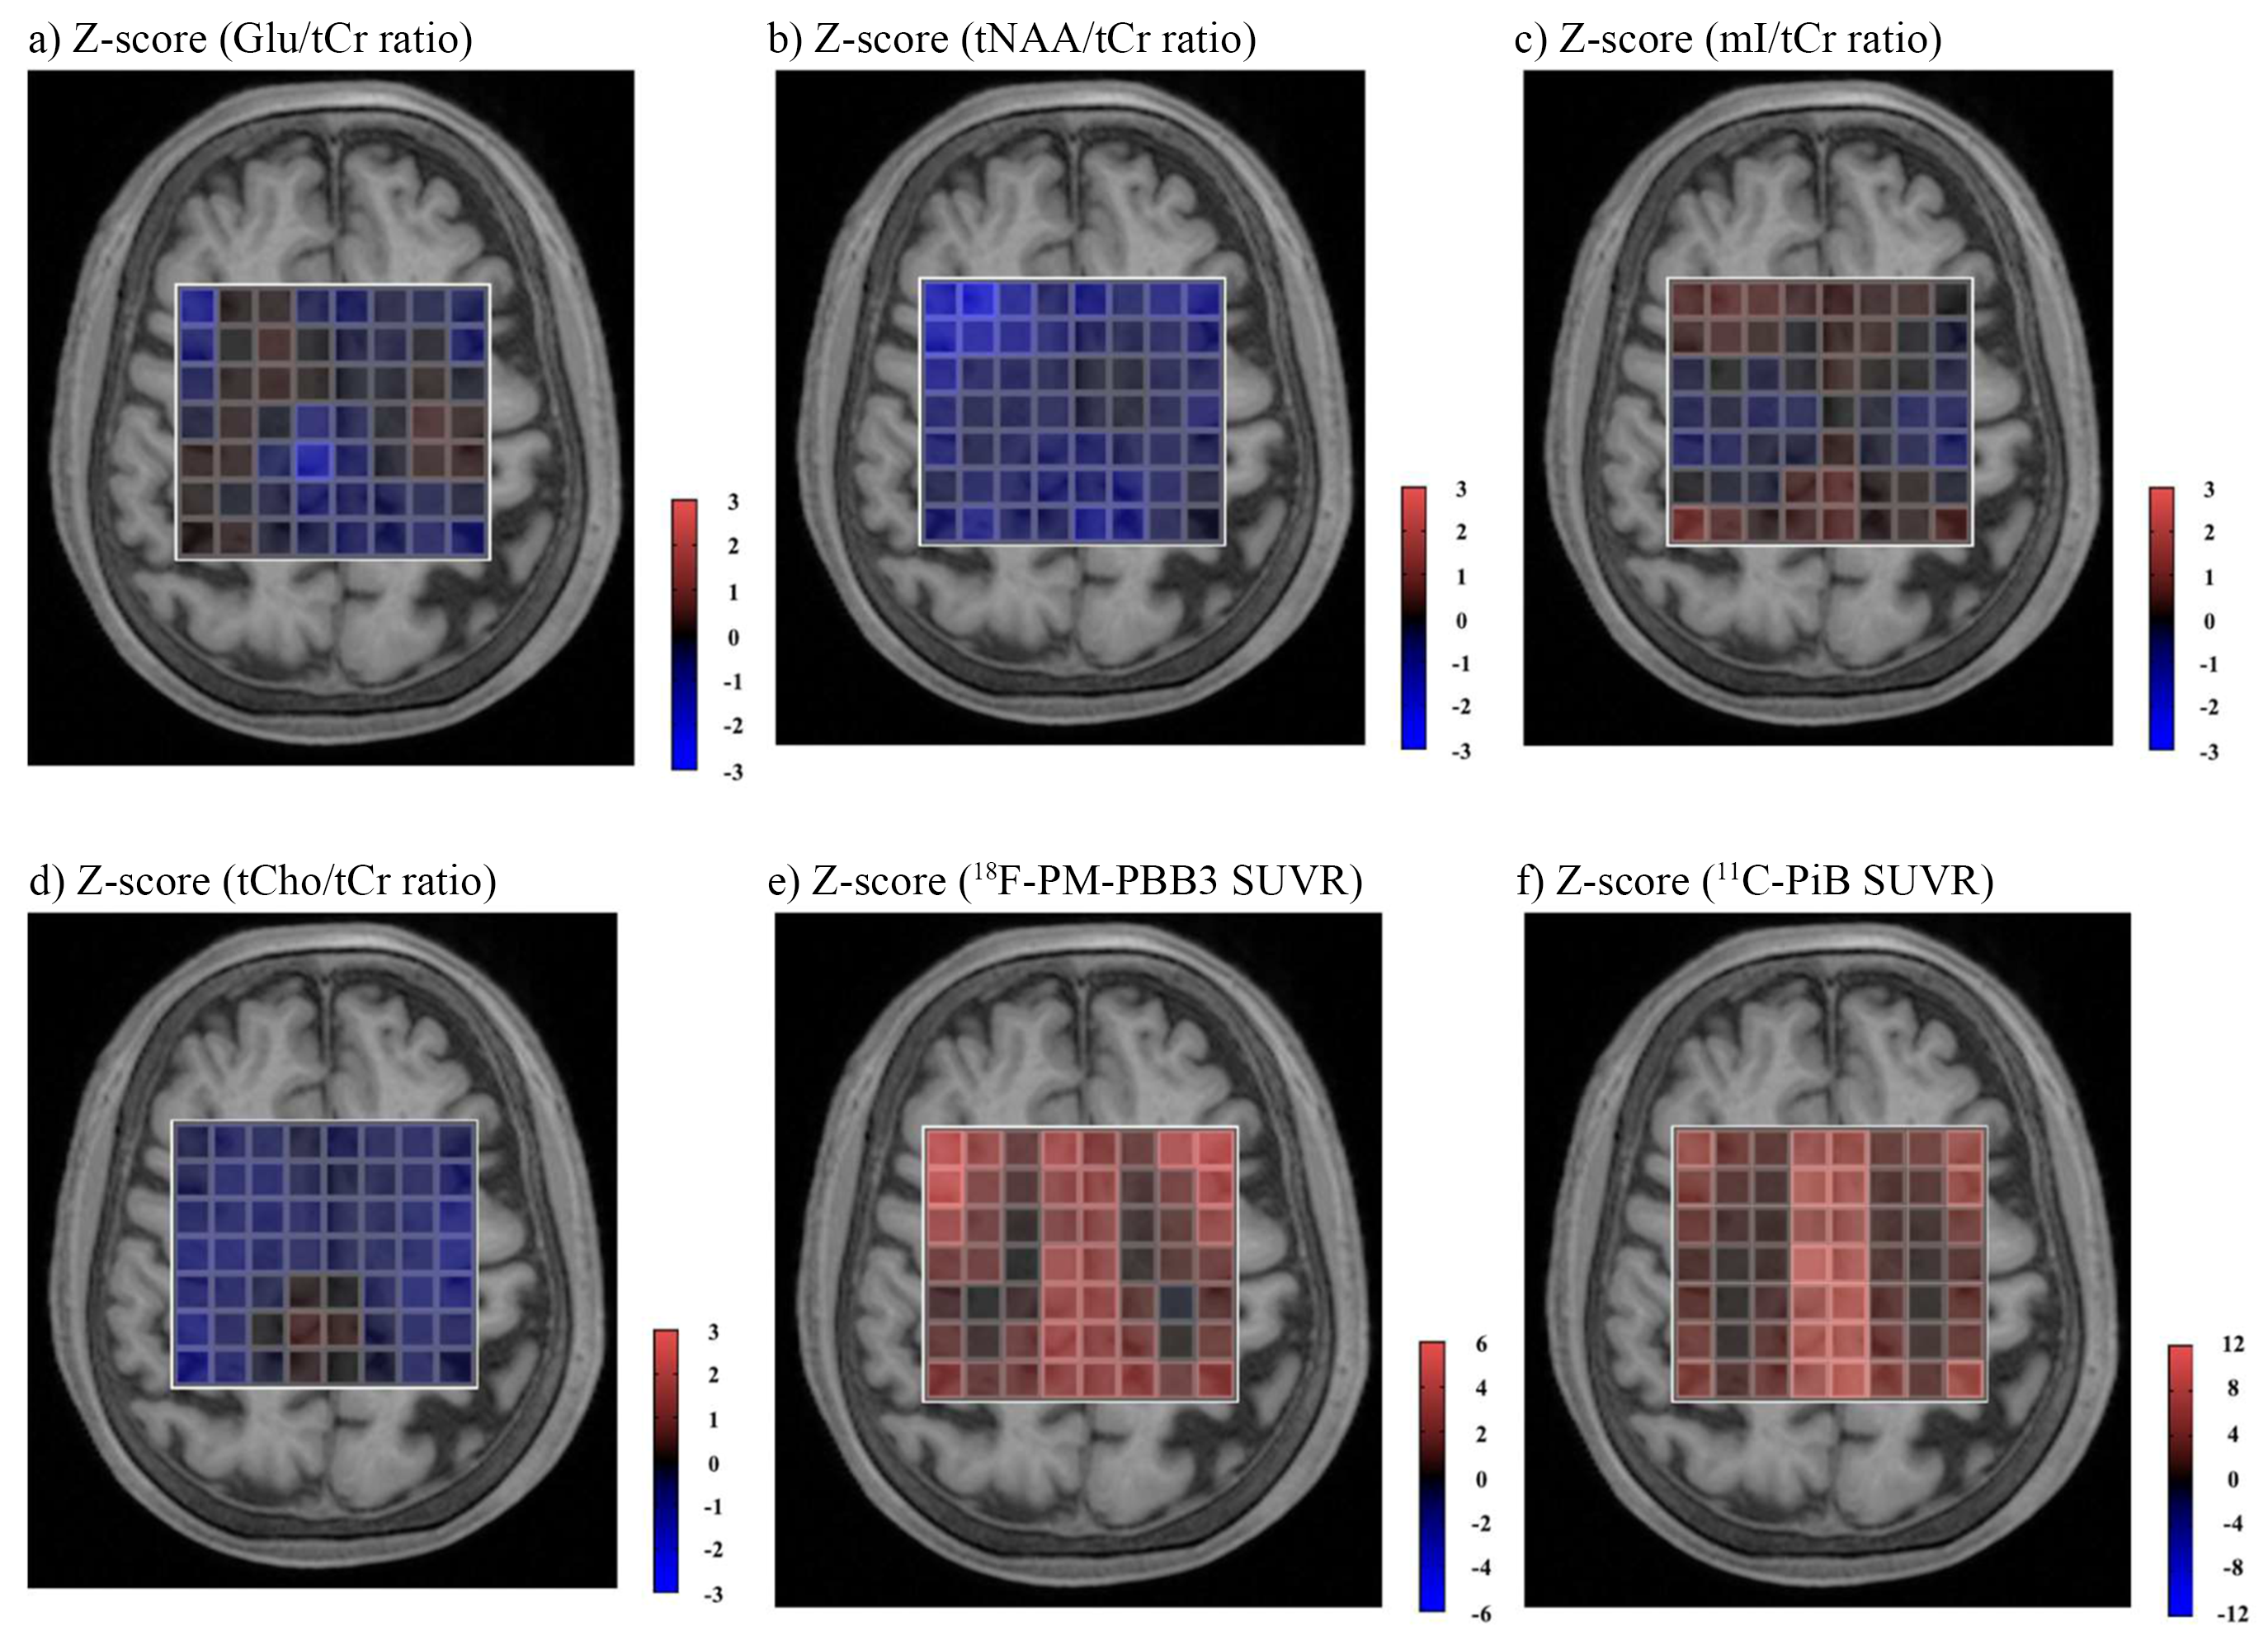
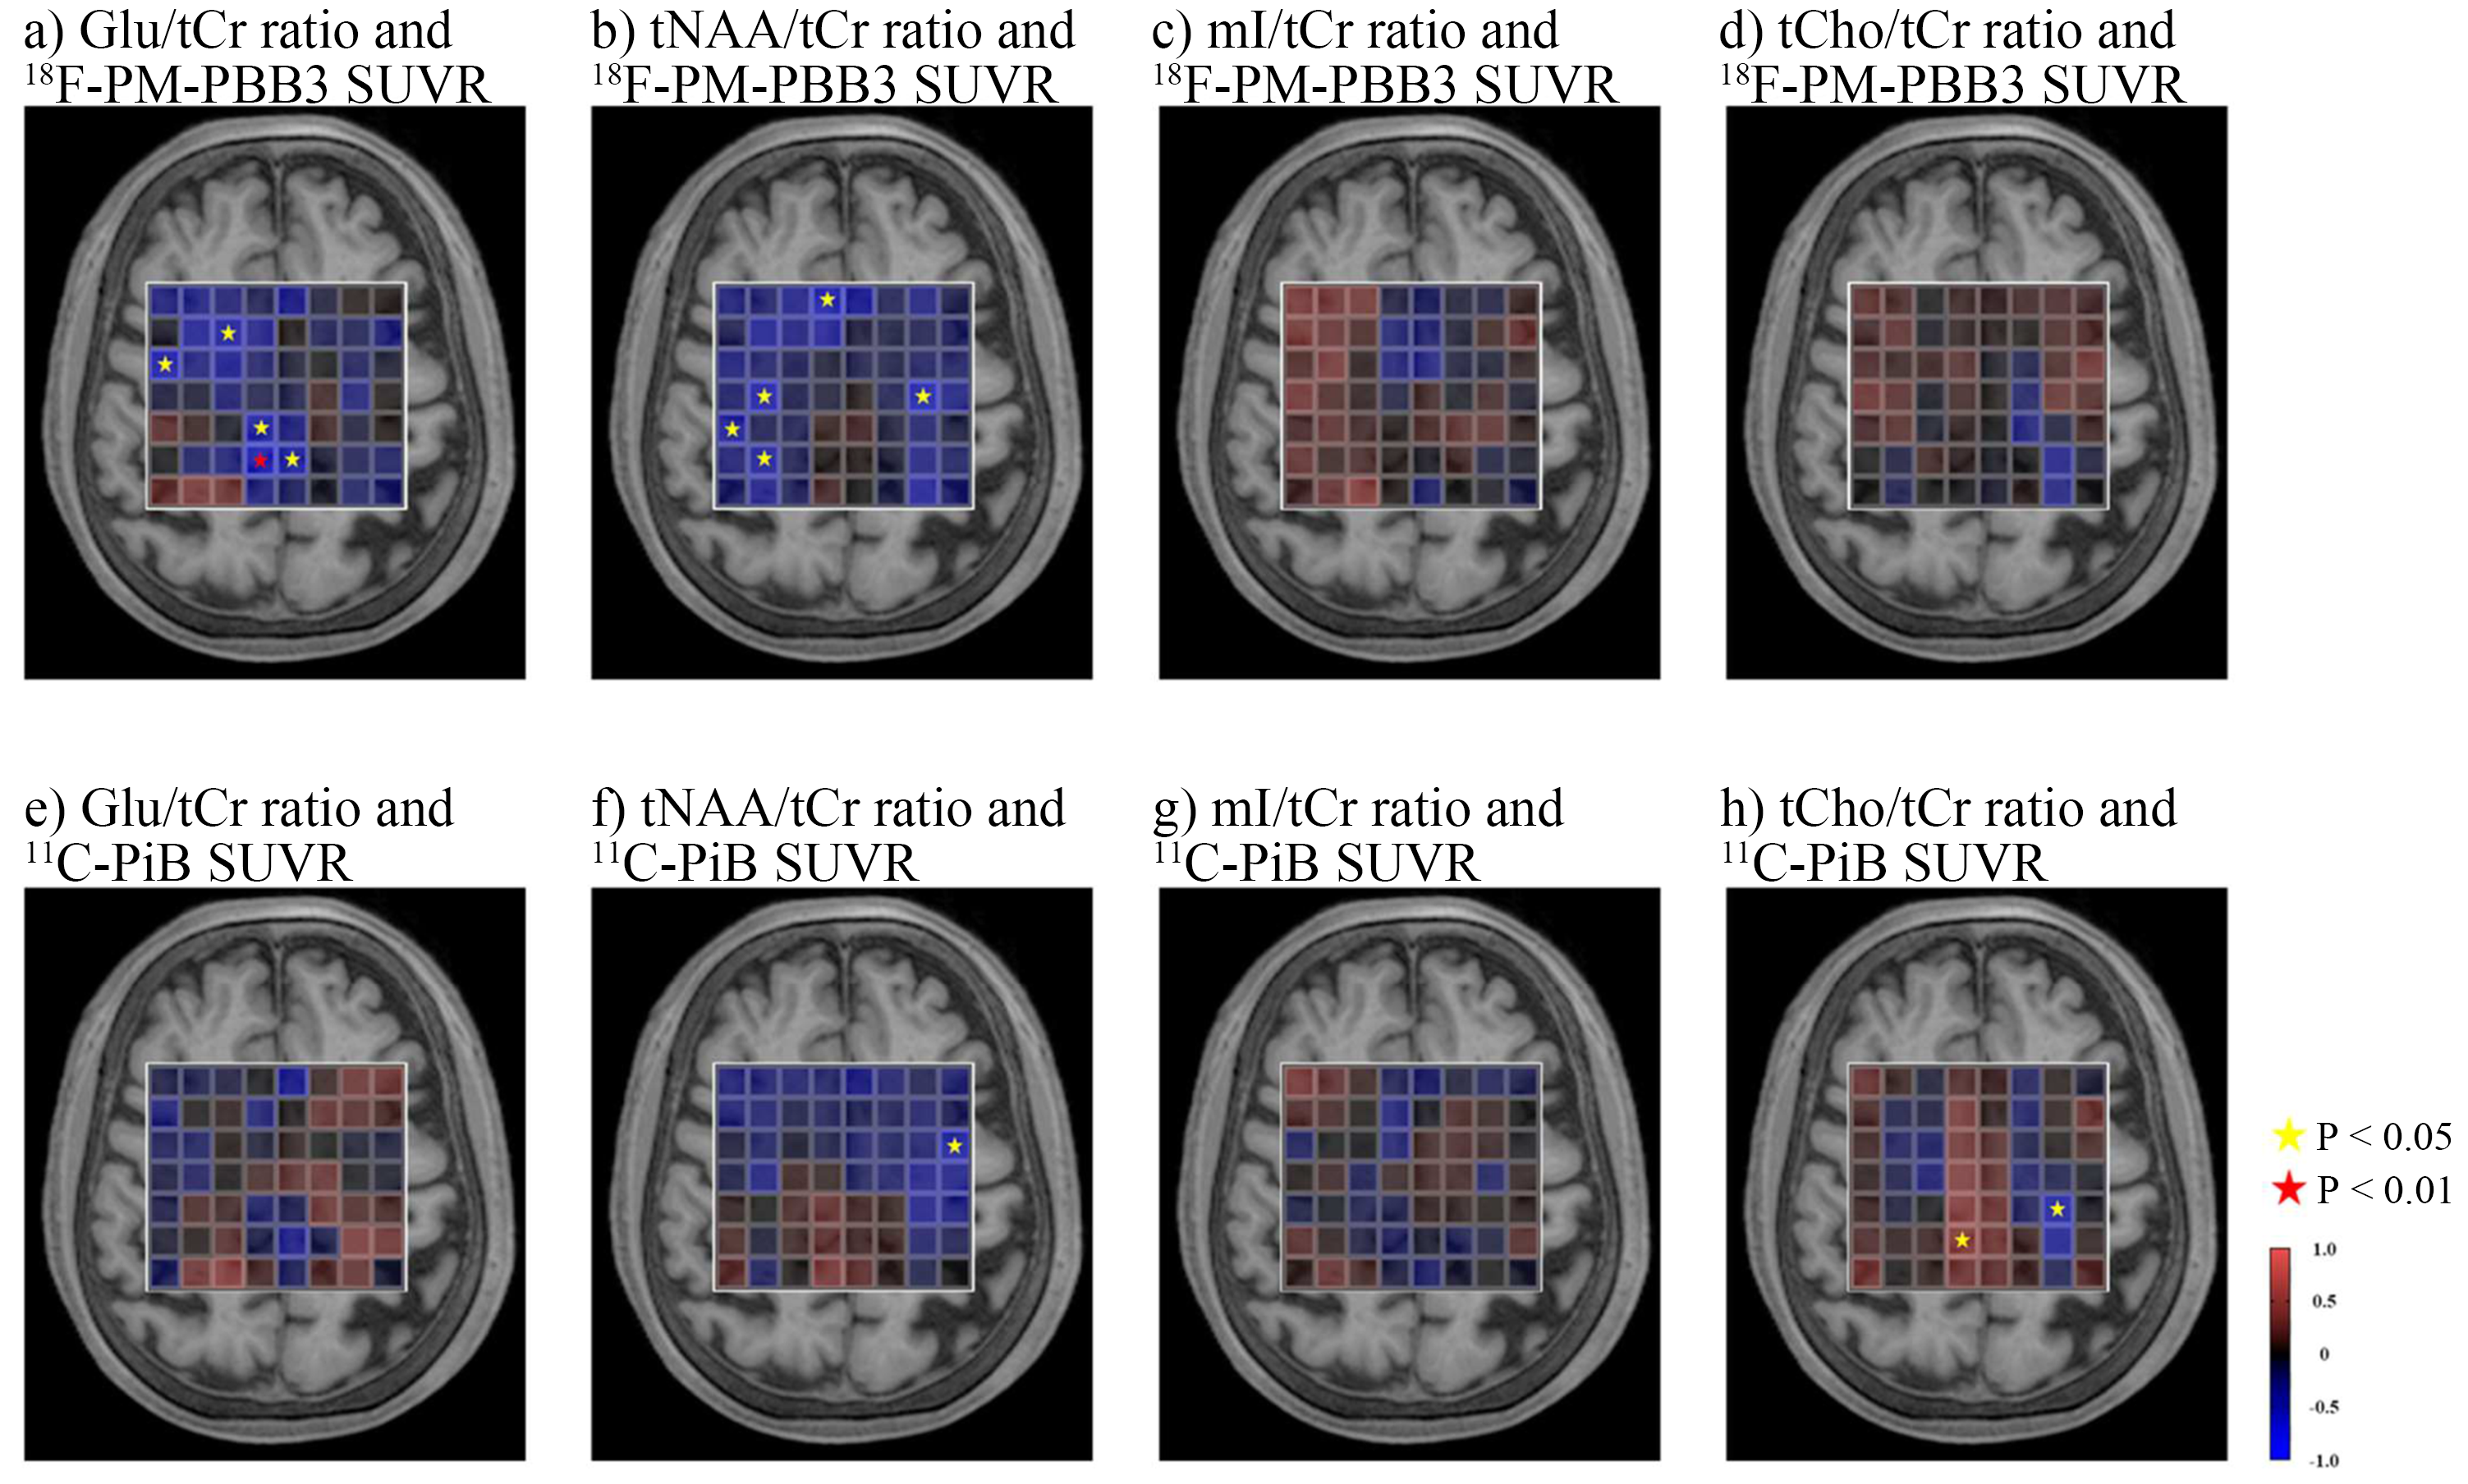
We enrolled 16 MCI/AD patients (6 MCI and 10 AD patients) with positive Aβ pathology confirmed by 11C-PiB PET and 15 healthy controls (HCs) without Aβ pathology. We evaluated Glu, total N-acetylaspartate (tNAA), myo-inositol (mI), and total choline (tCho) to total creatine (tCr) ratio using single-plane MRSI to investigate spatial information at the level of the cingulate gyrus. We acquired MRSI data with point-resolved spectroscopy (PRESS) pulse sequence (TR/TE/average = 2000 ms / 30 ms / 3) in every single volume of interest (VOI) of 10 × 10 × 15 mm3 [the measurement volume of the central 8 × 8 voxels (white line voxels in Figure 1)]. We analyzed MRSI data using LCModel software. We set the exclusion criteria of spectra with a signal-to-noise < 5, full width at half maximum > 0.143 ppm, or Cramér–Rao lower bound > 30% for Glu, tNAA, mI, tCho, and tCr in each voxel 4 and excluded the 8 voxels in the most dorsal row. We examined tau and Aβ PET with 18F-PM-PBB3 and 11C-PiB, respectively. Using the cerebellar cortex as a reference region, we quantified PET probe retentions as standardized uptake value ratio (SUVR). We made heatmaps to visualize Z scores of 18F-PM-PBB3 and 11C-PiB SUVRs and the metabolites to tCr ratios using data of HCs as a reference, and a heatmap of Pearson correlation coefficients between the metabolites to tCr ratios and SUVRs of 18F-PM-PBB3 and 11C-PiB. Based on the heatmaps, we chose combined voxels for evaluating the metabolites to tCr ratios between AD/MCI patients and HCs and correlations with 18F-PM-PBB3 and 11C-PiB SUVRs and cognitive functions of mini-mental state examination (MMSE). The Certified Review Board approved this study.RESULTS
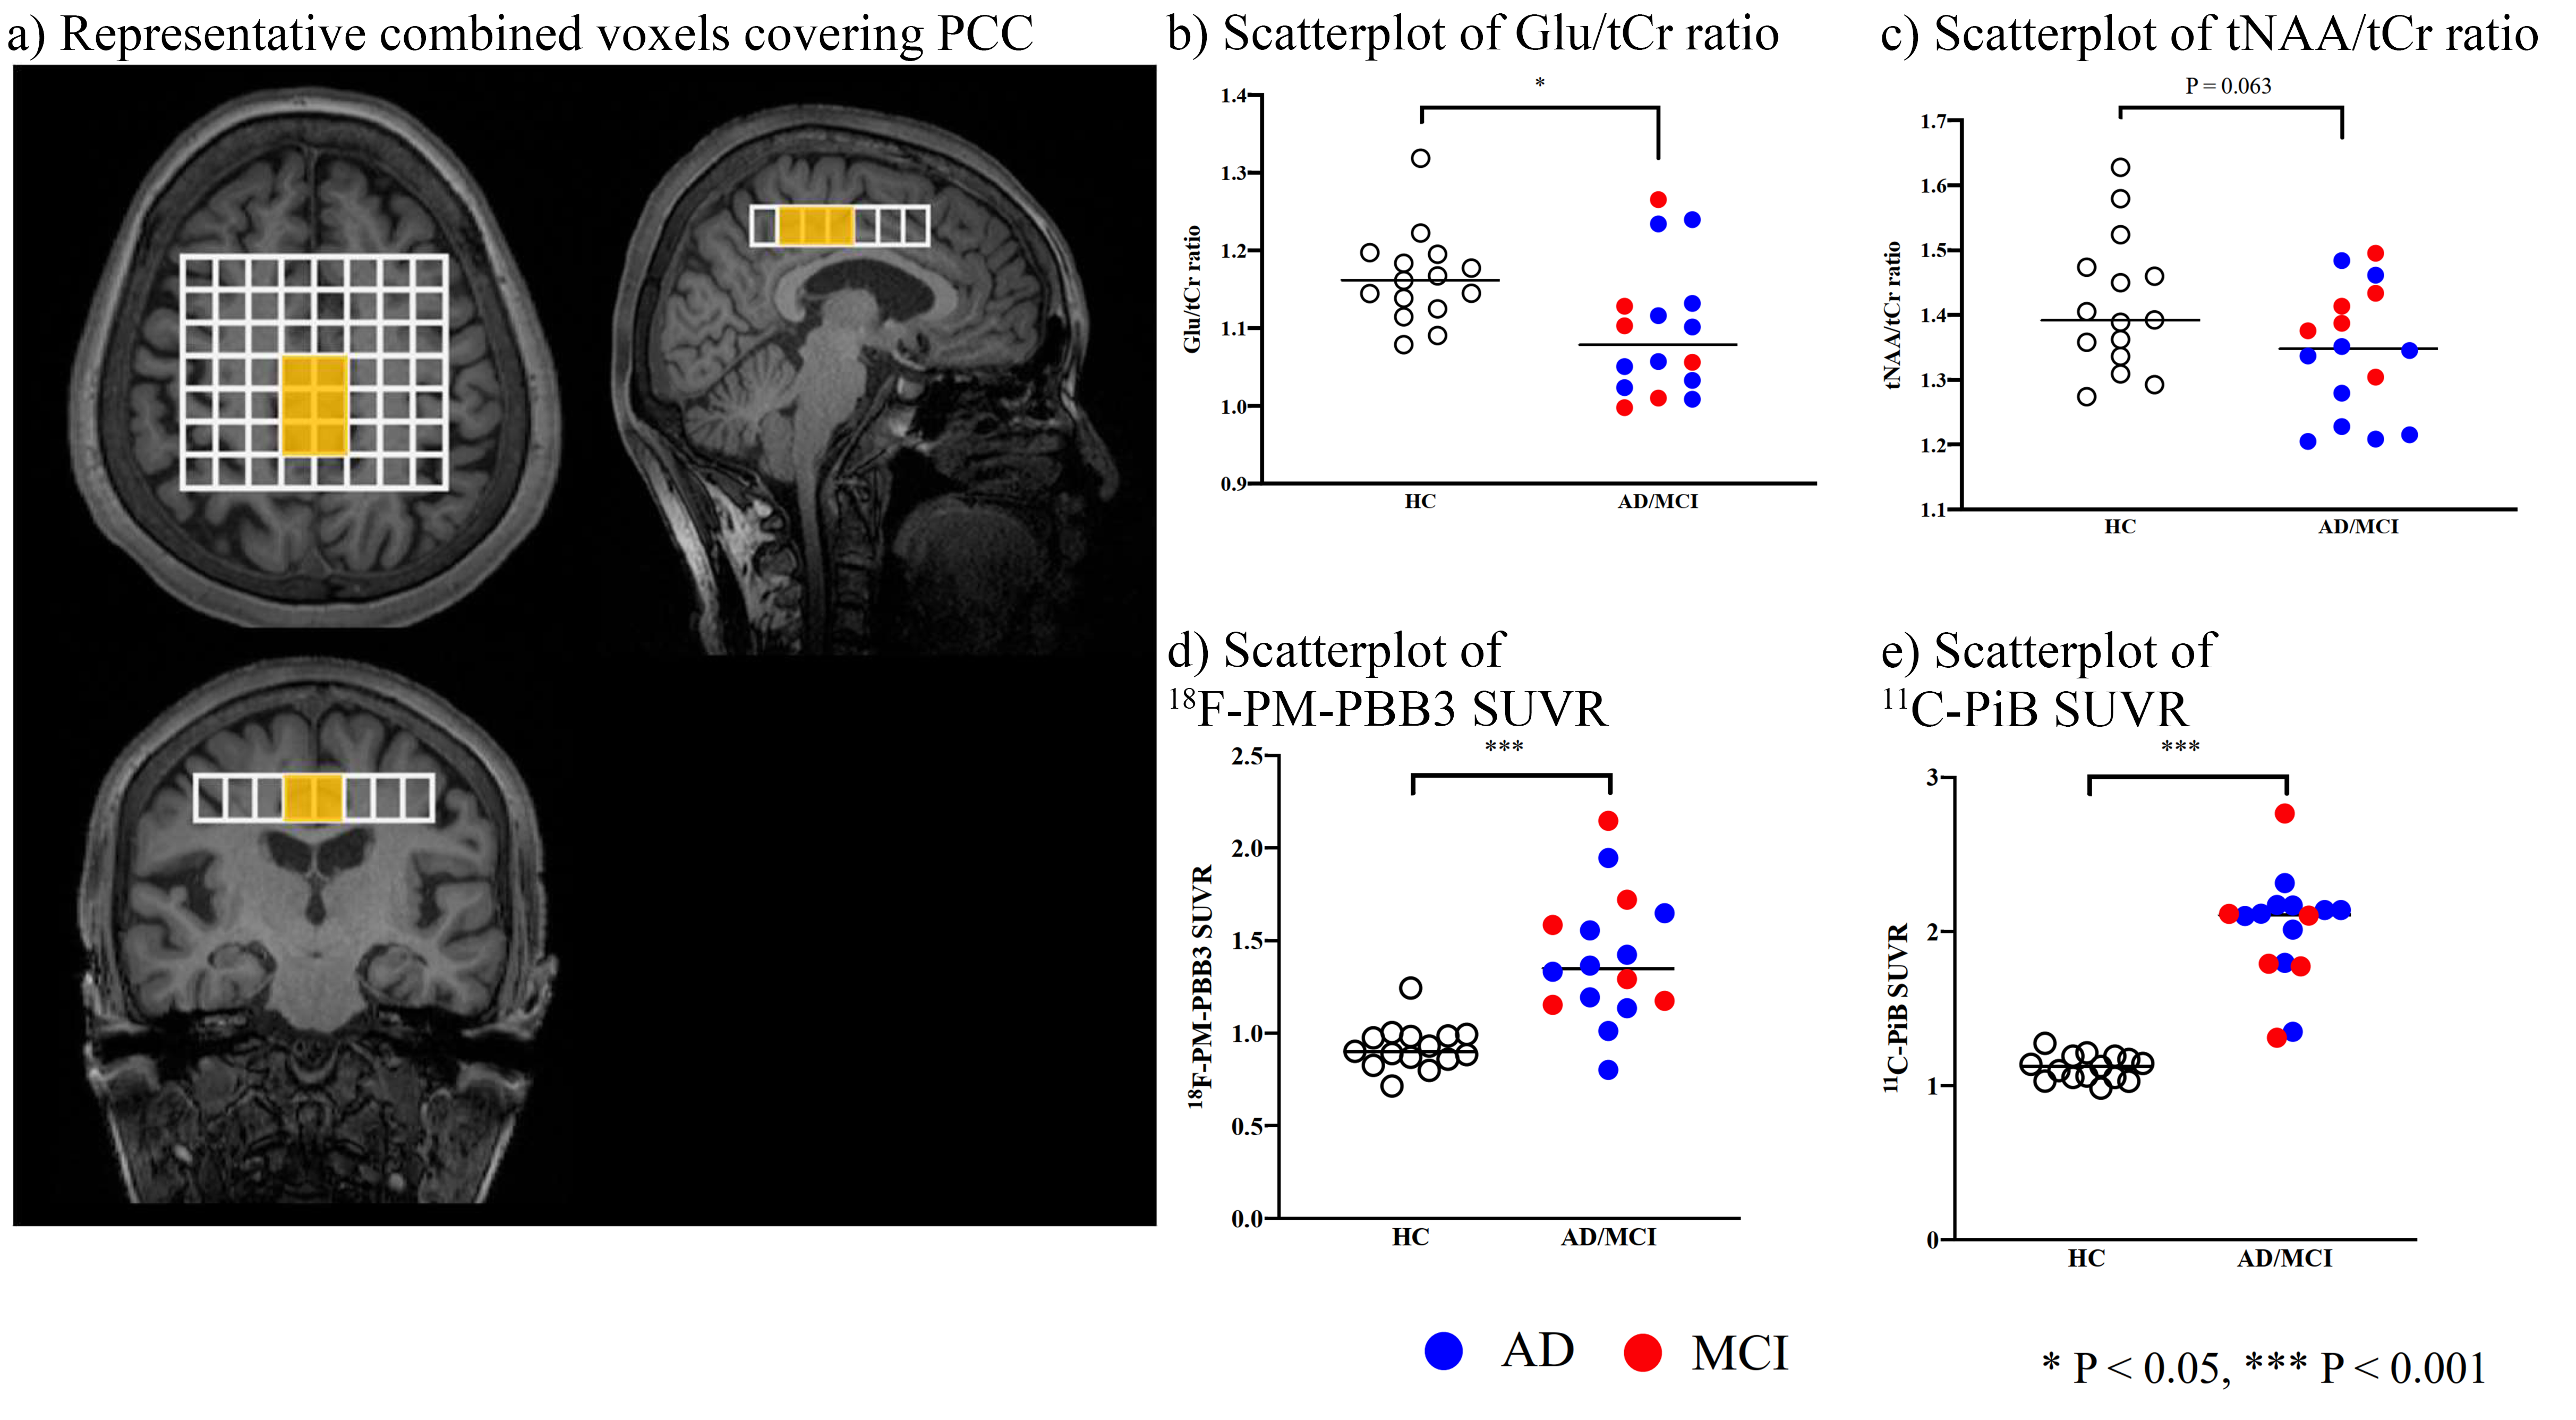
The heatmaps visualized decreases in Glu/tCr ratios in GM, especially in the PCC, and moderate increases in WM, while tNAA/tCr ratios were reduced in both GM and WM voxels (Figure 2). The mI/tCr and tCho/tCr ratios were increased only in some voxels of PCC (Figure 2). While both 18F-PM-PBB3 and 11C-PiB SUVRs were markedly increased in cingulate cortices and other GM regions (Figure 2), Glu/tCr ratios in the PCC regions were negatively associated with 18F-PM-PBB3 SUVR (Figure 3), revealing the vulnerabilities of the PCC region to tau deposits. Subsequently, we analyzed the combined voxels covering PCC, and found the reduction of Glu/tCr ratios (P < 0.05), increase of 18F-PM-PBB3, and 11C-PiB SUVRs in AD/MCI patients compared with HCs (18F-PM-PBB3: P < 0.001; 11C-PiB SUVR: P < 0.001) (Figure 4). While tNAA, mI, and tCho to tCr ratios were not significantly different in AD/MCI patients from HCs (tNAA/tCr: P = 0.063; mI/tCr: P = 0.76; tCho/tCr: P = 0.86) (Figure 4), there was a significant decrease in tNAA/tCr ratios in AD patients (p < 0.05). The Glu/tCr ratios were negatively correlated with tau deposits in the AD/MCI patients (r = -0.53, p < 0.05) and positively correlated with MMSE scores (r = 0.74, p < 0.05) in AD patients (Figure 5).DISCUSSION and CONCLUSION
Combining MRSI and PET, we demonstrated for the first time that the glutamatergic system in the PCC region is vulnerable to tau deposits but not Aβ. This result supports the rationale of many SVS studies which have focused on the PCC. The fact that Glu levels did not correlate with SUVR of amyloid PET but did correlate with SUVR of tau PET was also consistent with the assumption that tau is more strongly associated with neurodegeneration. This study suggests that Glu is an early marker of disease progression in AD. Glu levels differed from the HC group in AD/MCI patients, whereas tNAA levels in HCs differed only from the AD patients. tNAA levels showed a downward trend in GM and WM, whereas Glu levels showed an upward trend in WM. This may reflect the elevation of Glu in the WM with abundant extracellular space at the early stage of the AD pathology. 5 We found correlations between Glu/Cr ratios in the PCC and cognitive function. PCC is a core hub of default-mode network relating to several cognitive processes 6 and tau accumulations associated with disrupted Glu transmissions in PCC may play a crucial role in aggravating cognitive functions in AD. Collectively, MRSI combined with tau PET revealed the regionally variable vulnerability of the glutamatergic system to tau depositions in AD brains.Acknowledgements
The authors thank all patients and their caregivers for participation in this study, clinical research coordinators, PET and MRI operators, and research ethics advisers at QST for their assistance to the current projects.References
1 Riedel G, Platt B, and Micheau J, Glutamate receptor function in learning and memory. Behav Brain Res, 2003. 140: 1-47.
2 Butterfield DA and Pocernich CB, The glutamatergic system and Alzheimer's disease: therapeutic implications. CNS Drugs, 2003. 17: 641-52.
3 Wang H, Tan L, Wang HF, et al., Magnetic Resonance Spectroscopy in Alzheimer's Disease: Systematic Review and Meta-Analysis. J Alzheimers Dis, 2015. 46: 1049-70.
4 Zhou M, Zhou Y, Liao H, et al., Diagnostic accuracy of 2-hydroxyglutarate magnetic resonance spectroscopy in newly diagnosed brain mass and suspected recurrent gliomas. Neuro Oncol, 2018. 20: 1262-1271.
5 Bukke VN, Archana M, Villani R, et al., The Dual Role of Glutamatergic Neurotransmission in Alzheimer's Disease: From Pathophysiology to Pharmacotherapy. Int J Mol Sci, 2020. 21: 7452.
6 Leech R and Smallwood J, The posterior cingulate cortex: Insights from structure and function. Handb Clin Neurol, 2019. 166: 73-85.
Figures